
Mount Ontake as seen from SSE. Photograph courtesy of WIkimedia Commons, Atsushi Ueda.
This is an opinion piece about earthquakes, volcanoes and court cases. Last week we learned that a group of relatives to the victims of the 2014 Mount Ontake phreatic detonation that occurred at 11.52 on the 27th of October.
Before I start I will say that my heart goes out to the families of the victims. It is never easy to lose someone that is close to you.
The reasons for the court case
In Japan you can sue negligent civil servants for money if they have been derelict in their duty. The lawyer behind the case are stating two different things as reasons for the scientists having been negligent and derelict of duty.
The first reason is that on the tenth of October there were 58 small earthquakes and on the eleventh a further 85 small earthquakes occurred. This prompts the lawyer to state that the alert level should have been raised latest on the twelfth.
The second reason given is that two seismometers close to the mountain top were broken and that they had not been repaired by the scientists. The lawyer here states that it made precise recordings and predictions harder.
For the layman this sounds like a slam-dunk court case, but things are never easy around volcanoes.
The facts

Image of Mount Ontake taken on the 11th of October 2014. Do note that the 2014 phreatic detonation had not yet happened. Photograph by Alpsdake.
The first fact is a really important thing that I spend a lot of time arguing with people about. This was not an eruption. For most people this sound counter-intuitive, after all the mountain did hurl quite a bit of warm rocks about. But the thing is that a real eruption is a completely different kind of beast than a phreatic or a phreato-magmatic event. Let us look at the definitions.
Eruption – juvenile magma comes up from depth and is the main constituent in the eruption as fresh lava is expelled as ash or a lava flow (or any other form an eruption can take).
Phreatic detonation – This one is caused by water/magma interaction. It happens as water encounters a pocket of magma. This will flash-turn the water into steam that will expand 2 700 times in almost no time at all and a steam driven detonation follows.
Phreato-magmatic detonation – This is a special version of the ordinary phreatic detonation. As the water comes into contact it either blows out pieces of magma or remobilizes the volatiles inside the magma causing the magma pocket in turn to explode. These can be harder to differentiate from real eruptions, but the salient points are that no fresh magma has made its way up the conduits from depth and that it is water/magma interaction causing the eruption and not the magma in and of itself.
This may sound like nitpicking, but further down when we look at how to predict eruptions it will have major impact if it is a real eruption or not.
If we look at the earthquakes that occurred on the 10th and 11th of October they tell a story that is not related to juvenile magma moving up through the system. Instead they are more related to settling of the edifice due to shrinking magma pockets.

Seconds before death. Photograph from Japan Times.
As the edifice settled cracks formed and water found new conduits down into depth from the watertable. After that it took a little while for the water to move down and encounter the magma, then it was just a case of waiting for the pressure to become high enough.
For those who have seen regular steam explosions, a flash-conversion to superheated steam, “dry steam”, is a completely different beast. Even though it has a far lower energy content than TNT (Trinitrotoluen) it has 70 percent of its brisance force. Or in other words, 1 cubic meter of superheated steam will hurl as much rock as 700kg of TNT. And there is a lot of water in a water table under a mountain so the effect can be damnably deadly if you are in the way.
The problem with earthquakes of the type recorded is that they constitute roughly 95 to 99 percent of earthquakes registered in a volcano. They are the daily run of the mill version that almost never lead anywhere. It is common for spatterings of earthquakes like this to form small swarms without any subsequent phreatic detonation happening.
The resolution of our equipment is not good enough to exactly pinpoint pockets of magma, nor are they good enough to tell exactly how fractures form and where they lead during these small earthquake swarms.
Now some people would say that we should close down all volcanoes after every swarm. This would though be a two-edged sword. Yes, it would save a few lives to have almost every single volcano on the planet closed permanently (that would be the effect). The problem is though that the general population would rather quickly stop listening, since there will almost never be a blast after the earthquake swarm.
As I look at the earthquakes at Mount Ontake with a perfect 20/20 hindsight I can say that the earthquake swarm constituted a minute increase in risk for people on top of the volcano. The risk was mainly that there could have been a rockslide or a small edifice collapse, and that the smallest risk was that a phreatic detonation would occur. But the risk was so minute that there was no real reason to cordon off the mountain from visitors.
Now it is time to discuss the failed equipment. First of all, we have to discuss the cost of the equipment. Each seismometer or GPS is extremely expensive, they are also surprisingly fragile. It is a sizeable investment even for such a rich country as Japan to buy one, and one must remember that Japan has as far as I know the largest array of equipment on the planet and they do know how to use them very well.
At any given year half of the equipment will fail, and each time that happens a technician must trek to the piece of the equipment, often climbing or otherwise roughing it all the way. If the technician is lucky he or she can fix the problem on site, otherwise it is just to pack it up and walk back home to wait for spare parts or even a new unit. I probably do not need to tell everyone that after that there will be another trek to put it back into place.
All this repair work takes time and costs quite a bit of dough. There is also a considerable amount of hazard involved for the technician, even if he or she is experienced on how to behave on or around active volcanoes.
At some volcanoes it is even worse, during winter time it can be completely impossible to reach the equipment since the weather makes it too dangerous to even attempt a repair. This was not the case at Mount Ontake, and I am quite sure that repairs was scheduled for the equipment or even underway as the disaster happened.
Now it is time to move forward to the next issue with this particular lawsuit, and that is the not so unimportant question of accurate volcano predictions.
Predicting volcanoes

Seconds from Death. Photograph from a camera recovered on the slope of Mount Ontake, courtesy Japan Times.
I am a fervent believer in the possibility to accurately predict most volcanic eruptions. This does though come with a couple of caveats. One is of course that the volcano need to be adequately monitored with both equipment and staff. The second caveat is that the volcano need to have been studied for prior behaviour, the better known and the more we know about the style of eruptions and the better the pre-cursors are known, the more exactly we can be when predicting an eruption. All of this was in existence for Mount Ontake.
For a well-known volcano it is possible to accurately predict an upcoming eruption 2 times out of 3, or even better. Also, the bulk of the misses are false positives, so it is seldom that an eruption occurs at volcanoes entirely out of the blue.
So why did the scientists not accurately predict the Mount Ontake catastrophe? Well, here we come to the final and largest caveat of them all. We can only accurately predict eruptions, and there was no eruption at Mount Ontake. It was a steam driven detonation.
An eruption will originate months, years or even decades prior to various versions of lava being hurled out from the volcano. For a hotspot volcano the eruption starts at the boundary between the mantle and the crust, for a subduction volcano it starts at the magma-accretion zone deep under the volcano.
As magma starts to move from the respective places we will see an increase of earthquakes from there leading upwards as magma pushes the crust apart. There will also be signs of inflation in the form of uplift or extension of the area surrounding the volcano. At this stage a volcanologist will know that there is increased unrest under the volcano. Still it will take time before an eruption can occur, most of these intrusions lead to nothing in the end.
Sometimes the magma will continue upwards into an upper magma reservoir (or continue directly upwards). This is also noticeable in the earthquake record and on the GPSes. At this stage there may be changes in gases or fluids in or around the volcano.
As the magma progresses upwards the types of earthquakes will start to change as magma interacts with water tables and volatiles start to dissolute from the magma. It is at this spot it is possible to predict eruptions with an ever-increasing certainty.
And it is here we get to the kernel of the problem. Imagine that the volcano is a peach without a central stone (seed), and that to make it erupt you have to push in a stone into the center of the peach with your hands. The process would of course be very messy and give tangible evidence prior to the stone being in place.
To drive the analogy further, at Mount Ontake the stone was already in place and the peach looked pristine. Let us now imagine that we are looking at two peaches, one with a stone and one without a stone. From the outside they look the same, but only one of them can detonate unexpectedly and sprout things, the other peach is a dud. Regardless there will be no messy evidence trail to follow.
Now if we leave the analogy and talk specifically about Mount Ontake we will see the problem better. On the 28th of October 1979 ten vents opened unexpectedly at the then unmonitored volcano in a phreato-magmatic event hurling ash and steam. This was the first historic volcanic event at Mount Ontake. It has since been followed by a few more, the last prior to 2014 was in 2007.
The problem here is that the signals of the original intrusions happened prior to instalment of equipment, the first pieces of equipment was installed on the 29th of October 1979. The day after the initial phreato-magmatic event.
So, all that messy activity occurred before it was possible to notice what was occurring. For all we know the magma could have been emplaced years or even decades before the phreato-magmatic event. The only thing we can say is that no juvenile magma has risen up into the volcano after the 29th of October 1979. All phreatic detonations or phreato-magmatic detonations have ultimately been caused by activity prior to 1979. What is there then left to detect?
Well, we are left with small smatterings of earthquakes that may or may not lead to a small ash explosion. And the problem is that even small ash explosions can be quite deadly since they always will be unexpected.
The only thing that could have been done was to permanently close the mountain down back in 1979, or after any of the subsequent detonations. With the 20/20 hindsight this would be an option. Problem is that volcanoes are popular to visit and there is a high demand from the population to do so. In the end this is a political decision and not a scientific decision.
A word on volcano tourism

Fuego to the left and Acatenango to the right. Many people have died while climbing Acatenango. In January 2017 14 people died due to hypothermia. Courtesy Wikimedia Commons.
Climbing volcanoes is a deadly business, and I stress the word business. Local merchants love volcano tourists, this is also true for the so-called volcano guides that make quite a good business from bringing tourists and hikers up volcanoes. These guides most often leave quite a bit to wish for in the area of volcanic knowledge, at best you are slightly safer around them than you would be on your own.
I have climbed volcanoes for 20 years all over the planet. With all the expertise I have in mountaineering and volcanology I still prepare myself for days prior to climbing, and I meticulously check both weather and the activity level of the volcano. I also make certain that I am really fit before going and I bring a lot of equipment up the mountain so I will be able survive for a few days.
Almost every single time I climb I see tourists climbing in flip-flops, t-shirts and without water, following “guides” that I just wish to kick off the mountain.
Now let me tell you what climbing up a volcano is like. It is a gruelling multi-hour journey up what can best be described as a lose heap of crap. Every two steps upwards leads to sliding one step down. It will suck the energy out of you and you need several litres of water to not succumb from dehydration.
If it is a high mountain like Acatenango you will need to acclimatize prior to climbing and eat lightly before setting out, otherwise height-decease will likely get to you and you will be hurling your toenails out unless you are secretly a Tibetan Sherpa. If you live close to ocean level anything above 2 000 meters can cause serious height decease unless you are young and fit.
Many people will suffer from heart or respiratory problems that are so bad that they must turn back before reaching the summit, and it is not uncommon that people die from heart attack or a stroke.
If you have forgotten to bring water dehydration is likely to make you lose focus and you will fall down the mountain, or slip and break a leg or your neck.
Around mountains weather is fickle, it can turn in an instant and your t-shirt may be the only thing between you and storm winds with zero-degree rain or snow. Hypothermia is the most common killer on a volcano. You may also quite literally blow straight off the mountain, or be hit by lightning. Another killer is to be struck by sun-blindness due to the intense sunshine and strong UV-light unless you remembered to pack you’re a good set of sun-glasses.
So, you reached the top. You stand there with a slight headache and a grumbly empty stomach while looking at all the marvels of the geological world (or see nothing since there is dense fog). All is peachy anyway. Now it is time to do the entire trek back down, or go to sleep on top of the mountain to trek down the next morning. By now your legs are about as useful as boiled spaghetti.
In the end the risk is small that you will be killed by volcanic activity, the big killers are freezing to death, heart attacks, breaking your neck, crushing your head or any other horrible thing that can happen on top of a mountain.
Anyway, in a couple of months I am going to climb Acatenango. It is a hard mountain to climb since it is steep and high (3976m), it is so high that you are looking down into the eruption in the 3763 meters high Volcán de Fuego.
I currently walk 10 kilometres a day and I am going to lose 15kg before I go. I will spend a full week at 1800 meters’ height to acclimatize myself before going. I am bringing winter gear, well used walking shoes, custom made sunglasses and a hard hat.
The day before I will drink a minimum of 5 litres of water and eat a high carbohydrate diet to fill up the reserves and I will bring another 5 litres of water and 2kg of high fructose candy up the mountain. In the morning I will eat very lightly (mostly sugary stuff). I will also bring headache pills and a very small bottle of vodka against the likely height decease.
And most importantly, the morning before I go I will have a medical check (mandatory and performed by my lovely wife, otherwise she will not allow me to go).
Now, ponder the difference in level of preparation I do before I go up a mountain and the average volcano tourist. And still I acknowledge the dangers of what I do.
My point is that anyone who climb a volcano must be prepared to meet their end, it is really that dangerous. Sometimes I wish there was a ban on climbing most of the world’s volcanoes.
I will though say this, the feeling of reaching the top of an active volcano is like no other on the planet. I would not have it any other way.
I think in the end the point I am trying to make is that anyone who would sue a scientist for me dying doing what I love would be misrepresenting my memory.
CARL REHNBERG


Wow good write-up!
An offtopic:
i made plots of latest (~2012) gravity anomaly data, and put them side to side with IMO plots. Now interpreting gravity anomalies can be tricky. But Generally in volcanic regions, negative anomalies can be related to pockets of magma or magma chambers, tho it can be very influenced by the surrounding rocks and layers. Generally you can see the Bardarbunga chamber on the plot and the larger negative anomalies could be the underlying centre of the “plume pulse”. I leave further interpretation to people more experienced in this field.
If needed, these images/plots can be freely used in any posts or other comments.
Highly interesting patterns that emerge. Especially around Eyjafjallajökull.
Ohhh Its very interesting….!
– Eyjafjallajokull pocket of magma, originated from eruption in 2010
– Hekla already fully charged back in 2012 (this was well known). Magma seems to extend slightly NE-wards
– No significant magma in Torfajokull, or Vatnsfjoll or Tindfjallajokull.
– Katla: interestingly no negative anomaly, but one small anomaly (magma pocket) at Godabunga!!
– Plenty of hotspot magma around Bardarbunga, but especially towards Holuhraun, already back in 2012
– Plenty of magma also towards Kverfjoll and Oraefajokull!
– And negative anomalies towards Esjufjoll
– Also a magma chamber in Snaefell, in the east, this volcano was unknown whether was dormant or extinct. Now we know.
– Some magma at Askja caldera, but nothing at Herdubreid. Sorry to disappoint you folks.
– Interesting anomaly shows a dike between Grimsvotn and Hamarinn, as long suspected. Also some negative anomaly near Thordarhyma and Laki region…
– Nothing at Veidivotn
I would not over-interpret the anomaly charts though. There is ample evidence of magma under Katla and at Herdubreid that is evidenced via other means. Gravity anomalies is just one tool of many 🙂
depth of pocket maybe, contradicts the gravity anomalies?
@Carl another thought, could this shallow activity in Katla be the spreading of the crust you mentioned, in relation to Hekla. Just wondered as we now have activity West of Hekla after a few days of Katla again?
It is partially caused by spreading.
Re Katla, a journal article (Sturkell et al., 2010) that Jon provided a link to yesterday states that “The inferred volume of magma accumulated in a shallow magma chamber at Katla during the 1999–2000 inflation period is approximately 0.01 km3.”
Here it is important with one distinction. That is believed to be the yearly magma input.
Something happened in my copying and pasting: the period should have read “1999-2004”. The quote is from p. 18 of this article: https://www.geo.umass.edu/climate/papers2/Sturkell_etal_2010.pdf
Mini rant here:
Am I the only one who hates how the color scales on programs like this (or Insar) use the same color multiple times? Looking at the graphic, I can’t tell if the white listed here is an area of high gravity or low gravity. Same goes for the bright purple, Makes no sense to me..
Its makes as much sense as possible. It is a linear parameter with a linear color scale. If it goes red to white it is obviously positive anomaly. Otherwise it would have to go over all the purple and green and blue to get to negative white which is not even seen anywhere. mostly its just positive anoms with negative (volcanic?) regions.
You cant make it more simple than this, other than using just two colors, black and white.
It’s still tough to discern casually. If they used a color scale that set the upper and lower boundaries of the dataset to be opposite ends of the spectrum, and allowed all other colors to lie in between those, it would be much easier to read and gauge the differences.
This was not a criticism of you or your plots down under, they’re awesome!
I find any colour scale maps confusing with my colour blindness, geology bedrock maps are a headache… There’s a purple colour in the map above? Still, credit to Andrew for creating the maps. I’d love to see a direct overlay of the gravity anomaly maps over the satellite maps of each area.
Do you have also data for the area running between Reykjanes and Langjokull (SW of Iceland)?
Interesting article, it would seem you missed a word or two
“Last week we learned that a group of relatives to the victims of the 2014 Mount Ontake phreatic detonation that occurred at 11.52 on the 27th of October.”
The comment about tourists in flipflops brought back memories of tourists hiking to Trolltunga in Norway, wearing tshirts and flipflops, and having a small sandwich in a plastic bag… It’s a 22km hike in rather unforgiving terrain, and the local rescue services want restrictions in place, demanding that people who are going on the hike take a certificate of some sort before going on the hike, or other limitations.
Easy to judge with hindsight but this was an event that I watched in ‘real time’ as a television crew was approaching the top, filming as they went. Families were walking in front and behind becasue it was a public holiday, and the mountain was packed with visitors going up and coming down. As the blast went up oohs turned quickly to a more urgent appreciation of danger and they turned to go back down, along with everyone else. The rocks and rubble started falling and the filming went grey and then black and then stopped. People who made it to the shrine half way up the slope heard those outside cry out for help as they were buried under rocks and ash, and some rocks crashed through the roof. It was a popular walk to the lake at the top and a tragedy that could not have been predicted with the information that was available at the time. Very sad.
Also – something that perhaps gets forgotten is that the eruption lasted for about 2 months. The webcam some distance away showed the ash cloud at the summit as the winter came, and then snow covered the ground. A snowman was built in front of the camera and as the snow thawed it slowly fell apart……. Then the snow went away and the eruption ceased sometime around early December, I think
Detail is analysed here – http://www.nature.com/articles/ncomms10797
Some footage and an article from the time
http://www.japantimes.co.jp/news/2014/09/27/national/central-japans-mt-ontake-erupts-hikers-reported-injured/#.WJEH8X8gGSM
Awesome post, Carl.
I can relate (a very little) to your experiences climbing – when I was in the Navy, a few of my friends and I would use some of our liberty to go “scrambling” up some of the rubble piles (it is difficult to describe them more accurately – although your “piles of crap” seems on the nose) around the Salton Sea and Imperial Valley of California when on detachment to NAS El Centro. We would pack lightly (they were only around 5,500 feet) but even though it was mid 90’s at the base, we never failed to haul up (and back) with us at least a pitch of rope – if not two, a sit harness, sweatshirt/pants, a windbreaker, two days of food – power bars, jerky, jolly ranchers, and the like – and all the water we could carry; for each person! It never even occurred to us to pack less, not to mention that the harness/rope saved me and my friends from our own stupidity more than once. These scrambles were planned to only be one day – but Mother Nature can’t read and doesn’t seem to care what our plans are.
But, to sue the State of California for MY stupidity and/or lack of personal risk assessment – that would have been ludicrous.
Very good article,Carl to me, anyone that goes unprepared,
(In aviation the stories are too numerous to mention.) of people
who do not check conditions potential hazards and either
expect nothing or rescue. I have as two good friends, a retired
Air Force Major who flew Rescue Choppers in the Pacific NW
and _Afghanistan_. The other is a Local SAR Helo Pilot.
They both have stories.
As my old Chief Pilot said:
“It’s not so much the fear of Death that bothers me, it is doing
something stupid while dyeing …” Dave Kelly..
Spell checker won’t let me say dieing.
As an experienced volcano hiker, I must agree with Carl. You hike volcanoes at your own risk of death. Period.
This is rule number 1.
Rule number 2. A volcano that is steaming or smoking is even more likely to kill you – like mt Ontake – because the steam is a sign of still-hot magma located somewhere within the volcano edifice, which if for some reason becomes in rapid contact with water, can create a sudden and unpredictable phreatic denotation (which is deadly). In Iceland this applies for many volcanoes, which are popular for summer hikes, like Hekla, Torfajokull, Askja, Krafla, Krisuvik, Katla or Hengill. Long dormant volcanoes (like Skjaldbreidur) are much less likely to do so. So these are significantly safer.
Rule number 3: Don´t think about running away scenarios. Phreatic events are fast, as well as the initial stages of an explosive eruption. Within seconds of hearing a rumble, you will see a vast ash plume and within a minute you will be killed.
Rule number 4, and perhaps more important: In my experience, in most countries, the risk is not well stated to the tourists, for fear of scaring. In Iceland, the culture is “you are at your own risk”, but obviously authorities will close down a mountain if the risk is high. Still, there are tourist dumb enough to even then try to hike such volcanoes.
In third world countries the safety is significantly higher. Because locals live off your dollars, so they will not close the volcano even if risk is very high. I give you a few examples. In Indonesia, there is a village where locals live in the edge of the caldera of Mt Bromo, just 2km away from the main vent. Tourists routinely stay overnight there. I did that. In Jan 2014, the volcano erupted, and the tourists could still stay in the village but were not allowed to hike down the caldera, but there was nothing closing down the road down the caldera (and not even locals would tell you that), so you could do that, endangering your life greatly. This situation applies to many other third world countries. So travel to volcanic regions at your own risk!
Rule number 5. What Carl said about volcano hiking…. well, that´s all true, completely true. A must for any volcano hiker. The risk of following bad guides, the risk of weather, the risk of falling down, the risk of altitude, not to mention the risk of an eruption. And especially the nervewracking process of negociating your steps atop volcanic gravel, which wants to slide downhill, pulling your feet alongside! If there is ice, as often in Iceland, the combination is pretty dangerous.
Now, one little tip to Carl. With very long hikes, and depending of course in your body, it can be wiser to start eating in the early stages of a long trek, something more like nuts (fats or protein) rather than carbohydrates or sugar – because of the risk of sugar spikes. At least I have this, so I want to avoid sugar rushes, and tire my metabolism. When I hiked 2250m ice-capped Oraefajokull, 16 hours, I started eating nuts and some dried fish, I left the energy bars for a bit later, and the energy drinks for the last and harder stages (the sugar kick was then very welcomed). This was the precious advice I learnt from my guide which was a highly experienced alpinist (count everest, north and south pole)
And I wish you an excellent hike to Acatenango! best wishes!
Hello Irpsit!
I agree on the diet thing if you are first hiking a long distance. The onset of height disease is far slower than and you will need the fat and proteins for the long walk. Straight up like Acatenango it is though better to be empty and go on sugar. 🙂
But, these are tricks you should learn well in advance if you do what me and Irpsit do. Best is to ask us in here 🙂
Why am I so picky about height disease?
Well, Life is not anything like in a Bear Grylls fiction story. If you start hurling you will become dehydrated quickly and your blood will become thicker increasing cardio-vascular problems, you will become Dizzy and lose focus and will start to stumble. You will lose salts, and you will continue to puke if you try to continue.
Your only alternative is to descend rapidly. At best you will have lost thousands of dollars, at worst you will become just Another corpse on the slopes of a volcano.
Blimey, I sort of knew, in theory, that going up Volcanoes was dangerous, but between treacherous ground, ice, falling, altitude sickness and eruptions, I hadn’t realised how dangerous.
And it doesn’t just dangerous, it sounds hard.
I know that the rewards of getting up there must make up for it… or you guys wouldn’t keep doing it… but I think I’ll stick to watching volcanoes from a distance.
Hope you have a great hike up Acatenango, and share loads of pictures so that us armchair volcano watchers can enjoy it too 🙂
It is a hard trek, but it is Worth it. And I normally have a particular reason to shlep up a mountain, ie. a Point of study 😉
I will take pics.
Samples maybe?
There will definitely be a few samples in my bag if I come down 🙂
Headaches, vomiting, and stumbling: it is very hard to spot the differences between “normal” altitude sickness (which is benign) and High Altitude Cerebral Oedema (which kills, quickly). But staggering is a definite sign that it’s time to descend so as to recover.
Mountaineers acclimatise in stages by doing 500-800m of ascent and then descending to sleep lower. After that one then goes a bit higher before sleeping lower again. Gradual accumulation of altitude is reckoned to be prudent, even in the Alps on peaks below 3500m.
I have a offtopic question for you guys. Here in Austria there are lakes which I am hoping that they freeze. But the problem is that they are deep lakes (about 25km2 and 150 meters depth). They last froze fully in the cold winter of 1963. Before that, they froze in winters like 1929 and many winters of the little ice age. Usually in such winters, the lake freezes by end of January and remains until early March.
Thing is: water has an amazing heat storage ability so it takes a awful lot of prolonged cold to do the job! Currently the lake surface is still at 1°C. Some bays have frozen a bit, but that´s 1% of the lake surface perhaps. The lake seems to have cooled down 2°C over the past two weeks with average temperature around -7°C. In the lake, there should be a large amount of water at 4°C, which is basically a heat reservoir from the warm summer of 2016, and even the mildest winters of the former 2-3 years.
The forecast however is for a chilly freezing early February, so the likelihood to see a frozen lake is quite good (but one must consider the storage of heat in the lake from previous months).
Question is, how long should I wait until the lake starts freezing, assuming this average temperature of -7°C remains. Actually, temperature does not change much, because freezing fog has persisted over the lake for the past weeks. I would assume, that at the current rate, that freezing could start within a week or two. But I am looking to hear someone with a physics perspective.
Assume lake has 1km3, and average temperature in bottom is 4°C.
I got my answer by a google search, in historical records. It takes 3 weeks, from the moment when the lake starts freezing in the rims and some inlets, until the full 25km2 are completely frozen. At this rate, I should expect the lake to be frozen by mid February.
Alert level raised to Yellow at Takawangha in the Aleutians. Strong earthquake swarm. No known historical eruptions, last known eruption around 450 years ago.
Almost a :star:
Tuesday
24.01.2017 20:18:38 64.664 -17.471 6.7 km 2.9 99.0 3.8 km NE of Bárðarbunga
from IMO
Good advises for all mountain trecking, not only volcanos! In addition, volcano trecking need much more attention if we can not trust the dollar hungry tourist guides. Thanks to Volcano Cafe I am nowdays much more aware of the risks and this post will make me very cautious before future volcano trips.
I was never particularly enthusiastic about walking up Hekla but having learned what I have on here, in particular from Carl’s (highly informed) fear of it, I can confidently say that I am now keeping very clear of it.
I have been up several volcanoes during an ongoing eruption, among them Pacaya.
But it would take an ungodly amount of dough to get me up Hekla…
In the end (hopefully 2018) we hope to do a safeish tour of some volcanoes, but it is still in the planning stages and I am not the one calling the shots about it. I will just give lectures and guide a bit.
I may even hold a beer tasting of Icelandic beers… 😉
24 hours after it had finished erupting, I walked up one of the craters formed during the Krafla Fires in July 1980. I can still vividly imagine the taste and smell of the acrid fumes emanating from the vent — no wonder Icelandic beer is so good!
I have not yet found the resistance page of USGS, but here is the free US National Park Service Twitter Feed. That should at least tell us if one of the national park volcanoes is erupting.
https://twitter.com/AltNatParkSer
At last, a topic on volcanocafe about which I have SOME genuine expertise !
I was a legal representative for 22 years. Carl, I don’t know if you have any experience of working with law, and I don’t have any experience of the Japanese legal system, but considering most people struggle to follow legal thinking, I just wanted to congratulate you on your very erudite assessment of this matter.
Entirely coherent, and to me, a very credible case.
And as I have come to expect, a good read. Thanks.
It is a badly known secret that my second education is in business law and that I am a member of the Swedish bar association… Mea culpa, mea maxima culpa 😉
Surprise, I do actually have a day job 🙂
Then you may have some insight into why I decided 22 years was way more than enough law to cram into one lifetime ! 😀
I worked as a welfare benefits tribunals specialist, working on the UK’s upper tribunals mostly, starting as a paralegal.
I have narcolepsy… reading 30 pages of relevant case law…..
I caught up on a lot of sleep on those !
But I don’t regret it, and I am grateful for the discipline of systematically and critically assessing evidence and lines of reasoning.
It definitely comes in handy.
It does come handy quite often.
I should though clarify that I do not work as a lawyer, but I do find a good knowledge in law to be advantageous in my daily job. And it is a good tool to use when reading non-scientific text.
Certainly. It provides invaluable means of weighing up those things which come down to “Balance of probabilities”.
And now I run a gift shop.
Actually, I think there are lot of similarities building a law case as one of my friends does as a prosecutor and writing scientific reports/papers as I am doing. Both are about putting data together and present to convince the jury/reader
Updated Map
https://vatna.carto.com/builder/41c420c6-1d91-479b-b450-6e8f88e962a5/embed
Thanks Ian. Very interesting!. It seems that the weak somewhat deeper quakes in the Katla caldera a few days ago are not in the same place as the stronger shallow ones that came later. Not easy to say if there is a connection..
Has the land of the free begun the censorship of science?
http://www.bbc.co.uk/news/science-environment-38746608
More like snatching a soap box out from under a snake oil retailer. If my taxes have to pay for it then it had better be capable of standing on its own merits.
https://wattsupwiththat.com/2017/01/25/the-beginning-of-the-end-of-epa/
Just read this article, I didn’t see any honest arguments on how the EPA was being abused aside from “radical leftists have taken it over” etc etc. Way too much rhetoric and not enough substance. Oh, also, this guy is being paid by coal companies as a climate denialist, there is that too.
That’s not to say the EPA hasn’t had it’s issues, but this article is very obviously politically biased.
“This reform would produce a second huge benefit by ending the government’s war on affordable energy. EPA is the principal funder and advocate of global warming alarmism, the myth that man-made climate change is a crisis”
Keep in mind, this is written by a climate denialist and a guy who works for a conservative political think-tank funded by coal companies and writes for Breitbart. Also, while WUWT has some interesting stuff, they are also a locus for climate denialism. Also, this guy spent 6 months in prison for defrauding the EPA itself.
War on affordable energy? If that’s what you’re looking for, you need to go to Nevada, where the government there is attacking the cheapest energy option in the world at the behest of entrenched interests in the utility industry. To be precise, they’re trying to regulate SolarCity out of existence, which would force people to use the second-cheapest energy source (and the dirtiest): coal.
Wyoming is pretty bad as well https://cleantechnica.com/2017/01/20/wyoming-bill-penalize-solar-wind-energy/
Scary development. Russian style. Remember Tjernobyl….
Or if you’re even older, remember Windscale? Released a helluva lot of radiation, but because there wasn’t a dramatically visible explosion HMG wre able to keep a lid on it -both literally and in terms of official coverup
Remembering friends who died of leukaemia from Windscale Sellafield leaks in the 1960s. There was more testing of grasslands in dairy farming areas after Chernobyl and some farms were barred from selling milk for decades
And, when “science” is driven by an agenda, it is not science at all. It is rhetoric. Science stands on its own merits.
https://notalotofpeopleknowthat.wordpress.com/2012/01/25/how-giss-has-totally-corrupted-reykjaviks-temperatures/
Agree, and data/info/results should not be hidden..
Caveat: I am no Trump supporter. He wasn’t even my 10th choice, but enough of that – he is here to stay, it seems…
Word is, this administration wishes to change the EPA from it’s current regulatory writing and enforcement make-up into more of a department resembling the structure and mandate of the Department of Energy. Dunno what that means, but … ?
I (personally) do not subscribe to the “why’s” of the “Anthropogenic” portion of climate change. I do not argue that the earth is not warmer. It is. I get it. I believe that CO2 output has less to do with it and mankind’s 100+ year clear-cut & pave-it-over expansion is a larger contributing factor. Just look at pictures of the globe from space at night – all of Europe & western Asia, the Indian sub-continent, North Africa, southern Africa, Japan & East Asia, Indo-China, most of North/Central America, and the coastal outline of South America & Australia are big, blaring Urban Heat Islands (also, buildings are heavy – which could explain some of the apparent sea-level rise for larger coastal cities as they sink). The stored day-time heating in these paved and concreted areas just re-radiate into the night, not to mention that trees, stupidly, refuse to grow in concrete or asphalt, so the carbon uptake has lessened somewhat.
Since most of the raw data is not made public (proprietary or some such) and combined with a lacking of a detailed analytical reasoning (massaging the data), I tend distrust most historic climatic reconstructions and forward extrapolations, as I do not believe that UHI and large scale landform modification is taken properly into account. Temperature proxies can only tell a story of an organism (or ice core) in a specific location; an organism that is more dependent upon local conditions than that of a regional or global climate. Two trees, side by side, can tell two radically different stories.
For these reasons, and my innate cynicism, I tend to question ACC and what impact my 2009 Honda Civic has upon it, and I am happy to expound upon it at great lengths. I was taught that ‘science’ – like ‘love’ – is a verb. Action and open thought is the antithesis of ‘consensus.’
Plate tectonics is a prime example of a ‘settled science’ being tossed on its head, and I am old enough to remember the immediate aftermath of it. Try explaining that process to your mom at age 9 or 10.
I am just saying, debate and question everything. Otherwise, it becomes a ‘religion’ – and I will only ever believe in one God.
And your car has actually little impact on the grand scheme of things. It is the sum of many millions (billions) of people engaging in destructive activity.
It´s massive CO2 emissions also from cars, airplanes, trains, trucks, etc…. If all those would be electric, we would solve a part of the problem. But a larger problem remains.
It´s farming, from forestry to grasslands, to agricultural land, leaving the soils bare and there goes the carbon sink, eventually, becoming deserts. This is probably the largest CO2 net contributor. Then, many millions are burning forest, without ever replanting it, burning trash, burning, burning, there goes more CO2.
Then comes animal raising. CH4 and also CO2 in a large scale. And that comes in land that would otherwise be forest (hence a larger carbon sink).
Some human activity actually contributes to climate cooling. Aerossols, SO2, soot pollution, etc…. The scale is also large.
Literally our civilization is designed in such a way that makes its contribution to the planet the worst possible. And if we included a nuclear war, then we literally have destroyed the biosphere, also via triggered rapid climate change.
But we could do different.
In alternative to CO2 transportation, let´s do electric, solar or biomass.
In alternative to destructive farming, let´s do sustainable agriculture, agroforestry, permaculture, much more forests planted.
Possibly less food from animals, more from plants.
With these 3 changes, we could indeed avoid most of the damage.
I am catching up on my reading & would like to give my opinion.
VerboselyLaconic, I agree with you. I have a list of many scientists that question the accuracy of IPCC climate projections, arguing that global warming is primarily caused by natural processes, arguing that the cause of global warming is unknown & arguing that global warming will have few negative consequences. Then there are those that do. I believe there isn’t a consensus on it. It is not denying science, because science is constantly observing and studying things. I too, believe in one God, but that doesn’t cause me to not respect others opinions. We should debate & question everything.
Now back to all things volcano. 🙂
I am sorry to hear you say that. There is discussion on the accuracy of the predictions – whether the warming will be within the IPCC range, lower (unlikely) to higher (also unlikely). But I do not know a single scientist who disagrees with its conclusion that the measured global warming is CO2 driven and that it is caused by human activity. This has become a battle against science and I am disappointed -but not surprised- that publicity beats research. The idea that there is no scientific consensus is fallacy. But who do you believe?
The dominant uncertainty in the models is in how much CO2 we will emit. Here the IPCC has various projections, but this is in the hands of the politicians.
The physics of global warming is not difficult. It is not rocket science. But listening to some of these people, they would question the law of gravity if they found it inconvenient.
This has not been between science and religion. Both have argued for the importance of stewardship. It is between living for our children and living for our money. Or, it seems, for someone else’s money.
Anyway, that is my opinion. I know science, its strengths and its weaknesses, and in this case the evidence is strong and unequivocal. I know less about people – what motivates their choices and actions.
https://m.youtube.com/watch?v=EYPapE-3FRw
Not many paved cities in the oceans – and they are warming. None in the arctic ocean – and the ice cover is the about the lowest recorded for mid-winter. Sea level rise happens also away from coastal cities: the most important part at the moment is due to expansion of sea water as the seas are warming. Ice melt will become important later in the process. You can argue about the speed of warming, but +2C is already unavoidable based on what has been emitted so far.
The previous Canadian government gagged its scientists. Will the US go the same way? I hope not!
Yep, they are ungagged now and with the change in Government we just started paying Carbon taxes on all of our energy. Some people who heat their homes with electricity are hurting and not able to afford the increase.
So, even though change is happening, unless the biggest offenders in the world actually do something, small impact countries will have little to any effect on solving the issue
https://youtu.be/MhC-T0vgFjA
Albert, again – don’t take what I am saying the wrong way; I am not arguing that it isn’t warmer or warming. I agree it is. I can see with my eyes and feel it as well.
What I question is the established cause(s) with the correlated severity, since many of these causes appear agenda or career driven. And you are correct, there aren’t many paved cities in the oceans, or on the Arctic Ice-pack – but they also lack large carbon emitters out there as well.
So yes, the pack is thinner since – I think SciAm stated 1980 as its base year – but how thick was the pack mid-winter 1880? Or 1580? 1080? The year 1980 is used because it is as far back as accurate, high-altitude photos of the ice cap exist (weather sats and what-not); before then was only localized spot-checks when someone tried to sail their tall-ship through it. Accurate and global sea-surface temperatures are only slightly older with a large buoy network, considering ENSO, PDO, AMO and other like anomalies are recent discoveries. Accurate and global land-surface temperature readings really only exist post-WWII (even though some reliable, isolated records go back to 1880) yet these are still, primarily from where large gatherings of people live – UHIs.
All I am saying is that a little skepticism, especially on a subject that is so global in its nature and impact, is healthy thing. For all people. Also, complete academic and raw-data transparency wouldn’t hurt either.
A little skepticism is a good thing indeed.
But, your hypothesis does not seems to hold. In the Arctic, as for instance in Iceland (let´s say a station in Snaefellsnes peninsula) temperature is measurably increasing ever since the 1980s, and CO2 too, but in the region there is barely concrete structures or local CO2 emissions. The area barely changed. Same goes for example for meteo stations in the Azores, located in the middle of the ocean and where development has barely increased.
So I think it can´t be concrete and urbanization that is responsible for elevating the Earth temperature, in its entire scope. It must be another process.
Also this applies for Sea level rise. This is detectable in many areas without any development. (Iceland does not count, because there deglaciation uplift is still superior to sea level rise)
Global climate warming is a fact. You agreed with it too.
The fact that climate warms in response to CO2 is also a well established fact, with many ups and downs in the past millions of years. The correlation is there. The causality however can be questioned. Still, this does not necessarely makes us climate denials. You will see why.
Other than that, we see regular ice ages, mostly due to orbital factors. Melting and ice formation are probably due to orbital forcing and feedbacks like albedo changes and disruption of oceanic currents.
There are other variations: ice ages 1500 year climate cycles, solar activity and maunder-like minima, volcanic eruptions. At the moment, however, these factors do not explain the current warming.
In the past decades, the climate seems to be warming mostly in response to CO2. And this rapid increasing CO2 is from human origin.
We know that in the past, rapid changes in CO2 and CH4 can trigger also fast climate change, from biological or biochemical sources, or, in our present case, from the burning of fossil fuels, farming and animal raising, and destruction of forests (which are carbon sinks).
Its not just CO2. Its a whole range of disruptive human activity.
I have also seen research that appears to show that CO2 increases in response to temperatures; so, for what it is worth, there is that.
I am not stating, as I believe neither are you, that there is a single cause to the Earth warming. But, I don’t believe CO2 is the boogyman most make it out to be and should not be used as a bludgeon to beat detractors into submission with – this is what the EPA has attempted these last few years. UHIs and landform changes are not THE cause of warming, but rather they bear a larger impact on average global surface air temps than does CO2. CO2 is, by all accounts, airborne plant (and algae) fertilizer. Although impossible to test, if humanity were to reclaim the global landscape to 18th or 19th century conditions, with our current CO2 levels, flora diversity and growth would explode.
So, what is the answer? Rollback human progress? Using the US as an example:
– It could be argued that the eastern seaboard, from Norfork, Virginia north to Bangor, Maine is one large metropolis. That is a lot of BTUs of UHI heat there – should the sprawl be dozed and forests replanted?
– The farmlands in the piedmonts of Virginia, Pennsylvania, North/South Carolina, Tennessee, Kentucky, and Ohio have taken the place of historically hardwood forests. Replanting them would sequester countless tons of carbon.
– Irrigation runoffs from the Breadbasket of the central US into Alberta, Saskatchewan, and Manitoba lead to algae blooms and anoxic events in the Gulf of Mexico. Stop farming and return it to temperate savanna.
– The Colorado River is so dammed that there is hardly a trickle into the Gulf of California, so no further “renewables” or water can be milked from it for the Central and Imperial Valleys of California. Restoring the natural flow would return the Colorado Delta and nutrient input into the Gulf of California, restoring an ecosystem long lost.
– Reduce the number of FF power plants and increase the number of bird blenders across the northwest.
– Stop mining coal, tar sands, and/or drilling new wells and use solar instead.
If we replicated this (as applicable) to every other First World country, you could bet that a “Carbon Footprint” would be the least of your worries.
No, even going to this extreme, there is no guarantee we would “fix” the climate.
Again, I just do not think that carbon is nearly the climate boogyman everyone makes it out to be. Nothing I have ever read comes close to convincing me.
“It could be argued that the eastern seaboard, from Norfork, Virginia north to Bangor, Maine is one large metropolis”
… Megacity One.
Don’t worry, I am open to discussions. But I have done the calculations/modeling myself so I know a fair bit about it. And I have learned that (1) global warming is real and man-made; (2) the bottom range of predicted temperature changes is survivable but the top end of the range is catastrophic; (3) the effects are limited in the most developed countries (the UK comes of very lightly, and Canada does well) but is very bad in other places such as the MIddle East and Africa. Australia is in trouble too. Less certain but plausible is that the wars that we are seeing in Africa and the Middle East are already climate-driven. Water wars are predicted in the Middle East and in my opinion are a contributing factor in Syria. (Went to a talk a few days ago about the water situation in Palestine: the drought is hitting hard). Global warming will lead to a massive migration of people – they will have to to survive.
It seems to me that the same people who justify extreme measures for the sake of our safety (universal eaves-dropping, loss of freedoms, ..), when it comes to global warming ignore the risks and argue ‘we will be ok’.
When I publish a paper, I have to list any financial conflicts which I may have, i.e. funding from groups with a vested interest (has never happened, but ok). Politicians do not have to do that, in fact can go to extremes to hide it.
People here have asked for open data. That is in fact the norm. But it looks like these data re bing removed from the web sites. It is early days and things may turn out to be ok, but initial signs are not good.
We are already not too far off parts of the hottest places on earth – the Middle East, India, parts of Australia – having periods of weather that makes normal human activity impossible. On a regular basis.
There is a temperature/humidity limit above which the human body cannot keep its temperature below 38C. Evaporation stops being an efficient cooling, and you die after 6 hours or so. No place on earth currently reaches those conditions, but some places in the Middle east will do so if the temperature rises by 7C. The worst heat wave on record was there, in July 2016, in Kuwait and Basra.Those places will become death traps under the range of temperature predictions. It is an example of why it is important to limit the amount of global warming.
But some deny the evidence and can cool by imagination.
Albert what is that temperature? 50 or 55°C in the shade?
I remember once having experienced 48°C and had exactly that evaporation experienced. Water evaporated so quickly in my body that its cooling effect was null. The heat was opressive.
I also state that it´s not just that. Farming stops being possible at temperatures higher than 35°C for longer periods of time, hence turning land into a desert. It´s also not that pleasant for humans, and water evaporates so fast that it become scarse.
These conditions push humans away, hence creating massive migration. First it will affect the Middle East and Africa, eventually countries like Australia, China, India, Turkey, Mexico, and South Europe, will be affected too. On the other side, in the north, sea level rise will push away the populations of countries like Netherlands, parts of the high populated areas of UK, Germany and US. What happens then?
We are basically commiting civilizational suicide, if we keep this way. And having a denialist political situation as we currently have is pressing fast forward towards a disaster.
Irpsit, it is defined as a ‘wet bulb temperature’: put a wet cloth around a thermometer, and because of evaporation it will cool the air. But there is a limit because the air can only hold a certain amount of water vapour: if the relative humidity is 100% (i.e. mist forms) you don’t get evaporation and thus no cooling. The limit of survivability of the ‘wet bulb temperature’ is 35 C: you can live in this for a few hours but not for an extended period. At the moment, that is reached nowhere for long periods.
A calculator is at https://www.easycalculation.com/weather/dewpoint-wetbulb-calculator.php I haven’t checked whether it is correct! But it shows that for an outside temperature of 50C, humidity needs to be less than 40% for our survival. At 40C, the limit is 80% humidity. There are also conversion charts available.
Note that the wet-bulb temperature is not the same as the dew temperature.
One region to look out for might be the Afar region (where Erta Ale is) -that can already get pretty close to the limit, although fortunately its sparsely inhabited
Regarding your question on extent of sea ice a few hundred years ago, we know more about that because of Iceland: its records are quite extensive. Nowadays sea ice is far to the north of Iceland. But a few hundred years ago the ice cap regularly reached Iceland. In 1695 it was completely surrounded by pack ice. There is also evidence from Baffin Island showing that a few hundred year, its glaciers extended into the low lands, much below where they are now. The real question is where the ice was a millennium ago, before the climatic down turn. At that time oats were grown in Iceland. By 1200 that was replaced by barley (which can manage at lower temperatures) and later that failed too. When the Vikings first came, they settled on the north coast and that suggests there wasn’t sea ice there at that time. Was it comparable to current conditions?
Data since 1850 is described here: https://www.carbonbrief.org/guest-post-piecing-together-arctic-sea-ice-history-1850 Further back, a nice paper is http://research.bpcrc.osu.edu/geo/publications/polyak_etal_seaice_QSR_10.pdf who show that ice cover increase a lot 8000-5000 year ago, and was less before that. That is due to cycles in the Earth’s orbit.
Albert, I know about glacial history in Iceland. What I can say is that ice caps in Iceland show dramatic variation in just a few centuries. It´s very interesting to know:
– Glaciers in the Medieval warm period were further back than currently. By some kms.
– But at the current melting rate (which is very fast – kms/per year), present day glaciers will reach MWP levels in just a few years, and then become considerably smaller.
– At this moment, even ice caps like Langjokull (the second largest in Iceland) is already showing signs of collapse. Somewhat similar to what is happening in Greeland.
– Between 2100-2200, it is predicted that all ice caps in Iceland will be gone.
– Vatnajokull ice cap (the largest) was probably mostly absent during early-mid Holocene (6000 BC). Iceland might have been nearly ice-free in mid Holocene. This correlated with massive eruptions and lava floods in Iceland.
– After 3000 BC, the ice caps formed again (it must have quite cold so trigger such massive build-up). Glaciers increased dramatically in recent thousand years and reached highest extension, since the ice age, during the little ice age. With many outlet glaciers in Vatnajokull reaching the sea (many kms longer than nowadays).
– Oats and barley were cultivated during the MWP. Then, grains were not grown during the little ice age, until as recently as the 1980s! Nowadays, even wheat is grown in Iceland.
– There is controversial evidence that even apple trees might have been grown back in the MWP (anthropological evidence not confirmed). Nowadays growing apples is extremely difficult in Iceland.
– Glaciers reduced after 1930, but then advanced again in 1960, and only retreated again by 1995.
https://www2.uef.fi/documents/1347235/1368104/NEED+V_New+Geo+Review.pdf
This shows that climate was much warmer in mid Holocene and then cooled the most since the ice age during the past 3000 years.
Summers might have been warmer during the MWP than nowadays.
The climate warmed in 1930-1960, cooled in 1960-1980, and warmed since the eighties.
Iceland climate shouldn´t be correlated with global climate but it refers solely to North Atlantic climate.
I ask an even more politically incorrect question. Has the land of the free following the footsteps of Germany back in 1933?
The narrative is different, but some aspects are eerily similar and comparable.
History tends to rhyme.
Meanwhile, in a bathtub somewhere in the south…
https://www.washingtonpost.com/news/capital-weather-gang/wp/2017/01/24/a-woman-flew-through-a-tornado-in-a-bathtub-and-survived/?utm_term=.e3e5dad9e8fd
There does seem to be a “Changing of The Guard, end of an era” feel to politics at the moment.
Populism does look to taking over from liberalism at the moment, what with Trump and Brexit.
The next test is The Netherlands in March. Fingers crossed that the Dutch electorate sticks with common sense, but the polls are neck and neck at the moment so it doesn’t look good, especially when you consider that both Trump and Brexit were behind in polls when the electorate struck
As an aside, I wonder if Trump could be considered a political Black Swan?
More like a Dragon King. Back in the spring and summer any idiot could tell that the electorate was not in the mood for a status-quo candidate, and therefore Hillary could not win. What was harder to predict was that her cheating in the primaries would succeed.
Once Sanders was out, Trump was inevitable.
It is not only the EPA that has gotten a non-disclosure slapped on them.
Same goes goes for the US National Park Service and the USGS.
About climate change.
My uncle is one of the head honchos at the IPCC. He is the dude that came up with the Tools to back-track temperatures in peat bogs. After that he become the head of the Centre for Climate Change Studies at the Umeå University.
Back Before the first IPCC report was written he asked me to calculate the exact curve of heat increase in air as you introduce an ever increasing amount of CO2. Not only did I do that, I also proved it in a controled experiment.
So here is the truth of it. As you get more CO2 in the atmosphere you will get an increase in temperature. And that is governed by the laws of physics, it is not open for debate.
Now, some people are bending their arses up their own wazoos trying to deny this, but the denying does not change the fact.
Others bend their wazoos up their nostrils to try to come up with non-man-related ways for CO2 increase in the atmosphere. Well, so far nobody has found any evidence of anything like that. Instead all the evidence is pointing towards man as the cause.
I understand that it is easier to hide your heads in the sand and deny the reality, but it is a strategy that will kill you as the Lion of CO2 comes to gnaw on your wazoo.
Another thing, the mathematical and experimental curve is far more radical than the very modest and watered out origianl IPCC curve. IPCC has so far had to revise it 3 times upwards. But it is still a far cry from what is experimentaly proven.
https://m.youtube.com/watch?v=OfNvyN9shs8
Its so cool…Until a rock hits you.
And not even wearing safety helmets, bandanas are no substitute
Thanks Carl for being so blunt, because there are many people refusing to acknowledge the facts. We seem to live in a time where people distrust well-established and plain-to-see facts and come up with their own alternative facts, in order to suit their belief systems, feelings or agendas. This is insanity at its highest.
The censorship of science data that is currently starting in the US has one word only: dictatorship. “If you don´t share my view, then I delete you” “Does not matter you are NASA, environmental institutes or national parks” That is the sort of dictatorship behaviors that we would see in other dictatorships. The US is becoming like the very same thing it tried to fight against for decades. In a democratic country, the government must allow scientific institutes to have their own data regarding climate change. To censor it, it´s dictatorship. It´s also a war on science.
Let’s see how it pans out. Initial signs are worrying but things may still settle down again. The things to look for: hiding or actual deletion of climate data; censorship; the funding for NASA’s Earth-monitoring program.
We don’t need any more proof, what we need is viable solutions
The only way i can get my head around ACC denial is that you would have to have a vested interest in the status quo.
I am not absolutely sold on ACC as it is an experiment that is yet to reach its conclusion but the science underlying ACC seems sound to me.
I therefore apply a simple thought experiment to the situation – I am in a sealed room. In the middle of the room is a large wooden box and i can make out the faint words “ACME TNT” on it. Coming out of the box is an old style string fuse and it is burning towards the box. The wooden box is sealed and nailed to the floor and i have no means of quickly confirming what is in it. What action do i take?
Pull the fuse.
Two questions for you and your Uncle, Carl:
Why have none of the models predicted the pause (pushing 19 years) in global temperature rise?
Why have ALL the satellite measurements come in lower than ALL of the models?
Bonus question: could it be that the models are wrong (that goes for you also, Albert and yeah, I can go toe to toe with both of you with the math)?
CO2 is a lagging indicator, trailing temperature rise by about 800 years due to thermal inertia in the oceans. Warmer water temps tend to drive CO2 out of solution and back into the atmosphere. As we moved out of the Little Ice Age around 200 years ago (post-Tambora), it makes perfect sense that CO2 levels continue to increase.
Final fun fact, if you plot the impact of CO2 levels against greenhouse impact, the curve is a reverse exponential, meaning that you get the majority of the impact with the first 20 – 30 ppm in the atmosphere. As the curve tails out, the difference between 200 – 300 ppm and 300 – 500 ppm is very, very small as the curve is asymptotic toward the horizontal.
CO2 is plant food, and as such the solution rather than the problem. It is the reason that plant coverage globally and along with it the ability to farm has increased some 11% over the last couple decades. In other times, that woudl be thought to be a Good Thing, that is unless you want those in parts of the world that are living closest to the edge to starve just so you can feel good about yourself. Cheers –
Cheers! To answer your questions
-The ‘pause’ in temperature rise from 2000 to 2013 has a few aspects. Even during this time, temperatures were still increasing, just at a bit lower rate than before. The most recent data suggest the pause never existed. It was caused by a change in the distribution of sea temperature measurements. Correcting for this, it disappeared. However, another paper claims it did exist and finds a corresponding increase in heating in the deeper sea. However you look at it, if you include the last three years, the average heating rate has been consistently constant from 1980 to now. If there was an increase in ocean heat intake, that has now been released back into the atmosphere. The last three years have been the three warmest ever, and by a large margin.
-I am not sure which satellite measurements you refer to. Uncertainties in average temperatures (differences between different date sets) are about 0.1C. The warming is 1C, so the uncertainty is much less than the increase. That is the big change since the mid-1990’s: at the time it could still be argued that there was uncertainty in the data. That has gone away; all measurements now agree to within this 0.1C level.
-The plot below shows the correlation between temperatures over the past million year and the CO2 level. It is a very strong relation. CO2 levels are now far above the range we had during this million year. Go back to a time CO2 levels were comparable to what it is now, and temperatures were a fair bit higher. It all fits. There is a bit of a delay in the system: same as when you turn on the heating, the house takes awhile to get warm. We are in that phase at the moment. Even if we stop Co2 at current levels, global warming still has some way to go before reaching stability.
-The point about CO2 driven by ocean temperatures makes no sense. The CO2 level has changed by much more than we have ever seen during the past million year. If the big ice age didn’t have your effect, why should the little ice age?
-CO2 benefits plant growth. And if you want some thousands of years, a new equilibrium may happen, although at considerably higher CO2 level. A lot of biological activity happens in the ocean: most of our oxygen is produced by algae. And you argue that CO2 in the oceans will go down.
-Your claimed curve of CO2 versus warming is wrong. I have calculated these models myself and the relation is linear up to very high levels. Remember the PT extinction, where CO2 drive the temperatures to 40C in the seas. Your curve fits neither the models nor the data.
The bottom line is that the situation is not new. We have had such high CO2 levels in the past, and they have corresponded to higher temperatures. It is not rocket science!
Science lives by making predictions and testing the models against the accuracy of the predictions. The global warming models have passed that test very well: the warming rate is as predicted,and the arming patterns across the world match the predictions. What more do you need? Which other model do you propose? How does it compare against all the data?
It amazes me that some politicians go to extreme lengths to keep us ‘safe’ form perceived danger. But when it comes to climate, the same people take the approach ‘we will be ok’. The sad thing is tat this is a solvable problem. We have 50 years, and need to reduce CO2 production by 2% per year. That is doable! The only reason that the science is being attacked is the reluctance to deal with the problem. Shoot the messenger and the problem will go away.
Howdy Albert –
Question was directed to Carl. Don’t mind chatting with you on the topic. Long time no see. Expect we won’t agree. Will chop this into multiple responses so as not to freak out Akismet with multiple links.
Satellite Data: Best sources for satellite data I’ve come across is Dr. Roy Spencer. McKittrick did the analysis of the pause. Best I can tell, it exists, though was finished with temp rises due to the last couple La Ninas. Cheers –
http://www.drroyspencer.com/
https://wattsupwiththat.com/2014/09/01/new-paper-on-the-pause-says-it-is-19-years-at-surface-and-16-26-years-at-the-lower-troposphere/
Howdy Albert – comment #2 –
Familiar with the CO2 / temp graphs for the last couple million years. If you look close enough, CO2 is a trailing indicator by around 800 years. Of course there is a raging argument about that – as it should be.
To me, the two important questions from the graphs are first why the relatively recent series of ice ages started (only 2 million years) and why do CO2 levels get so low (close to the levels where photosynthesis is not possible at 120 – 150 ppm).
Have come across one guy who applies the Svensmark proposal that cosmic ray influx from close supernovae jacks up cloud cover and in turn cools things down. Similar mechanism has been proposed to tie global temps to solar cycles. He figures once the solar system clears the current arm, global temps will increase back to the geologic normal levels and along with them the CO2 levels near 800 ppm.
The other long question is why the global cool down starting in the Eocene that has continued for the last 35 Ma? Some have pointed to the ocean circulation around Antarctica. Some have pointed to the rise of Asia behind the India – Asia collision disrupting global air flow. To date, I’ve seen nothing other than arm waving. We know something happened geologically. Question is what? Cheers –
Howdy Albert – Comment #3
Here’s a link to an example of the CO2 absorption curve I was talking about. Not being a rocket scientist (only an aero engineer who has done some aviation, aerospace and space), the math makes a reasonable amount of sense. The link below is not the only place I’ve seen the curve, but a reasonable example. Your mileage may vary. Cheers –
http://www.randombio.com/co2.html
Howdy Albert – Comment #4 –
If you accept that normal CO2 levels are closer to 800 ppm (mentioned by another post in this thread btw), we are not anywhere close to a crisis and will not be for a very long time.
Science also is based on theory (models) reflecting what is in the data. The instant that the rise in CO2 atmospheric levels decoupled from global temperature rise (the pause) was the instant ALL the models were wrong.
One of the things I do in my current day job is analyze code. I’m not good enough to make it dance and sing, but good enough to make things work from time to time. I’ve read the Harry Read Me code from the CRU at East Anglia. I know what they are doing – modifying code to produce a desired model result. You might want to read it too.
This isn’t science. It is politics or religion. Either way, the response to it is going to be political or religions in nature, which is fine with me as long as we all know which game we are playing.
Final note, if CO2 was really the issue and its mitigation was the answer, why is the push for what is essentially unicorn flatulence (solar and wind) rather than nuclear (thorium / pebble bed / fast breeders) which would provide vast quantities of cheap, high quality energy? Even CTLs (Fischer – Tropsch) with CO2 capture will work.
Renewables (CO2 emissions reduction) kill the elderly and poor because they make everything more expensive and unreliable. Eventually people have to decide between eating and staying warm (dead pensioners in GB). But they do make the well connected very, very rich.
All for now. Told you we weren’t going to agree, Best to you and yours. Cheers –
It will take me awhile to answer all the questions. (have to do my real-life job as well! Which in my case is research, and in a field not far from climate study.) But let me have go at your comment(s) 4 first.
-The ‘normal’ CO2 level has been different in the past. And it has been as high as 800-1000. It is not a question whether we can live in such a world. The question is in the transition. At this kind of levels, you are talking about 4-5 C (10F) higher than now. Look at the world of the past with this kind of CO2. There were no ice caps and sea level was much higher than now (between 5 and 20 meter higher). All cities build lower will need to relocate. The frozen north benefits and can support more people, but it has little surface area compared to the areas in trouble. The deep south (sub-equatorial) becomes uninhabitable: another billion people on the move. Current food growing areas become unsuitable: we need to develop new areas for agriculture and change crops. Fine, but we are at the hairy edge where food production can just about keep up with population growth. We will need to organise this very well, and avoid crop disasters during the process. Water will move: some areas become too dry for current population (that has already happened in part of the Middle East). I am happy to accept we can live in a warmer world. But we need time to adjust. If we limit warming to 2C, we can do it. More, and we are taking extreme risks. That is the point of the discussion: if we take the issue seriously, we can solve it. If we don’t, it will overwhelm us.
The ‘pause’ was in the distribution of warmth. The physics tells you that we take in more heat than we lose, at about 2W/m^2 if my memory is right. Where does it go? Mostly in the sea, as the heat capacity of water is much higher than that of air. The seas warm up the air. If the pause existed, it was because the seas kept the heat a bit better than expected. The heat is still there! An El Nino puts more energy from the sea into the air. And indeed, the past El Nino have a record warmth, showing how much heat had collected in the ocean. The heating rate is very close to that predicted and has been since 1980.
(If you wonder about the ‘pause’: NASA showed in 2015 that it was caused by an measurement bias: correcting for this, it went away. That gave some angry responses from people who liked the pause. But it has now been confirmed by a second team: (see https://www.scientificamerican.com/article/no-pause-in-ocean-warming/).
Regarding nuclear, I fully agree! It is a viable option and in fact it is hard to see how we can manage a fast move away from oil without using nuclear. The renewables are very important but we are not at a point where they can be made self-sufficient. That is why I argue for 2% reduction per year. That is doable within our current development plan, if everyone stays on board. But for nuclear, be aware that uranium is also a limited fuel and if everyone goes nuclear, there will be a supply problem down the line.
The cost of renewables is under discussion. In some areas it is close to fossil fuels, in others it is more expensive. New generation nuclear is also expensive, probably even more so than renewables (based on UK numbers). Fossil fuels are subsidised because the environmental cost is not included: not so much for a traditional oil field but a big issue for tight oil and shale oil. And the oil price has been very unstable in the past decade. We were living at the edge of a supply crisis, until the Bakken oil field took the pressure off. It could happen again. Two US states are in the process of taxing solar energy: I think that shows that the cost per kWh of solar is becoming similar to that of traditional fuel. I don’t ‘buy’ the argument that the poor pay for renewables. If it is well managed, energy costs won’t change for normal users.
And even if the cost per kWh goes up, the cost of living may not. Last month I rented a car in California. Over a week, long distance driving, it managed 22 mpg. That is ridiculous. A modern design does 35-40mpg. This was an international car make, and a similar model outside of the US, same size and performance, does not do 22mpg. Why put an outdated engine in a car just because it is for the US market? Why does a US fridge use twice the energy of a similar fridge elsewhere in the world? Energy is a solvable problem!
Howdy Albert –
Thanks for the cogent response.
Respectfully disagree that CO2 is the cause. Remain convinced it is the lagging indicator.
Don’t think there is a thing we can do to limit CO2 level increase. Further, don’t think we ought to try, as it promotes greenery and in turn easier life for our and other species. Compare CO2 with H2O and CH4 greenhouse gas contributions.
One of the nice things about a Thorium burner is that is burns what is today waste fuels.
Given the NASA / GISS / NOAA homogenization of data over the last couple decades, sadly I am not confident they are doing the right things with it and as such give them little to no wiggle room.
My new truck is about 17 mpg. Don’t think it is anyone’s business what sort of MPG I get, as the solution ought to be the cheapest, most plentiful fuel source possible.
If you get up in this part of the world, I have an extra fly rod and spare BR. Cheers –
One the one hand you say that there is nothing we can do, on the other hand that it is your choice what mpg you want… Freedom of choice and responsibility go together. That has always been the hallmark of America: people taking their future into their own hands, accepting that they themselves are responsible for their actions and future, not the government.
I still have two of your comments to respond to. But the bottom line: if you make your duvet thicker, you get warmer. We have made the insulating layer of the atmosphere thicker by 100 meter. So we are warming up. It is not rocket science. It is perhaps a bit surprising to hear an aerodynamic engineer who doesn’t accept physics.. We can argue about the amount of global warming (happy to do so)|, but not whether CO2 is a warming agent. That is simple physics.
I like the fact that you come with specific points/arguments. That helps in discussions.
CO2, pollution, drought, global warming are all linked to the destruction of forests, especially along shorelines where they could capture the moist air from the sea, and raise it to fall on the hills inland. Temperatures in the Southern Hemisphere are more extreme, with colder winters and hotter summers, and the imminent destruction of the Amazon rainforest for palm oil, hydroelectricity, and logging. If the Amazon and Orinoco slow, then I am betting that the Gulf Stream will also slow and ocean anoxia will increase. Science is being muzzled for the profits of the few at the expense of the many and our extinction progresses apace. There is no political will to rein in the destruction
M4.2 on Katla now… WOW!
Thursday
26.01.2017 15:14:39 63.636 -19.166 0.1 km 4.2 99.0 4.2 km E of Goðabunga
http://en.vedur.is/earthquakes-and-volcanism/earthquakes/myrdalsjokull/
Mostly very shallow swarm but some quakes somewhat deeper. Some action in the chamber?
Note that all quakes in the swarm are now listed as shallow after manual review of locations.
Yes, none of them under the lid now
Thursday
26.01.2017 15:16:23 63.641 -19.151 0.0 km 2.9 99.0 4.9 km E of Goðabunga
Thursday
26.01.2017 15:15:18 63.633 -19.189 0.0 km 3.0 99.0 3.1 km ESE of Goðabunga
Katla did not like to sit without a star as long as Barda has one. Thats the reason and cause!
If I didn’t know better, this almost looks like magma is coming from the Godabunga cryptodome region.
Another interesting thing that this could be interpreted as, is earthquakes following the pattern from an eruption that formed as a horizontal dike across the caldera in a very similar fashion.
By the way, I don’t think this isn’t a dike intrusion from Godabunga, it just looks like one. If that were the case, it would have probably been even noisier, would cause notable GPS changes, and would occur in a more gradual fashion from west to east over time.
You can see that most of these earthquakes happened almost contemporaneously. A dike would start out in one location, and then move down a path showing a clear progression in time as the dike progresses.
Hi Ian F, while ago you made a nice earthquake seqmap of the Katlaregion with the quakes in various depth running through the years. It is very indicative my opinion. Any chance you could make an update of that one?
https://vatna.carto.com/viz/745e930a-0baf-42f2-8c94-322bab8e0af9/public_map
Here is an up to date map including today from June 2016
https://vatna.carto.com/builder/3e822603-955b-4f0e-a96f-61c3e30ead9b/embed
I will try to duplicate the one you are referring to, they changed the software and I need to check if it can be done
Thanks sofar IanF.
From 2014 till juli 2016, there is a relation visible I think. After some deeper quakes at the east rim of the caldera, there is shallow activity in a much larger area in the katla caldera. The pattern does show more than once. I am curious if that same pattern is visible from juli 16 till now.
The years before that relation is far more vague. At some periods the shallow quakes are most of all seen along the calderas rim. I guess heat leaks and/or water seeps along the rim more easily at times.
Zooming out, have you seen if there are correltion between activity around Reykjanes peninsula/ridge together with Tjornes fracture zone followed by activity inland, for example Barda and Katla?
Should also be deeper
Woops, I meant to say I don’t think this is a dike intrusion.
NOT I don’t think this isn’t. Wish I could edit past comments…
Magma is not comin from Godabunga. 🙂 There would be more quakes and tremors to go with that. 🙂
The quake pattern tho in the caldera is not random, but is at the exact spot of the VEI5 1755 eruption, and the quake line seems to go inline with the suggested fissure on the caldera lid.
Looks like the fissure might be cracking again, for whatever reason, be it magma pressure, or hydrothermal explosions of water in the fissure cracks. Either way, it looks like the caldera could unzip itself this way in the near geological feature.
We are tho getting used to seeing stars at Katla, but there are 2 things that makes it diffrrent than watching stars at Bardy.
1. Katla is in its pre-eruptive or slow build up phase unlike Bardy, so any activity is interesting.
2. Any M4+ is stunning, especially in a pre eruptive phase of a volcano that is not really used to now a third M4+ in 6 months.
It actually seems more like it’s following the proposed water divide, which could make sense given phreatic activity.
A bit strong for a hydrothermal event but that seems most likely. How certain is the depth? At Bardy, a lot of the 0.1-km quakes became much deeper when more instrumentation was placed.
No signs of magma moving on the tremorplots
I once read a rather frightful account of scientists exploring a crater itself when a eruption suddenly started.I think it was the volcano Galeras. So you wont see me near any Crater.
Still. I wonder if there is a list somewhere of tourist friendly volcanoes.
http://big-volcanic.com/volcano-videos/
There is a documentary that discusses this event (second one down, called “volcano hell”). It’s a really good one, and is great for learning about tremor and how the scientists discovered relationships between certain seismic signals and eruptions.
Katla GPS.
The lowermost GPS plot is very intriguing. Notice that during the winter (halfway markers between each year entry) there is nearly always a trend of the GPS going down. In 2016, that clearly started, but it stopped half way through and reversed the trend, instead going upward.
If you look to the 2012-2013 year, you can see what is likely a similar event going on, which was around the time that the supposedly small phreatic event occurred back then. It will be interesting to keep an update on these plots going forward.
Is this GPS on the ice cap? Could it be thermal expansion of the ice during summer and contraction during winter?
Aust is placed at rock, according to map:
http://gps.vedur.is/mapGPS.php
Aust is on rock, pics here http://strokkur.raunvis.hi.is/~sigrun/AUST.html
Probably ice loading. The surrounding ice and snow are much thicker in winter and push the rock down. Especially if the rock is hot am malleable.
Just to nitpick a little, I believe the “Seconds from Death” photo is actually part of a film clip put up by a person that survived. You can see the clip in this BBC report: https://www.youtube.com/watch?v=aQtkoLxqUNQ
Is it? Think there’s 2 different sources being used here. The building, which you can only briefly see in the BBC clip looks slightly different to the one in the picture. The picture looks like the footage of the man whose family allowed it to be shared following his death.
But I think the picture of people running down the hill is the same as from the BBC.
Doesn’t really matter I guess, one a lucky escape and the other a tragic loss. Either way, just goes to show how dangerous Volcanoes can be.
China will in the future use drones to find survivors after earthquakes, sounds/looks promising. https://www.wired.com/2017/01/chinas-launching-drones-fight-back-earthquakes/
* They’ve already used them back in 2008
New statement from Iceland’s civil protection agency (note statement posted in Icelandic, this is an unofficial translation):
“Earthquake activity in Katla has been unusually high since August 2016, with three earthquakes larger than magnitude 4.0 and many more earthquakes with magnitude above 3.0. Earthquake activity is shallow and spread around the caldera. No harmonic tremor has been detected following this earthquake activity. Following this increase in activity a small increase in geothermal heat has been observed. GPS stations show that small inflation has been taking place since 2010 in the top of the crust. When activity increases in Katla, as has been the case now, the risk of eruption grows and that has to be considered by the emergency response teams.
Since September 2015 Bárðarbunga has been inflating slowly under the caldera. It might be many years until the next eruption/magma pressure is at the same levels before the 2014 eruption started. It is impossible to exclude new eruptions in the next few years. Limited measurements are taken on geothermal activity in Bárðarbunga, to the best of our knowledge little has changed in last few months. It is important to monitor geothermal activity due to risk of water collection in the caldera.”
Nothing major that we dont know already, but it is nonetheless very important information and also confirms a slow onset of a more serious pre-eruptive phase at Katla.
The GPS part is interesting. We are all waiting for some major uplift and deformation, like at Grimsvotn, while in reality Katla might already be inflated to a specific point since it is almost 100 years since the last eruption, and Katla could be, or probably was, slowly inflating all this time, so in my humble opinion not much more is needed to reach a critical point. All there is missing is volcanic tremor as THE sign that something bigger might be in the works.
And the inflation since 2010 that IMO mentioned is nicely visible, tho it is confined to upper crust since it is visible on the nearest stations. It would make sense since the upper chamber is very shallow.
Btw, a question: has anyone ever considered that Katla might have an open feeder system? Or at least partially open? Are there any studies made on this topic?
I’ll try to find the links but not so long ago Jon Frimann mentioned a couple of papers that infer the reason that most of the seismicity at Katla has been shallow is that it’s hot enough down there to be somewhat ductile up to a pretty shallow depth. That would tend to tie in to possible open feeder and the shallow chamber.
I have to say that while there are some more concentrated non-random areas as you pointed out the ‘footprint’ of the current overall general seismicity is worryingly large; it encompasses the entire caldera; 10km in diameter.
Nice, so basically confirming most of what I had thought. Makes me feel happy to be able to look at the data and come to similar conclusions as professionals.
Stations AUST and ENTC are the ones to look out for on the CGPS list. They are the closest stations snd have been recording the gradual uplift.
ENTC is currently not updating, but AUST is. They are both situated on the bedrock, so they are recording ground movement and not glacier activity.
Any thoughts on what’s going on at Fed. Not sure if it’s from elsewhere but doesn’t show up as clearly on other nearby drums.
Always helps to share…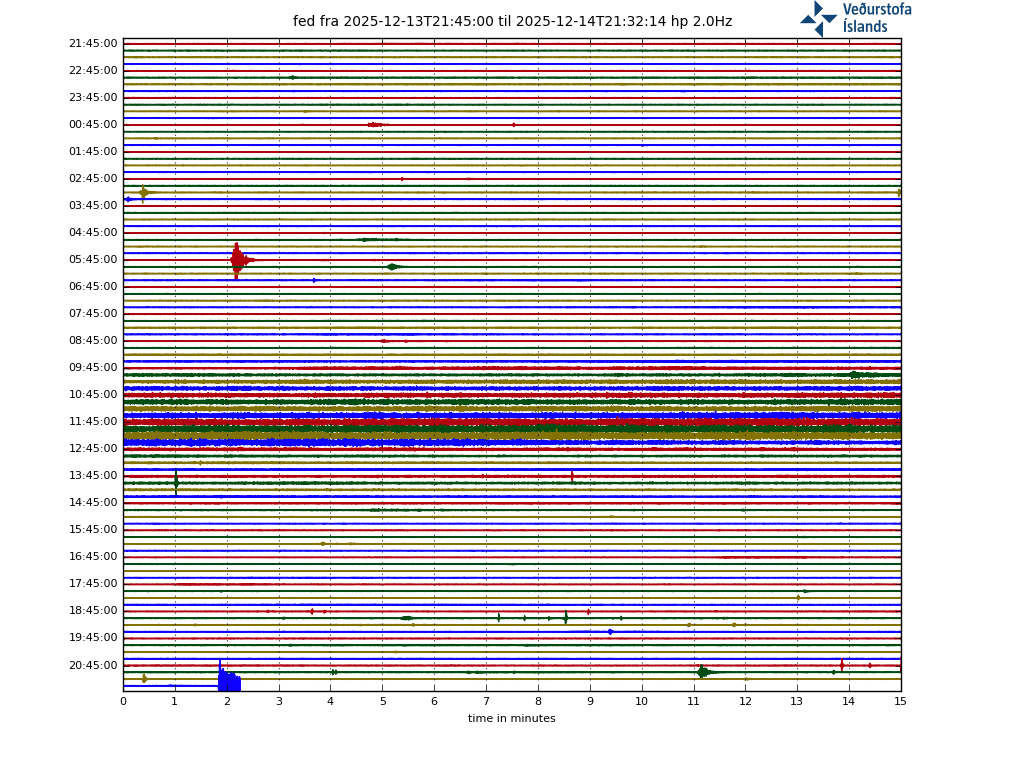
Courtesy IMO
Probably from these quakes
http://en.vedur.is/earthquakes-and-volcanism/earthquakes/atlantic/
Actually, the timing is off so must be from some other source.
Quite a series of rifting quakes north of Iceland though
Indeed! It has certainly been busy in Iceland of late.
I’m beginning to think it’s instrumental failure at FED, similar to what we saw at GOD the other week.
I made an overlay of the gravity anomaly and the plots I made the other day. It is a simple attempt at overlaying, so it might not be 100% accurate an overlay, but its quite good to give the idea.
The anomalies used are actually Isostatic gravity anomalies.
Some explanation from USGS: “Isostatic residual gravity anomaly is produced by subtracting long-wavelength anomalies produced by masses deep within the crust or mantle from the Bouguer anomalies. The long-wavelength anomalies are assumed to result from isostatic compensation of topographic loads. Isostatic residual gravity anomaly maps therefore reveal more clearly than Bouguer gravity anomaly maps the density distributions within the upper crust that are of interest in many geologic and tectonic studies.”
Which roughly translates to being more useful with volcanoes than normal anomalies. Now positive anomalies, as given an example in a study could mean many things, but to point to a practical example from a study:
“The isostatic gravity anomaly map of the Dunedin Volcanic Complex shows a
circular positive anomaly centred near Portobello, the focus of the initial eruptive
activity. The cause of this anomaly is identified with the intrusive rocks of the feeding
system of the Miocene volcano. A vertical cylindrical model of the feeding system,
fitted to the observed anomalies by the method of least squares, suggests that an underlying volume of crust of diameter 13 km and depth 10 km has been invaded and
partly replaced by dense intrusives, giving it a positive density contrast of 0’08 Mg/m3.
The volume of intrusives deduced from this model, about 600 km3, is at least five
times greater than that of the erupted rocks. ”
Now this not fresh intrusion but a solidified one. Nonetheless, the more intrusives did give a positive anomaly.
Now looking at my images above, we can see that from the active volcanoes, only Grimsvotn complex and Katla stand out as having positive isostatic anomalies, compared to negative anomalies found in other volcanoes.
it is a good question why. I did ask that it might be because of an open feeder system of Grimsvotn. And I did ask that if Katla might have a similar case aswell.
Positive anomalies mean more density, and it could be related to magma composition when it comes to volcanoes.
“The most important factor controlling magma density is composition. In particular iron, which is relatively abundant in basalts, has a higher mass-to-radius ratio than elements like potassium and silicon, which are enriched in evolved magmas. The density of most magmas ranges from 2.2 to 3.1 g/cm3, with basalts being densest and rhyolites being least dense.”
This quote could explain why all the volcanoes have negative anomalies, probably due to the rhyolite magma chambers.
Now Grimsvotn and Katla are exceptions, even tho we know they have existing (Rhyolite) magma chamber (not sure right now about Grimsvotn, I am sure someone can fill info on that).
Point is open for discussion, but it does seem that either there are more basaltic intrusives under Katla than under other volcanoes, or it might have an open feeder system which would probably also cause positive anomalies.
Would like to hear other opinions, since gravimetry is not really my field.
My opinion? Really nice plots!
As for Katla, well, her namesake was a notoriously difficult person to get along with, so I think the volcano is trying to live up to the reputation.
As for the plots, the only change I would recommend is adding the color scale so that it can carry some meaning rather than making one have to find the ” rel=”nofollow”>original plot to find out what a particular color means.
I think Katla is in the pre-run towards an eruption. The IM said it, and I have been saying since some months. There has been deeper quakes in Katla, but not the amount I would expect to see before an eruption (I would expect more deep quake swarms before an eruption).
I think you might be right! Katla could in fact have a somewhat open conduit like Grimsvotn and Hekla and receive a steady influx of magma to keep it that way, just like Grimsvotn. The difference is that magmatic influx rate at Grimsvotn is severely higher than at Katla, so it needs to erupt more frequently, because it reaches the threshold and the limit of pressure quickly. Katla can go on for a much more period, as it has also a large chamber, so this makes it go for a long time between eruptions, which are then very large. Something between 30 to 100 years, but on average 50 years, between eruptions usually VEI4-5, but there might be tiny smaller subglacial eruptions ocasionally.
This might explain why we see inflation going on for a slow rate since many years.
I think the shallow magma chamber is pretty full (and this explains all the hydrotermal events, shallow swarms and subglacial eruptions of 1999 and 2011). However the limit has not been reached so I think this will happen when a sudden large influx of deep magma arrives at Katla.
As we have seen a hotspot pulse in recent years, I think it is just a matter of a few years, a decade or two at most, until Katla really erupts. It would be very unlikely for Katla to go through this hotspot maxima without getting over its chamber limit (this is erupting).
Anyways, in 2018 it is 100 years since Katla has last erupted. I am sure Katla will not disappoint us and erupt either later this year or in 2018, before reaching the 100th aniversary.
Let´s also remember that Grimsvotn will likely erupt in 2017-2020, at current rate.
I think it would be quite funny if it erupted exactly on it’s 100th anniversary
And Godabunga movement, is true, denotes a movement towards SW, away from where magma intrusion is happening (in 1755 eruption site). So, this is basically inflation. And the M4 quake was not in Godabunga but in that 1755 site, about 4km east or eastnortheast of Godabunga.
We might not be far away from an eruption…
Keep up the good work folks
First trip to Canada (working unfortunately) and came across this, 40 years ago an early frozen Lake Erie contributed to a blizzard with snow drifts of 9m, higher in some places. Brrrr!
https://www.theweathernetwork.com/news/articles/blizzard-of-1977-meteorological-analysis-canada-niagara/78699/
Happy Chinese New Year everyone 😀
Lake effect. A particularly irritating part about living around the Great Lakes. The only time I lived near them was during Service School after boot camp. The part that I really didn’t like was doing trash pickup detail on the hillside next to Lake Michigan. The wooded slope had these funky trees that had 1 to 2 inch thorns/spike growing out of them. Fast way to tear a jacket, and DON’T fall down the hillside.
It was always barbed wire for me, trying to find a short cut across the field coming home from school.
Looks like there’s plenty of spiky trees out there, check out this bad boy
Thats Tucum I still have one of those spikes lodged in my right leg after a slip down a muddy slope tem years ago.
Just to add, the spiky trees Lurking is referring to were probably hawthorns, had a few punctures during my childhood from them as well. I now use chaps in the field to avoid this type of incident. (as well as snakes).
About how many snakes does it take to shield from the spikes? How do you keep them in place?
(I know, I’m being facetious)
These weren’t that spikey. They were sparce enough to where you wouldn’t really notice them unless you came in to contact or were specifically looking out for them.
Maybe so, but I can guarantee if you are going to be bucked off, there will be one right there.
New attempt at isostatic anomalies, this time with new colours, and added info.
and attempt at Iceland as a whole. Surtsey area is seen and the TFZ area with all the stars lately.
Impressive plotting! Thank you very much!
and Iceland without an overlay
All Icelandic hotspot volcanoes, including past ones (along track Langjokull, Hofsjokull, and Vatnajokull volcanoes) all register as blue anomalies. The Middle Atlantic rift volcanoes do not register that. Then Hekla and Snaefelljokull also register as blue.
Albert and Carl, https://www2.uef.fi/documents/1347235/1368104/NEED+V_New+Geo+Review.pdf shows ice cap evolution in Iceland. Ice caps were nearly gone in Iceland back in 7000 BC; curiously when massive lava floods occurred in Iceland. Then dramatic build-up of ice caps after 3000 BC, reaching highest levels since ice age. MWP climate might have been warmer than now. At current melting rate, ice caps will be gone in Iceland by 2150, with obvious consequences for volcanic activity.
Large quake in Katla, but magnitude still unknown. Could be between M2.5 to M3.5.
Does anyone find it odd, to see an M2.6 at 28km depth, NNE of Hekla?
Saturday
28.01.2017 21:42:22 64.094 -19.588 28.4 km 2.6 99.0 12.0 km NNE of Hekla
I think it’s in an interesting place. I think the SISZ extends a bit further to the east. If you plot all registered quakes since 1995 you get the picture below. Green squares mark quakes registered the last 48h. I marked the location of Hekla and added dashed lines to mark a couple of faults of the SISZ where historic large quakes have occurred. Interestingly, quakes align in a similar way around Hekla, also marked with dashed lines. The western of the two is the fault responsible for the Vatnafjöll quake in 1987 and the eastern saw a lot of activity during the 2000 Hekla eruption.
The deep M2.6 sits very close to the intersection between the eastern fault and the Heklugjá fissure (or its extension, not sure if it runs that long).
This was the site of some explosive eruptions (VEI2-3) in year 1913. An area called Lambafit. Located to the NE of Hekla. At this depth, I believe this quake to be magmatic.
There have earthquakes that deep under Katla before (April 2015 saw a series) but this may be the strongest. This will be magma pressure, perhaps from an increasing melt fraction. Makes you wonder whether decompression melt due to the reducing glacier is contributing. But you can never assign a single quake to a single cause.
Another big quake on Katla…
Quake still not analysed. Seems to have been both poorly located and poorly measured for intensity (at M0.5).
Quake might have been relatively shallow and maybe only around M2.5. I don´t think it was stronger than M3.
Yes it could be, but my gess is at least a M3.
OT : head games; Shakespeare’s Hamlet is well known for containing the phrase “to be, or not to be.” If you look at it from a boolean math perspective, it is true.
2B (or) !2B would always evaluate to be logical one (true) if implemented with logic gates. The output of an or gate is one (true) if any of the inputs are true. 2B and it’s inverse !2B (not 2B) would always provide a logic high (true) condition to the gate inputs.
Reply to agimarc 29/01/2017 at 16:12
Howdy Albert – Comment #3
Here’s a link to an example of the CO2 absorption curve I was talking about. Not being a rocket scientist (only an aero engineer who has done some aviation, aerospace and space), the math makes a reasonable amount of sense. The link below is not the only place I’ve seen the curve, but a reasonable example. Your mileage may vary. Cheers –
http://www.randombio.com/co2.html
Hi Agimarc
I now had time to read that website. It was written in 2003 – temperatures have moved up since (the website claims it was cooling at the time – wishful thinking I’m afraid)! There are two mistakes in the analysis. First, it uses an CO2 opacity at 4 micron. In fact the dominant band is at 15 micron, because the Earth emits most radiation there. The 4-micron band it irrelevant as the Earth is not hot enough to radiate at that wavelength. Increasing CO2 does two things. It absorbs more radiation at the edges of the absorption bands. Second, it increase the height in the troposphere from where radiation can finally escape.This is the most important aspect, as it scales directly with CO2 concentration. It sets the height at which the temperature equals the equilibrium (non-greenhouse) temperature. If you increase this height, the surface gets warmer because the temperature increase by 1C per 100 meter downward. So for every 100meter of increase in this ‘equilibriumn height (about 7 km) you get 1 C surface warming. The second mistake in the website is that it ignores this effect. How effective it is you can see from Venus, where clearly more CO2 did cause much more heating.
The model I ran gives 0.6C warming for a CO2 increase from 288 to 400ppm. The real number is closer to 1C: this is because of a feedback mechanism, where the warmer air contains more water vapour, and water is itself a greenhouse gas. This is actually the most uncertain part of the analysis. The data clearly shows that this amplification is going on (in fact the increasing amounts of rain in the UK tells you the same!) but exactly how much is up for discussion. In my calculation, I ignored this – I used the CO2 increase only.
The second problem with the website is the claim that warmer oceans have outgassed CO2. That is not correct because CO2 reacts in ocean water to form carbonic acid and finally bicarbonate. This greatly increases the amount of CO2 the oceans can take up, and means that the oceans are not ‘full’. It is true that warmer water means less CO2, but more CO2 in the air means more CO2 in the oceans. The net effect is that the oceans currently take in CO2, not expel it. About 30% of our CO2 emissions end up in sea water. That is observationally confirmed: you can measure the decline in pH that this is causing.
The kind of work you wish were right but sadly is not. The data speaks, and the data says that we are warming. Even Exxon has admitted this now.
That is an extremely good point Albert. Currently it is well known that pH of the oceans is decreasing (becoming more acidic). This is mostly controlled by bicarbonate concentration and related not only to biological activity in the oceans but CO2 concentration in the atmosphere.
So if oceans are getting acidic, despite warming, that means that they are taking up a great amount of CO2. In fact we are polluting so much, that perhaps most of the CO2 is ending up in the oceans instead of the atmosphere.
I just watched an incredible video on Youtube, that explains in-depth how it is known that the African Superplume does in fact come from one singular source. It’s a really awesome watch for any volcano nerd, and really goes into depth on processes and research done to figure this out.
In summary a massive superplume is located somewhere under Tanzania and extends all across the rift area, and as it comes upwards it divides into two and creates two plateaus, the Ethiopia dome, and the Kenya dome.
An amazing study
http://www.nature.com/nature/journal/v525/n7567/fig_tab/nature14876_F3.html
African superplume at depth (under 1000km) might also feed the St Helena plume, and perhaps others in that region of the southern hemisphere.
Hawaian and Icelandic plumes well defined, and the Icelandic might have a old and deep connection to the Eiffel plume in Germany.
Here goes part of the abstract
Here we describe the use of a whole-mantle seismic imaging technique—combining accurate wavefield computations with information contained in whole seismic waveforms4—that reveals the presence of broad (not thin), quasi-vertical conduits beneath many prominent hotspots. These conduits extend from the core–mantle boundary to about 1,000 kilometres below Earth’s surface, where some are deflected horizontally, as though entrained into more vigorous upper-mantle circulation.
Now we cannot argue that all Icelandic volcanoes are indeed linked to each other, at some point in the mantle.
Other interesting finds above, Canary islands possibly linked to Cape Verde at depth.
Impressive large plume under Pitcairn, Pacific ocean.
And also under Samoa which also feeds Tahiti and Marquesas
Icelandic plume most likely connected to Jan Mayen.
Please note that these links are all deep in the mantle. Circa 500-1500km deep.
Here part of the article is for free access
http://www.earth-of-fire.com/2015/09/large-plumes-seated-at-the-base-of-earth-s-mantle-are-present-under-the-major-hot-spots.html
Impressive to see what lies under the world hotspots at some 2800km deep. Basically there is a big mass of moving magma under Africa and South Atlantic, and another somewhere under the Pacific, Samoa. The rest are “small” plumes.
http://www.earth-of-fire.com/2015/09/large-plumes-seated-at-the-base-of-earth-s-mantle-are-present-under-the-major-hot-spots.html
These are the two images I wanted to post:
Under 2800km, these is how hotspots are connected. Notice the large pools of moving magma under SW Africa and South Pacific.
The origin of all plumes under the South Pacific (somewhere under Samoa) and also possibly linking Hawaii to it
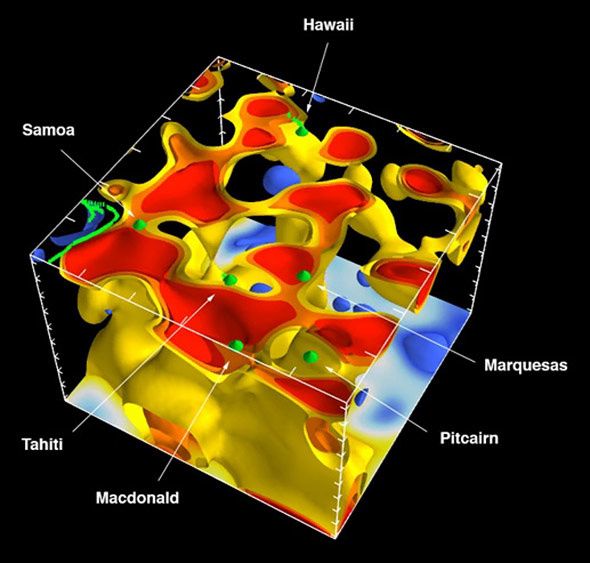
Icelandic authorites are worried about tourists, now that Katla is rumbling, evacuation plans that er on paper take height for 3-400 people being affected, mostly residents of Vík, but now there are more than a thousand people every night during winter (probably more during summer).
http://www.icenews.is/2017/01/29/unrest-in-katla-volcano-prompts-caution-authorities-worry-about-tourists-in-the-area/#axzz4XDXyFCQa
There are two dangers: one is from glacial floods, but that is spacially restricted. However floods can come within an hour to the bridges and places where tourists travel. That is in itself a cause for concern. If you are driving through the sandurs southeast of Katla, it takes about an hour, that leaves a very window of time for authorities to close the road. Besides some tourists will make stops along the sandurs to take pics. The flood will get you before you see the ash cloud.
Second impact of the ash cloud itself. I remember in grimsvotn 2011 tourists were scared to death when they woke up in Skaftafell to a volcanic night that morning that continued thorugh the day. It looked apocalyptic but at least there was little danger of lightning and volcanic bombs compared to what may occur in a Katla eruption if you stand in Vik or the nearby areas, which are highly touristic. In this situation, you only solution is to seek shelter immediately indoors (rhe risk of suffocating is probably less than that of being hit by lightning or lava bombs when you try to run away)
The scenario is serious enough in that, basically a flood will be the first event to occur and destroy the bridges both to east and west of Vik (before you see the ash cloud), leaving the village isolated, and stranding tourists and locals there, with evacuation by heli as the only possibility. And that also has risks during the eruption. I am sure some tourists might defy logic and try to drive away, but that would be suicide.
Finally, in summer many tourists hike the region west of Katla (about 100+ tourists per day). The region, which for me is one of the most awesome beautiful hikes in the planet, is also extremely dangerous place to be, when Katla erupts. You are hit by lava bombs, your hiking path is surrounded by many rivers that will flood, lightning will be an extreme danger. Even with the well-placed warning scenario, which involves fireworks being released in all huts of the area, you are looking for a scenario where you would not want to be. Fog and often summer chilly rainstorms complicate things! Knowing the increased seismicity, I wouldn´t hike the Laugavegur hike now.
Yes, I think a flood would be the most likely danger. There is much more talk now about a ‘coming’ eruption (not imminent though, I think, and could easily be a decade away. Noone really knows.) But chances are it would be a smallish eruption. In historical times, Katla floods have always gone southeast. But before Eldgja, some went west. Something changed in Katla, probably the rift breaching the crater. But a west-ward flood can perhaps not be fully discounted.
Albert why do you think it will be a smallish eruption?
Katla erupts usually quite large, usually VEI4 (which is similar to Eyjafjallajokull 2010) and quite regularly also VEI5 (slighthly larger than Grimsvotn 2011).
VEI3 is the lowest that Katla does (similar to most recent Hekla eruptions), but that is less common than VEI4.
We have nothing to show that this time an eruption will be small. In fact the unusually long repose period would likely make this eruption a large one, in the VEI5 range. And even more when we consider than the earthquakes have been happening along rhe 1755 fissure, which was Katla largest historical eruption.
Flood wise, actually floods will most likely along all routes, but they will be much larger towards the southeast. This is similar to what happened in Eyjafjallajokull 2010. There is one or two flood paths towards the west, one flood path towards the southwest, and the flood path towards the southeast.
Repose period at Katla isn’t as great of a predictor of eruption size as you would imagine. I did a plot in excel a while back, and it turns out that many of the eruptions that cross the 100 year threshold for repose end up being VEI-4 or smaller.
I think the big thing here is to know that Katla has a few somewhat separate areas that probably erupt in different fashions. In the same manner that Grimsvotn has multiple magma chambers, Katla likely is similar.
Irpsit, thank you for giving me the idea for the tomography.
Here is an example I just made from the GYPSUM data, a cross section from across Iceland to Madagascar. There looks to be a slab undergoing Iceland around its SE Region. You can see the African plume.
But the African plume seems to be much more SW/NE oriented, as seen in this cross section.
And the 2800km depth, same as on the chart irpsit posted, shown two distinct areas in south Pacific and SW Africa.
Hi Agimarc
Now my response to comment no. 2 above, left to last because it is the only one in yuor list that is correct. The other points made were (in my professional opinion!)
wrongbased on misunderstandings. But you are correct in questioning on how CO2 could drive the ice ages.agimarc 29/01/2017 at 16:06
Howdy Albert – comment #2 –
Familiar with the CO2 / temp graphs for the last couple million years. If you look close enough, CO2 is a trailing indicator by around 800 years. Of course there is a raging argument about that – as it should be.
To me, the two important questions from the graphs are first why the relatively recent series of ice ages started (only 2 million years) and why do CO2 levels get so low (close to the levels where photosynthesis is not possible at 120 – 150 ppm).
Have come across one guy who applies the Svensmark proposal that cosmic ray influx from close supernovae jacks up cloud cover and in turn cools things down. Similar mechanism has been proposed to tie global temps to solar cycles. He figures once the solar system clears the current arm, global temps will increase back to the geologic normal levels and along with them the CO2 levels near 800 ppm.
The other long question is why the global cool down starting in the Eocene that has continued for the last 35 Ma? Some have pointed to the ocean circulation around Antarctica. Some have pointed to the rise of Asia behind the India – Asia collision disrupting global air flow. To date, I’ve seen nothing other than arm waving. We know something happened geologically. Question is what? Cheers –
The Svenmark proposal is (sorry for using the word) rubbish. We are not in a spiral arm, cosmic ray emission does not scale with arms, and the link between cosmic rays and cloud cover is hotly disputed – that discussion is not yet at an end, but is related to solar influence on earth, which is irrelevant at geological time scales.
The Eocene cooling is an interesting one. Two proposals have been made: (1) evolution of gras was around that time. Gras is very efficient at pulling CO2 out of tthe air; (2) closure of the Tethys which caused the dominant ocean current to change from equatorial to polar. I am not entirely happy with either of them. The third one is the formation of the Himalayas which increases weathering rates dramatically. In the past, CO2 levels have scaled with erosion rates, because rain and rock are quite efficient in removing CO2. I like this one better as there is more basis in physics, and it fits evidence from earlier geological epochs.
Now for the important one: the ice ages. the temperatures fluctuated by 10C, but CO2 levels only changed by 80ppm. CO2 could not have caused such large changes. If not CO2, what did, and is it still acting? I may write a post on this! But it will be a non-volcanic one, and I need to ask on the back channel whether the admins will allow such a post. I am happy for discussions but don’t want to start a war.. Perhaps I can mix it with ‘did volcanoes start the ice ages’ (answer: no).
Albert and Agimac, Very interesting discussion between you! Please do not start war but continue to weigh facts and arguments, and if possible share a BR or two.Realy good for us non experts to learn from your discussion. So much of the info we get otherwise is filtered through a lot of politics. Better to have it directly from initiated scientists!
Seismic swarm at Etna schools near the volcano have been evacuated.
ucesosdelmundo.es/internacional/registran-intensa-actividad-sismica-en-la-zona-del-volcan-etna
http://sucesosdelmundo.es/internacional/registran-intensa-actividad-sismica-en-la-zona-del-volcan-etna
Monday
30.01.2017 13:47:05 64.674 -17.457 9.4 km 4.4 99.0 5.0 km NE of Bárðarbunga
Bardarbunga responding to Katla with her own M4+ star. 😀
Quite deep tho, both stars around 10km. Thats lower than the plug, isnt it?
Yes it’s very deep. At least much more than usual ones…
Monday
30.01.2017 13:55:17 64.678 -17.483 10.3 km 3.5 99.0 4.7 km NNE of Bárðarbunga
Monday
30.01.2017 13:50:03 64.658 -17.553 7.2 km 2.6 99.0 2.3 km NNW of Bárðarbunga
Monday
30.01.2017 13:47:05 64.674 -17.457 9.4 km 4.4 99.0 5.0 km NE of Bárðarbunga
And another one! Without counting this last one there was M4.3, 4.1 and 3.8!
Monday
30.01.2017 15:19:46 64.678 -17.410 8.2 km 3.4 99.0 7.0 km NE of Bárðarbunga
Yes, I’d think twice about hiking the Laugavergur now, too.
The Almannavarnir warning signs near Emstrur and Basar suggest heading to higher ground to avoid gases, which is sound advice except that it places you in positions more exposed to lightning strikes.
That was meant to be a reply to Irpsit at 10.29 today, just in case anyone was wondering.
The Laugavegur hike, to those that don´t know, goes from Torfajokull-Hekla region southwards passing west of Katla and then between Katla and Eyjafjallajokull (though this last leg is hard, so most hikers skip it).
The last time I did it, was back in 2014, and the river that drains the west part of the ice age, was very SO2 smelling compared to my former hikes back in 2012 and 2010. As I hiked across the sandur, many lava bombs are spread around, making me think that this place is a nightmare spot to be when the eruption starts.
The civil protection basically tells you, if that starts, head to high ground (to escape floods) but it tells you that you are basically trapped – if you are already south of Emstrur – with flooding pathways to the west, north and south, and Katla to the east. All within a couple of kms.
Nevertheless it´s an outstanding hike. You cross Torfajokull caldera, hiking through snowfields and extremely colorful rhyolite hills; then you cross the black sandurs just west of Katla, and at one point you nearly reach the edge of the ice age; at this step you cross several unbridged glacial rivers; then you follow the deepest canyon in Iceland and probably in Europe; and as you near Eyfjallajokull you enter one of the last remaining original birch forests of Iceland in the lowlands; then you hike atop Fimmvorduhals eruption site located in between the ice caps of Eyjafjallajokull and Katla. It´s 4-6 days of pure joy.
I haven’t walked the whole Laugavegur, but I’ve walked in the Landmannalaugar area and in 2013 I joined it from the eastern side of Mælifellsandur and then walked over to Skogar. From that section of it, I’d agree, it’s a tremendous walk and I’d recommend it to anyone.
We did that walk in 2013 and the Emstruá gorge smelt of sulphur then, and the fresh lava at Fimmvorðuháls was steaming, too. I didn’t know enough about geology then to recognize the lava bombs, but perhaps that’s just as well! It poured with rain all day (and snowed) when we walked from Basar to Skogar, so our joy was slightly diluted!
Here’s a link to Civil Protection’s Katla eruption guidelines: http://www.almannavarnir.is/wp-content/uploads/2016/04/almv_baekl_EN_vef.pdf
What month of year did you walk?
July. Is it weather you are wondering about?
It is not a big issue, but you seem to be combining two separate hiking routes in your comment above Irpsit and it could lead to a misunderstanding.
“Laugavegurinn” is normally referred to as the hiking route between “Landmannalaugar” and “Þórsmörk”.
This is not a very detailed map but gives you an idea where it is (author is not mentioned on page):
http://www.islandia.is/bo/laugavefur/leidin.html
The hiking route betwen Katla and Eyjafjallajokull is referred to with the name of the mountain pass where the hiking route is: “Fimmvörðuháls.” It is the hiking route between “Básar” (near Þórsmörk) and “Skógar” (or Skógafoss waterfall).
Here is a map from a page organized by Einar Hrafnkell Haraldsson:
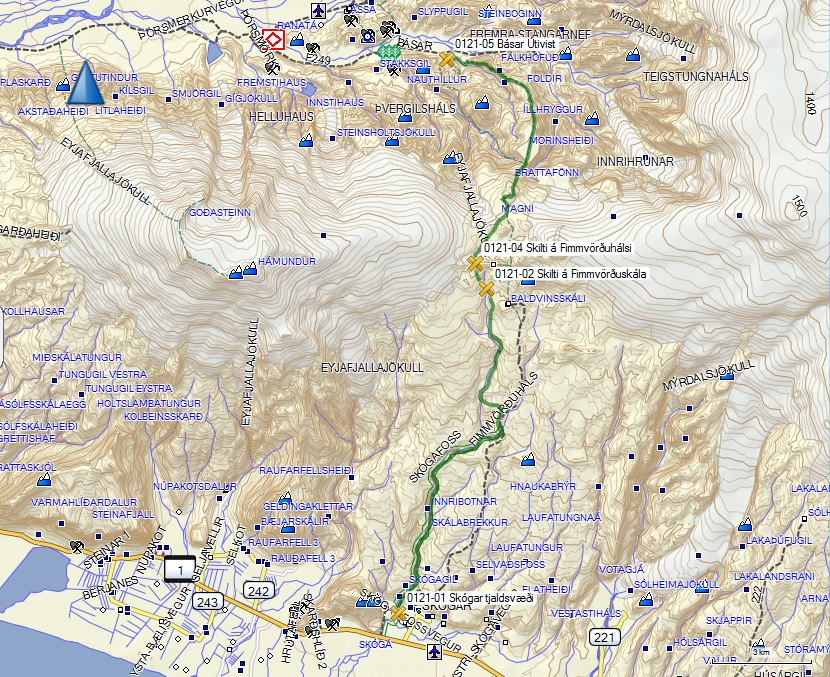
Hi all
Thanks for so many good posts!
now Etna at: http://volcams.malinpebbles.com/pubweb/Etna.htm
Here’s another Etna cam I watch at Skyline webcam.
http://www.skylinewebcams.com/en/webcam/italia/sicilia/catania/vulcano-etna-sud.html
Skiing today on Etna. Presumably there is little concern over the volcano’s behaviour.
Looking at this plot, quakes at Bardarbunga seem to be getting slightly stronger in average and increasing by depth down, instead of up.
That’s probably just coincidence and not a trend. If you look at the graph around the M4 in August you would probably draw the opposite conclusion. I think the quakes are quite evenly distributed along the entire ring fault, which stretches all the way down to 10km.
Too early to tell, but it does seem that the quakes deeper than 5 km are getting stronger, and this activity is new: going back to March 2015, there wasn’t much of significance at this depth. Perhaps some recharging of the magma chamber. It would be nice to see inflation data: the reduction in shallow quakes may indicate some lessening of the stress there, for instance (speculation alert) from pressure spread over a wider area or less hydrothermal activity.
If we look at the quake activity during the eruption, the seismic activity was quite evenly spread out over depths between 0-10km. Those quakes were due to subsidence along the ring fault. The quake distribution that we see now follows a very similar pattern from 0-10km, only much weaker. I know what Carl says about it, but I still think that the plug is being slowly pushed back up. I would really like to see some beach balls of the larger quakes.
The plot shows the distribution of cumulative seismic moment as a function of depth. Values have been converted to magnitude scale before plotting, which means that if the energy of all registered quakes in an interval were released as a single quake, that is the magnitude it would get.
That is a nice plot! Reality check: is this for the caldera only or does it include the dyke(s)? Can we make it for different time periods, e.g. for quakes only since the lull 6 months ago?
Assuming it is only the caldera: the flat moment distribution during the eruption, between 1 and 10km depth suggests the deflation affected areas down to 10 km but not much deeper. The current quakes mirror this, so there is a case to say it is still related to the eruption – either a slow re-bounce or further collapse (I’ll hedge my bets on this, but would be inclined to go for a bounce). But deeper than 15 km it looks different, with current activity relativity stronger than during the eruption. I would guess that is new magma, having reached a depth of 15 km.
Thanks! It’s the caldera, plus ‘Unknownabunga’. Bounding box: [-17.7 -17.1 64.55 64.75]
Before the M4s started to appear it was also quite flat. The first M4s made it a bit skewed, but now it’s starting to look flat again. I can add a few time intervals to the plot.
Month by month animation of how the above plot evolved since the end of the eruption.
This is a very interesting visualization of how volcanic earthquakes often tend to be larger the closer they are towards the crust. The explanation of this trend being that hotter rock deeper in the crust is more ductile, and less likely to experience the brittle fractures that would cause larger earthquakes.
And for Alaskan interest (apart from the regrowth of Bogoslof), there was an M5 underneath Mt McKinley today.
Albert, is MT McKinley a volcano, if it isn’t, why is this earthquake significant?
No it is not a volcano.
Indeed, it is granite. Still growing, and presumably that is related to the earthquake.
New post up – as promised. As volcanic as Mt McKinley.
http://www.volcanocafe.org/ice-age/