
Okmok is a known hazard. The volcano occupies its own half of Umnak, an isolated part of the Aleutian islands. Okmok is possibly the most active of the 40-odd Aleutian volcanoes. Over the past 8600 years it has produced over 50 ash layers from separate explosions, and minor eruptions happen every other decade. AVO has done an extensive hazard analysis. Among the listed dangers are debris avalanches, lahars, pyroclastic flows which could reach up to 30 km away and impact neighbouring Unalaska, and ballistic projectiles thrown 5 km from the caldera. The potential of this volcano is shown by the thick and deeply eroded pyroclastic layer which covers the entire region. But now it seems one hazard was overlooked by the investigators. As all risk assessments, it only looked at what was expected. The unexpected is never included. The big one they missed was Okmok’s potential to topple Europe’s republics. Admittedly, this is not a standard item on risk assessments: it was an easy one to overlook.

Source: http://dggs.alaska.gov/webpubs/dggs/ri/oversized/ri2004_003_sh001.pdf. Click on image for higher resolution.
A map of Umnak shows Okmok as the northeastern half of the island, connected by an isthmus. The volcano covers some 120 km2. Half of this is taken up by its central caldera, 9 km across. The caldera rim peaks at 1150 m, and the caldera itself is at around 500 meters above sea, albeit bumpy. Okmok is a shield volcano, with gentle slopes. Even though its part of the island is all just Okmok, it is not the highest volcano there: that is Tulik, 1250 meters tall, which is a cone that grew on a flank vent. There are some 30 smaller parasitic cones scattered around the island, including a number inside the caldera. Recent eruptions have come from these caldera cones.
A large eruption in 2008 became quite disruptive. This was not so much to the locals as there was only such person living around Okmok and he was safely evacuated, but the impact was on the wider area. It turned out that Okmok is located directly underneath the main North Pacific flight path. The ash closed the area for flights whilst the pumice did the same for shipping.

The caldera seems badly oversized for the volcano. Mapping of deposits on Umnak has shown that it formed during two main eruptions, the first carbon-dated to 11,500 BP, and the second one to 2050+-50 BP. Okmok-I, as the first eruption is called, consisted of a series of large eruptions which together produced a pyroclastic layer 100 meters thick. One flow reached Unalaska island, 20 km away. The caldera which formed at this time quickly acquired a lake. The volume of the eruption is around 30 km3 DRE, possibly more if a substantial amount ended up in the sea. It may have been a VEI-7.
Several significant eruptions occurred over the centuries before the second main eruption, often explosive because of the presence of water. On at least one of these occasions pyroclastic flows again reached Unalaska.
But the next eruption was much more significant. The Okmok-II eruption left 80 meters of pyroclastic flow deposit near the rim of the caldera, and 30 meters or more on the coast; it buried the Okmok-I ejecta. Unalaska was reached again, and this time it was also hit by a tsunami. The eruption occured inside the caldera at a time it was filled by a lake. The eruption was perhaps half the size of Okmok-I. After this, the volcano remained active with numerous smaller eruptions, similar to its present state. The lake refilled to a depth of 150 meters, but some 300 to 400 years ago the caldera rim gave way and the lake emptied northward in a catastrophic flood. At some point in time another 10-meter thick pyroclastic deposit formed, originating from Tulik, but this is not dated. The 2008 eruption reached VEI-4. Okmok-I may have been VEI-7, and the Okmok-II eruption was VEI-6.

Source: http://dggs.alaska.gov/webpubs/dggs/ri/text/ri2004_003.pdf. Ash layers along the southern coast (Cape Kettle) showing the numerous explosive eruptions between the two caldera-forming eruptions. The 60-cm thick layer of scoria at the top is from Okmok-II.
The two Okmok eruptions were large, but not unprecedented. Across the globe, an eruption like Okmok-II may happen every one or two centuries. Okmok-I was more significant, something that may happen perhaps 2 or 3 times per millennium. It will have had worldwide impacts. For the smaller Okmok-II eruption, you would expect some impact on the climate, but the main effects would be near the volcano. And Okmok is very isolated. It should have been a safe eruption.
But something strange happened. Half a world away, an empire had reached a turning point. And Okmok exploded into a crisis.

Rome, 44 BC
The Roman empire is known for its emperors. Augustus and Nero are perhaps the most famous of these, one a builder, one a destroyer, one evil, one a complex character. But this is not how the empire started. It had begun as a republic with a leading clan of aristocrats but no single authoritarian leader. Decisions were made collectively by the senate, and leaders (consuls) were elected for limited periods. The wars with Carthage, with Hannibal as the best known adversary, were fought under this system. But it could be tricky. Collective decision making was slow and could falter in a time of crisis. The senate therefore had the option of electing a dictator, a person to rule unopposed for a finite period. This relied not just on the willingness of the person involved to step down at the end, but also on the fact that the loyalty of the troops was to Rome, not to the dictator. If a dictator would develop political ambitions beyond the crisis, a quiet word by the aristocrats to the army leaders would solve the problem. But as the empire grew, the military became more powerful than the senate and the system cracked. Julius Ceasar was the most brilliant of the military leaders, and he became fed up with the slow and inadequate decision making by the senate. When he crossed the Rubicon he took legions loyal to him into the capital, marching into direct conflict with the senate.
War followed, and the leader of the senate had to flee. Ceasar was elected dictator for the period of the crisis he had initiated himself. But his ambition went beyond that and in early 44 BC Ceasar declared himself Dictator Perpetuus or dictator for life. The senate was not impressed, and on the ides of March (March 15) Ceasar was lured into the senate, attacked, and killed.
The senate had expected the population to support them in this. But in fact, Ceasar was popular with the people: the population rioted and burned down the senate, leaving the perpetrators with little choice but to flee. They went to the east of the empire, Macedonia and Syria, where they assembled their armies. Over the next year, the politics and occasional battles left a triumvirate in charge in Rome, led by general Mark Antony with young Octavian as the second most important. Octavian had been adopted by Julius Ceasar as his son, albeit only in his will – i.e. posthumously; he saw himself as the chosen successor. Fifteen years of civil war followed during which the fled senators were decisively defeated, and many other senators were killed or made destitute.
During the long war Mark Antony became involved with the Egyptian ruler Cleopatra, like Ceasar before him. (Cleopatra was the last of the Ptolemaic rulers of Egypt, the final vestige of Alexander’s empire. Although she is often depicted as traditional Egyptian, the family was from Macedonia). Mark Antony moved his attention to the eastern half of the empire, the ancient heart of civilization, perhaps more cultured than Rome, while Octavian governed the western half of the empire, perhaps less important but including Rome itself. At times the two worked together but both were too ambitious for that to last. Octavian acquired himself a top general, an old school friend called Agrippa. Octavian himself was not gifted in battle strategy and he was physically not strong enough to take part in fighting. Agrippa’s military brilliance and Octavian’s gift at populism turned the tide in their favour. Around 31 BC Antony’s empire collapsed, he and Cleopatra committed suicide, and Octavian’s rule became undisputed.
In 27 BC Octavian became the first emperor, adopting the name of Augustus. The senate continued, but Rome’s time as a republic had ended.

Octavian
The senate changed with aristocracy giving way to meritocracy for acquiring its members; it now even included wealthy members from the conquered provinces. A considerable minimum income was required to be considered for membership. Augustus eventually became a competent leader who managed the empire well. He build a system of government that lasted. Step by step, he replaced the existing structures by a working -and by and large honest – bureaucracy. Many aspects of our modern state were designed by Augustus. He may have lacked the brilliancy of Ceasar, but by going slow he build something that lasted far longer. But from now on, the empire would always be dependent on the armies. After his death the emperorship was passed on in the family, until all semblance of competence was lost. But even afterwards, the emperor was selected based on popularity with the legions and not on competence in government.
The Roman empire with its newly designed bureaucracy lasted for centuries, but it had become an autocracy. Augustus rarely used his autocratic powers: he governed by consulting often and looking for consent. But his successors made more use of the unlimited power the position of emperor gave, and this was dangerous when an incompetent or unscrupulous leader emerged. Eventually, the empire fell from within.
But this conflict in the Roman world was not only about personal ambitions and perceived destiny with a touch of romance. The natural world also played a role. Reports describing the beginning of the civil strife comment how the sun seemed dim, even dark. When Octavian entered Rome in early May of 44 BC, stars could be seen in the daytime around a dim sun, with a halo looking like “wreaths made from ears of wheat” and rings of changing colour. This was presented as a favourable omen. And in July of that year, during Ceasar’s funeral celebrations, a comet was seen in daylight for seven successive days. Years later, depictions of Julius Ceasar would often include a comet behind him.
The poet Virgil later recalled this time as one of “wars that grow in the dark like cancer.”
Contemporary writers attributed the dim sun to an eruption from Etna which was said to have happened shortly before Ceasar’s assassination, where lava streamed into the sea 18 km away, and hot ash fell 70 km away.
But was it Etna? We have no other record of this eruption, and it is hard to see how even a significant Etna eruption (VEI 3) could lead to a year of darkness. And now it seems that the real culprit was that volcano a world away from the Roman empire: Okmok.
Okmok
Volcanic eruptions can seem obvious to recognize. The next time Grimsvotn explodes, the news will go around the world in minutes. Pinatubo is a familiar name to us, even though few of us will ever go there. But this volcanic familiarity is recent. The first major volcanic eruption that became world news was Krakatau. The one before, Tambora in 1815, was largely unnoticed, even though it killed more people than any other natural disaster ever did in the British empire. The disastrous year without summer was only linked to its eruption a century later. And the major eruption in 1808 was never recognized, even though it played a role in ending Napoleon’s adventures in Russia. 200 years later, we still have no idea which volcano was responsible for the (perhaps) second largest eruption of the last 300 years. Even for Okmok, the significant 2008 eruption was missed by AVO and was reported by passing planes.
But where our recording is lacking, the natural world takes over. A record of old eruptions is kept on ice. The deep ice cores of Greenland and Antarctica show thin layers of sulphate deposits, each from a different eruption. The second best record is from tree rings, which show when the climate worsens. In a now-famous paper in 2015, Sigl et al combined these two to get accurate dates for large eruptions over the past 2500 years. The plot is shown below. The well-known eruptions are clearly visible: Ilopongo in 540, Eldgja in 939, and Rinjani in 1257. Others are unknown: for instance, the VLE (very large event) around 430 BC is possibly the second largest eruption over the past 2500 years, but we do not know which volcano this was. A hint can be given by comparing Greenland and Antarctica: if only one shows it it was a high-latitude eruption towards that pole, if both show it it was near the tropics. The 430 BC eruption left a larger signal in Antarctica and so may have been at subtropical southern latitudes. That is all we know.

Figure from Sigl, M., J. et al. Timing and climate forcing of volcanic eruptions for the past 2,500 years. Nature 523, 543–549 (2015). https://doi.org/10.1038/nature14565
The 44BC eruption clearly shows up, and it is clearly a northern eruption. How large? That depends on how far from Greenland it was. For instance, the Tianchi 945 eruption was large, but shows up poorly probably because the wind blew the ejecta away from Greenland, while Hekla 1108 was smaller but left much more of a signal because of proximity.
The actual volcano can be identified if any tephra is found in the ice core. This is rare: dust grains rarely travel far; sulphate (much smaller particles) are distributed via the stratosphere but tephra can’t float up there and falls back. Rinjani was identified through ice core tephra but that was an exceptional eruption. But by a lucky break, tephra was found in the ice core layer of the 44BC eruption. And it unequivocally, without a doubt, pointed at Okmok. The alkali weight percentage of 4%-6% and the SiO2 percentage of 52%-60% is a close match for the pyroclastic deposits from Okmok-II, and not with any other candidate for this eruption. As a volcanic fingerprint, this is about as good as it gets.
This eruption is also known from tree rings. A large eruption especially affects spring and summer temperatures (it reduces sunlight and this has the most effect when there is most sunlight). This is exactly when trees grow, and thus a bad eruption shows up in the thickness (or wellness) of those rings. An eruption causes a sudden narrowing of the rings, followed by a gradual recovery. And this is indeed seen, and strongly so, in North American trees. This also points at a North American volcano as the cause.
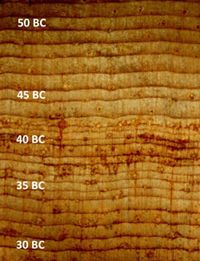
These tree rings of an American pine tree show narrow and irregular growth rings after the year 44 BC. Note that in this picture, rings at the bottom are younger than the ones above. Full recovery was only in 39 BC. (Credit: Matthew Salzer).
The tree rings in American pine of 43 BC and 42 BC are narrow, and show evidence of frost damage. This indicates an exceptionally cold summer. The frosted tree rings in 42 BC were noted already in 1984. There was a partial recovery in 41 BC and 40 BC. Trees in Scandinavia and Austria confirm that the cold summer weather extended to those regions, with temperatures of 2 to 3 degrees below normal during these two years. Even a bristlecone pine in California’s White Mountains show a frost ring, indicating frost in early September 43 BC.
Rome

The Forum, the political centre of Rome during the events of 44 BC
The description of the events in Rome in 44 BC seem to fit well with the Okmok-II eruption, with reports of the dimming of the sun which is reminiscent of stratospheric sulphate. It is a convincing story. But there is one slight problem. The evidence of the tree rings indicates that the Okmok eruption happened in early 43 BC. The growth ring of 44BC is normal (even wider than normal in the image shown above) and only in 43 BC did conditions deteriorate. But in that case, how could the sun dim already in 44 BC? It has been suggested there were two Okmok eruptions, with an initial one in 45 BC. But this seems exceedingly unlikely. It would have to be another VEI 6 and these don’t come that often. Was it Etna after all? Or is the situation more complex?
One of the Greenland ice cores does show a sulphate peak 2.5 years before Okmok, fairly strong but short-lived. It was only seen in Northern Greenland. This suggests it originated close to Greenland, and a link to Iceland appears plausible while a link to Etna is unlikely. But if the sulphate was limited to just one part of Greenland, it is perhaps unlikely that it reached Rome, and very unlikely that it had widespread repercussions across the Roman empire.
There is something funny about the descriptions of the events in 44 BC. The stars were reported to have been visible in daylight. That cannot be true, and this nice story must be fake news. Anything that dims the sun will also dim the stars. Worse, some of the intercepted light from the sun is scattered in all directions and makes the sky milky white. Seeing stars in daytime under such conditions is impossible. Other documents refer to a bright-coloured halo around the sun. That sounds more like a corona: an edge-coloured disk caused by water droplets in the air. This is a weather-related phenomenon, and does not require a volcano.
There is also something strange about the comet, which in July was seen in daytime for seven days. To be visible in the daytime it must have been among the brightest comets of the past 2500 years. But no one else saw it. Chinese reports indicate a comet had been visible in May. In July that comet would already have been on the way out, and much fainter. It has been suggested that the comet suffered an outburst. But this is rare, and it would have had to be an extreme outburst to make the comet so bright. Strangely, the images showing Ceasar with a symbolic comet were from many years later. Earlier images instead show a star. It seems likely that the comet was a story that came later. It never happened. One of the most famous comets of antiquity was an invention.
Could the same be true for the dimness of the sun? Was this something that did not happen in 44 BC, but one or two years later? Octavian was well aware of the power of symbolism. Did he change the story to strengthen the symbolism, and thereby his claim to power? Perhaps it was a bit of both, with some aftereffects of the Etna eruption of February(?) 44 BC playing a role, with added embellishment or even invention. It is an interesting complexity that we have three eruptions around this time, from Etna, a possible volcano in Iceland, and the big one from Okmok, and we have reports of veiled skies and halos in Italy, but that it is very hard to link these. The story does not quite add up.
Could our timeline for the eruption be off? The ice core dates are indeed uncertain by 1 or 2 years. A Chinese record of cold temperatures, which has been argued to be related to Okmok, is uncertain by 5 years and should probably be ignored. The precise dates for the eruption are actually obtained from the tree rings, and the ice cores are shifted to bring them into agreement with the tree rings. The tree rings are counted back from the 1257 Rinjani eruption. An entire ring may be missing after an exceptionally year: for instance the oak chronology in Europe misses a year in 1816, the ‘year without summer’. Several independent tree chronologies are therefore used to cross-match, and the result of this is believed to be accurate to within 1 year, going back as far as 12,000 BC. There seems little room to move Okmok-II to the preceding year.
But strangely, although we have descriptions of a dimmed sun from 44 BC, there are none for the following year when Okmok actually erupted. Plutarch writes about the year of Ceasar’s death that “the brightness of the sun was darkened, the which all that year through rose very pale, and shined not out, whereby it gave but small heat: therefore the air being very cloudy and dark, by the weakness of the heat that could not come forth, did cause the earth to bring forth but raw and unripe fruit, which rotted before it could ripe“. But the tree rings clearly indicate that the significant impact on the climate of this eruption occured a year later. It is not unlikely that in the written documents, events that happened in 43 BC where transferred to the previous year, embellishing the story about the fall of Ceasar and the rise of Octavian.
Egypt

There are several allusions to poor weather and harvests around this time. The clearest of these is Plutarch, mentioned above. One of the murders of Ceasar, Marcus Brutus (made famous by Shakespeare with the speech of the dying Ceasar ‘et tu, Brutus’), fled to the east where he is said to have marched through snow storms. During the subsequent war, Mark Antony and Octavian suffered from cold weather in Philippi in 42 BC. Other descriptions agree that the winter of November 44 to February 43 BC was a cold one. However, this area of the Balkans has much much colder and snowier winters than Rome, and the complainants may just have been unfamiliar with the local conditions.
Shortage of food became a growing problem. The opposing armies had trouble getting food after the battle of April 43 BC in northern Italy, and again around the battle of Philippi in October 42 BC when both armies tried to buy food from Egypt but were rebuffed, because of shortages there.
Rome itself also suffered from a lack of food after 43 BC. A naval blockade by Sextus Pompei was hindering food imports into Italy between 43 BC and 37 BC. This became a major problem. Rome was not self-sufficient in food, and depended on food imports by sea. It required around 150,000 tons of wheat per year. Many citizens received free or subsidized supplies of grain. Octavian found the population in near revolt. The blockade was resolved only when Sextus Pompei was invited to join the ruling triumvirate.
The real reason for the shortage in Rome may have been the fall in production in Egypt where a famine developed in 43/42BC, rather than the blockade. Egypt’s food production is closely linked to the Nile summer floods, and these we know can fail after major volcanic eruptions. One should not overinterpret this: there was also famine in Egypt in 48 BC – that was actually a worse year for lack of flooding than after Okmok. The Nile is not the most reliable of rivers. Egypt used major grain storage facilities to guard against the years when the floods would not come. These storages were used in both years to feed the population.
Seneca wrote : It is well established that in the reign of Cleopatra the Nile did not flood for two successive years, the tenth and eleventh of her reign. They say that this was a sign of the loss of power for the two rulers of the world, for the empire of Antony and Cleopatra did fall. (The tenth and the eleventh years of Cleopatra’s reign correspond to 43-41 BCE. Her reign began sometime between March 52 BC and March 51 BC.)
Later, the priest Kallimachus wrote: Kallimachos, the [..] revenue officer for the district of Thebes, and gymnasiarch and cavalry-commander, previously having taken over the city, which had been ruined [as a result of] manifold [disastrous] circumstances, tended it carefully [and maintained it] unburdened [in] complete peace [..] the severe famine caused by a crop failure like none hitherto recorded, and when the city had been almost crushed by [need] …he voluntarily contributed to the salvation of each of the local inhabitants… …The famine, however, continued in the present year and became even worse [..] a failure of the flood and misery far worse than ever before reigning throughout the whole [land] and the condition of the city being wholly critical….
(Taken from https://www.nature.com/articles/s41467-017-00957-y
Thebes was the old capital, located where nowadays Luxor is found. By this time it was in decline.
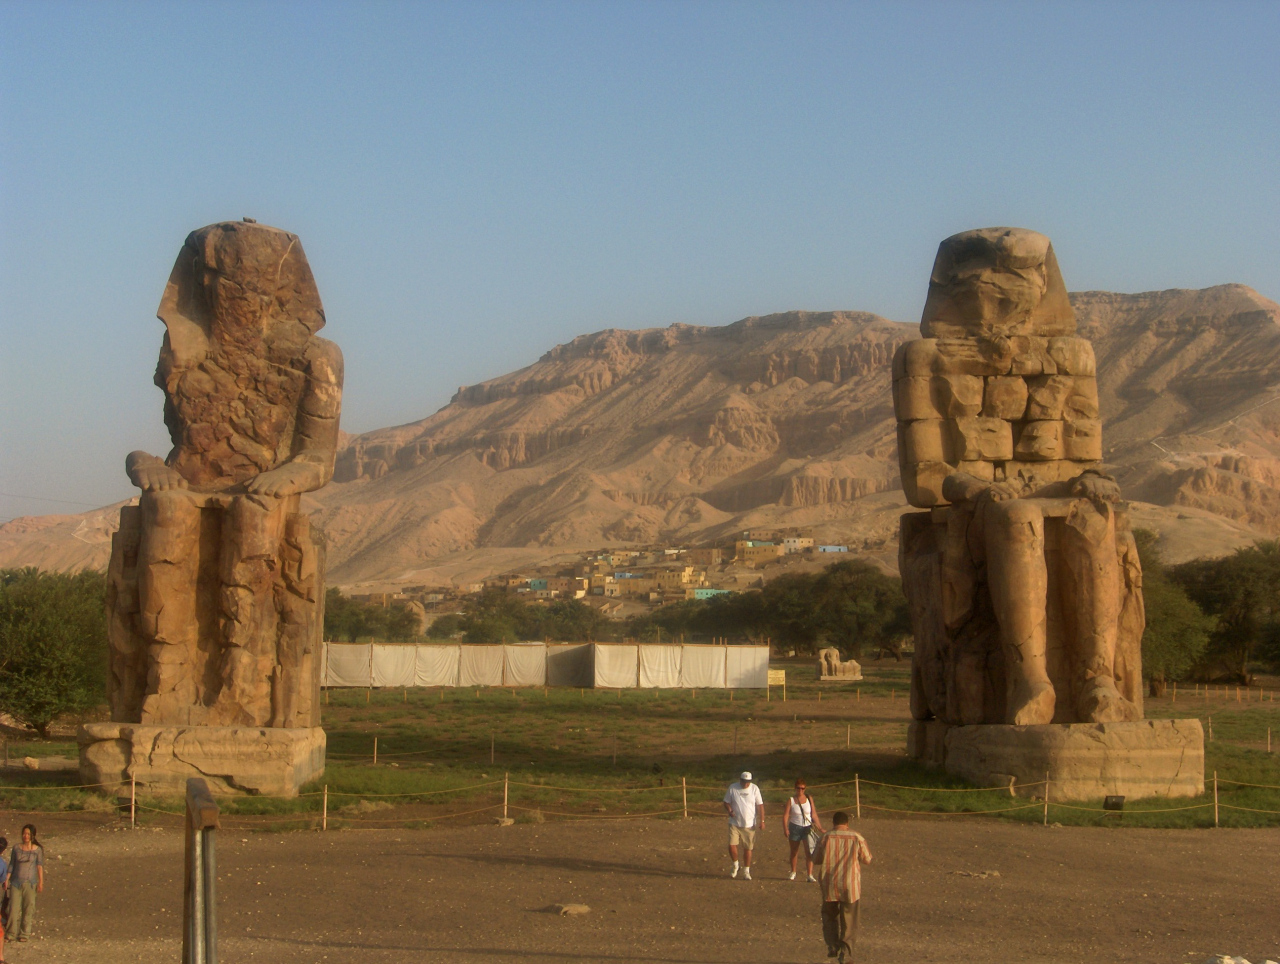
Colossi of Memnon, Thebes
Let’s put some more detail on this. The Nile floods are fed by the monsoon rains in the Ethiopian highlands. The floods reach Egypt in June, but the major event starts mid-July (or used to – the Nile floods no longer). This irrigates the crops, and the harvest happens at the end of the floods around October. The Nile floods are known to be negatively affected by northern eruptions: they failed after Eldgjá (939), Laki (1783–1784) and Katmai (1912). The Okmok eruption in early 43 BC would have impacted food production after the summer of that year. But the first reports of shortages are from April of that year. It seems there was a problem already – or perhaps Cleopatra did not at that time wish to take sides in the Roman civil war.
The comment on the Nile flood failing in the tenth and eleventh year of Cleopatra’s reign is a clear sign of when the impacts happened. It puts the first failure in 43 BC, and this favours an Okmok eruption in early 43 BC. Even though uncertainty remains, events in 44 BC or even early 43 BC cannot easily be explained by the Aleutian eruption.

The Nile in flood
Volcanic battles
What can we conclude? In the battle between the Roman republic and the distant volcano, did Okmok side with the military usurpers? Did Okmok turn Rome into a classical version of Ragnarok? (Rokmorok?) Here, we have to declare a draw. The beginning of the war, from the assassination of Ceasar to the battles in Northern Italy of early 43 BC, were free of volcanic influence. Reports of the dim sun, and the optical effects in the sky were exaggerated or conveniently re-dated, for reasons of propaganda.
The real wars did not begin until 42 BC when the main battle was fought in October 42 BC at Philippi. Was this fought under the cloud of Okmok? If so, the impact was not so much from the weather but from the lack of food. After a VEI-6 in early 43 BC, by October 42 BC the skies should have largely cleared, unless the eruption was particularly sulphur-rich.
The next crisis came in 41 BC when Rome itself was near revolt from lack of food. This was probably related to Okmok, as an aftereffect. Octavian managed to use this crisis to strengthen his position.
And perhaps there was another fall-out from the food crisis. For why did Cleopatra attach herself to Mark Antony, long before the outcome of the struggles became clear? One can guess that Egypt was in a bad way, as shown by the report from Kallimachus, with two major famines in quick succession. She urgently needed an ally, and Mark Antony was available.
So did the Republic fall because of Okmok? Clearly not. The Republic lost its main battles well before the Okmok eruption had its worst impact. The eruption brought chaos to the next few years. Octavian used this chaos best, and he came out the winner. This was how the Roman Empire was born. Okmok played a role. But it was neither the cause, nor determined the outcome.
Republics can survive one disaster. The VEI-7 eruptions of Tambora and Rinjani had a massive impact but they left no lasting world-wide damage. The double eruption of 536/540 AD did major damage to the later Roman Empire, because of the epidemic that came in its wake. Okmok was just a single eruption – there was no double blow and Rome may have had a hard time but it managed to complete a transition that was already inevitable. But not everyone was so lucky. The major casualty of Okmok was not Rome, but Egypt, already weakened and in decline. The volcano’s final victim was perhaps Egypt’s last queen: Cleopatra.
Albert, July 2020

Cleopatra
Sources
Preliminary volcano-hazard assessment for Okmok Volcano, Umnak Island, Alaska
http://dggs.alaska.gov/webpubs/dggs/ri/text/ri2004_003.pdf
Extreme climate after massive eruption of Alaska’s Okmok volcano in 43 BCE and effects on the late Roman Republic and Ptolemaic Kingdom. McConnell et al, 2020, https://doi.org/10.1073/pnas.2002722117 (access blocked)
Nile summer flooding triggers revolt and constrains interstate conflict in ancient Egypt. Manning et al, Nature Communications 8, 900 (2017). https://doi.org/10.1038/s41467-017-00957-y (open access)
Desert Research Institute https://www.dri.edu/eruption-of-alaskas-okmok-volcano-linked-to-mysterious-period-of-extreme-cold-in-ancient-rome/
Augustus: The Life of Rome’s First Emperor. Anthony Everitt https://erenow.net/biographies/augustusthelifeofromefirstemperor/


Great post.. enjoyed the read!
Awesome post Albert:thank you.
Are we ever going to solve the 1808/9 mystery?
I am open for suggestions!
Have you considered a submarine eruption. I saw an article a couple of months ago in connection with the 540 period.
https://watchers.news/2019/12/19/undersea-volcanism-year-of-darkness-536-ad/
That paper it describes is significantly out of date. It uses an old ice layer dating system which is off by a few years, and was written before we knew that the 536 eruption was north of 35 latitude, and that the 540 was equatorial with Ilopongo as a strong candidate. The paper is also wrong on the sulfur amount which was much higher than they thought.
Could the 536 eruption have been submarine? Not deep, we know that, but something like Krakatau, perhaps. But I think it is a caldera we already know, but which has not been dated correctly.
I see your point of not being deep. Le havre yielded extensive pumace rafts. I’m thinking a couple of things. The volume had to be enough to force itself through the sea into the atmosphere if it was submarine or an island destroyed itself and it hasn’t entered the historical record if in fact such a submarine eruption occurred.
Great reading! Wonder what effects such an eruption will have on our modern world considering the effects of the Corona pandemic. This, in the vast majority relatively mild infection (yes, I and my wife had it PCR comfirmed, and we are in our late sixties), leaves deep tracks in economy and politics. What impact will a volcanic winter have? 🙄
That is the big question, isn’t it. Can we handle a double crisis. Corona is mainly an economic crisis: the disease can be controlled but at immense economic cost. A major eruption now would hit food supply and I know Carl was already concerned about the food situation in the developing world. A lot depends on how many people really are immune. It is interesting that southeast Asia has escaped with so few cases. To me, that does not seem to be just because of effective policy, because it involves several countries with widely different systems. I wonder whether there might be a significant degree of immunity there, perhaps because that is where the virus originated.
Best of my current understanding is there is evidence that some people have partial T Cell immunity from exposure to previous corona viruses (but no pre-existing cross reactive protective antibodies). Especially with a trace exposure that gives them a head start in dealing with the virus. However a large initial viral load can swamp this. If you go out and are unlucky enough to get infected by the 1 person in 10,000 currently infected you are likely to get a smaller initial load than if 1 in 4 people you met that day were infected.
,
I haven’t seen any papers provide evidence that partial T Cell immunity is greater in Asia although it has been speculated. Various nationalities on the Diamond Princess seemed to be infected at the same rate as far as I know.
One thing the countries with very low rates do seem to have in common though is face masks. Masks should help with at least reducing initial viral load.
This news item published in 2016 so well before the current pandemic.
https://www.nippon.com/en/features/jg00084/
Next week Scotland intends to make mask wearing compulsory in shops. I’m not sure how that is going to work as I’d say only about 1 in 10 people in Scottish shops are currently wearing masks (most staff aren’t wearing one either) and I don’t know how the remaining 90% of the population are going to get hold of one by Friday. Still at least they are available now in Tesco. I reckon if I buy them all up I can stand outside Tesco on Friday when they are compulsory, but now out of stock, and sell at ten times cost – well at least until I get beaten up, arrested or die from covid.
Bah… make them nervous at their inferior masks.
No, I haven’t taken to wearing my tyvex suit… but I have one available. And no, your eyes aren’t deceiving you, I really am that blind. Legally so without corrective lens.
NIOSH rated P100, dual cartridge, VOC capable.
As one fascinated by history, this was a very interesting read, Albert. Thank you! The recent disasters in Australia make me wonder if there had also been a fire event in 44BC? However, I’m sure that would have left a pretty obvious trail somewhere.
As a watcher of kings and generals, i knew that the volcano did cause the end of the republic.
There a plenty of other eruptions that had a larger impact on histories, so why not study them?
Which ones are you thinking of?
There is 536-550 climate anomaly, and how that portents to the Americas and the Bynzantines. Samalas with the Mongol empire, El Chichon with the black death, Laki with the french revolution.
These eruption impacts on society are poorly studied, but they probably had much larger impact on history then Okmok.
You could read this post: https://www.volcanocafe.org/volcanohistology-when-eruptions-make-a-difference/ And fill in the gaps. Which volcano dumped ash on Constantinople in 626 AD? None, perhaps?
And if you need something to worry about, how about this post: https://www.volcanocafe.org/the-un-frozen-north-a-hotbed-for-large-volcanic-activity/
Okmok is not alone ..
Yep. Albert, Yellowstone is the least of our worries. Even a version of Novarupta on Katmai would screw things up in N. hemisphere for a while. And the is always the possibility of two going off close together. which makes me wonder if that isn’t a possibility with some of the
events we have seen in the past..
More than one volcanic perp.
Sometimes, its almost always the volcanoes with very small magma supplys that does the rare huge
high volume eruptions.
Some arc stratovolcanoes are dormant for ten thousands of years, with very small supplys.
And one day they wake up with large VEI 6 and 7 plinians
Large magma supplys only yeilds constant small scale basaltic activity and long lived flows
It’s worth remembering that the water flow of the Nile is still a hot international topic, with the potential to lead to conflict. Especially with the new dam being built in Ethiopia.
The Economist | Dam bluster https://www.economist.com/leaders/2020/07/04/egypt-ethiopia-and-sudan-must-learn-how-to-share-the-nile-river?frsc=dg%7Ce
A large eruption effecting the water supply to the Nile would be a major event in the area.
A hot very Sulfurious Grimsvötn caldera wall. The sulfur output is large and was not there before 2019, and not before 2011 either. The intresting part is that SO2 degasses when very close to the surface, hundreds of meters, so it shows magma is could be really close to the surface. Grimsvotn often rises a dikes from deep in its magma chamber in hours or minutes to erupt, so to have magma so close now and just sitting there is surprising and coud be a change in behaviour. But the SO2 could be degassing from old dikes or something similar. But the report of high levels of SO2 could maybe indicate an open long-lived conduit if its trys forming.
A local arera on the caldera cliffs are hot and sulfur rich now
where did you find the information?
Iceland geologists been at caldera rim and seen extremely High So2 readings
That was not there before. Magma is rising under the rim.
And its very shallow since the sulfur can
now bubble out.
The caldera inflated 30 centimeters compared to end of 2018
Carl is in contact with IMO ask him
But it coud be years when Grimsvötn erupts
Hey this picture shows uplift and not some other deformation or am I wrong?

Vertical change between the stations GRVC and GFUM ‘real time processed’
The explaining underneath the graph,
‘The picture shows the height difference and the change in height between the gps of the pagers in’ …. etc.
Interesting is this graph too.
Height change from gps device located in Grimsvötn, sea level referenced
0.8 M up in a month.
Is this the rising of the lake? Jokulhaup is coming.
I am not sure about GRVC, but the GFUM gps can be quite jumpy.
Cannot recall the station location differences between GFUM (Grimsfjall) and GRVC (Grimsvötn). Someone?
GRVC does not show up in the index of GPS stations. http://brunnur.vedur.is/gps/timeseries/
The figure 0.87 m in a month would be too excessive for inflation of any volcano that is not undergoing an eruption or sill/dike intrusion. And GFUM shows 5 cm of inflation in a year which is closer to what would be expected.
I can’t find any info on GRVC but I doubt it represents inflation.
That is why I think it is the lake level. grvc could stand for grimsvotn vatnid (grimsvotn lake) or some such! Pure guess, of course.
The only realistic possibility that comes to my mind is if a sill had intruded very shallow under the caldera flow, thus not producing much seismic activity and a localized uplift, but if that was the case IMO would have reported the intrusion.
The very High So2 readings during
non eruption are classical signs of Grimsvötns fluid basaltic magmas that allows gases to escape.
But There is lots of degassing in the caldera floor too.
But been 30 centimeters of inflation since 2019
Almost a meter since 2011 then
“Earlier this month, scientists from the Icelandic Met Office measured sulphur dioxide (SO2) in the southwest corner of the caldera in Grímsvötn, close to where the last eruptions in 2004 and 2011 took place. “This is the first time that we measure so much SO2 at a volcano in Iceland that is not in an eruptive phase and its presence is indicative of magma at shallow level,” says Melissa Anne Pfeffer, a specialist at the Met Office who participated in the recent trip on Vatnajökull glacier. In addition to the high level of SO2, Melissa also reports that the area where geothermal activity can be detected at the surface of the volcano has notably increased.”
https://www.icelandreview.com/nature-travel/evidence-that-grimsvotn-volcano-is-preparing-for-next-eruption/
It would be interesting to know how this compares to the situation before the 2004 and 2011 eruptions, sadly there seems to be very little information available. I guess the only way would be to ask IMO.
This is all signs of magma moving up
Lots of inflation
Grimsvotn is indeed an open conduit system, hardly any earthquakes.
Seems hot and mushy liquid down there
Albert its inflated alot this year!
Alot
This is fresh magma Thats being moved into Grimsvötn upper magma change
Apparently Without very much earthquakes
The magma chamber is very shallow in Grimsvötn, it sits at high level. Perhaps only 2 kilometers below the caldera.
Fairly similar to Kilaūea
The precise morphology of Grimsvötn magma chambers is poorly mapped
I initially read that as “Albert has inflated a lot this year”. That’s a bit personal I thought, but common during the lockdown I’ve heard. 🙂
Anyway I can safely joke as I’m sure Albert is off at the pub since they opened again in England at 6am today – unless you live in “ghost town” Leicester of course…
https://www.dailymail.co.uk/news/article-8490209/Police-stop-locked-residents-leaving-Covid-hit-Leicester-remains-ghost-town.html
“Whack-a-Mole – Catch the preview in Leicester now. Soon to be on Nationwide Release!”
London today
Earlier
And tonight
Albert you and Carl may ask IMO on How much tons of sulfur gas Grimsvötn releases everyday now.
And If that emissions was there just before 1998, 2004, and 2011
If this is the first time Grimsvötn is degassing there before an eruption,
It coud be signs that an open pathway is forming.
Sulfur dioxide is signs that magma is very close to the surface.
I wants to know If there was any gas release there, just before 2011
I am not aware of any numbers. Sulfur degassing in Grimsvotn seems mainly hydrothermal, i.e. water circulating between the magma and the lake. An increase can come from more water (ice melt) or more heat. Of course it eventually comes from the magma chamber.
The inflation now is very Intresting
Grimsvötn is swelling constantly.
Suggests a constant even magma inflow
Just for information.
Newsparer The Welt+ – todays reading:
OUTBREAK OF THE OKMOK
The other doom of Cleopatra
Amazing, the power of Albert!
Kilauea south flank x2 4.3. Is she stirring?
Some south flank slip, within the ordinary.
Something wrong with the magnetic field?
Now in Corona times many borders are closed between european countries and travelling is kept att lowest level. Ignoring all restrictions hundreds, if not thousands individuals has still set of on long stealthy journeys over closed borders to reach their homes. Without GPS receivers they have relied mostly on the earths magnetic fields. But something has gone wrong these latest weeks. Large numbers of them have navigated wrong and many of them have been found hundreds of kilometers out of course, in most cases towards eastern longitudes. So what went wrong? Is it the Corona virus itself or is something going on with the magnetic field??
Oh, I forgot to tell that all this is about pigeons/racing homers. Someone out here who could give a clue to their problems??
Do you maybe have a source for this information about pigeons getting lost recently?
All from a friend of mine who lost a number of his own pigeons in a race from Bremen/Germany to southern Sweden some weeks ago. He clames that all Swedish participating owners and the Danish he knows of lost many birds. Som of them were reportedly found alive hundreds of kilometers east. This happened some weeks ago mostly in excellent weather conditions. The sun and stars should have been visible. Yes, their navigation methods are still enigmatic, likely based on several different skills. As the sun and stars most likely were in their normal positions :-), It must have been a disturbance in a system we humans cannot sense. Smell??? magnetic turbulence?? wave of black matter??
In the past, on (French) navigational charts there was the annual deviation of magnetic declination, which had to be taken into account in order to have true magnetic north.
With the recent acceleration of the movement of the magnetic pole towards Siberia, using an old value can induce errors, and not taking into account a larger one
There is a lot of discussion but remarkable little evidence that pigeons use the earth magnetic field for orientation. They use the sun for orientation and smell for direction. Magnetic field is only used for orientation when there is no sun. If a lot of pigeons go wrong, the most likely cause is complicated wind patterns.
Corona can lead to loss of smell in humans but I have not heard of any effect on pigeons…
I have to say that I am sure there are magnetic detectors in the eyes (astonishingly) of birds (at least) which rely on an unexpected quantum phenomena. You would have to google it but an article will be in either new scientist or scientific american, I would say within the last two years, Sadly both paywalled.
Whenever you see ‘quantum phenomena’ and ‘biology’ together you should be quite sceptical. In such cases ‘quantum’ normally means ‘magic’. And yes, there is some sensitivity to magnetic fields in organisms. But what is it used for? It can tell you roughly which way is north. In theory you can get latitude from the downward angle of the field but there is no evidence organisms can detect this. Experiments have been done with putting magnets on pigeons and see what happens. Result: it confuses mainly the youngest birds, and mainly in cloudy weather. Under normal circumstances, pigeons use the sun to know which way is north. But the main result of the experiments have been to show how good the olfactory sense in pigeons is. They can smell their home region from hundreds of miles away.
Note added in proof: it can tell you which direction is north-south. Telling which one is north and which one south is much harder..
I’ve always had a sense for where north is, enough that friends have tested me against a compass. Make of it what you will but a mildly amusing story from this is when my wife and I flew to Italy for a holiday. Landing near Pisa we came out to get a rental car.
I found my north/south sense totally addled. So addled, it was the wrong way around. I was totally confused outside the airport and could not orientate myself via maps, the land layout or anything. I felt convinced the hills I could see lay in the opposite direction, even though our road south through them was clearly on the map. It took me two days to get back to ‘normal’.
That’s the only time the sense has been scrambled and it was the strangest feeling – a disorientation that I could not define.
I’ll say one thing – I would not trust it to navigate hundreds of miles!
https://www.newscientist.com/article/mg20927963-000-quantum-states-last-longer-in-birds-eyes/
other similar from reputable sources.
My own suspicion is that although some animals may well have a sensitivity to magnetism of some sort, we all have some level of subliminal awareness of direction. We are probably aware at some level of the direction of the Sun’s movement across the sky, prevailing wind, and which side of a tree has the thickest moss, all of which give us clues as to compass direction.
Here’s an article about it. I remember as you did a bout 2 or 3 years ago this was in the news.
https://www.pbs.org/wgbh/nova/article/birds-quantum-entanglement/
I also read somewhere there was also a theory that photosynthesis is actually more efficient that it should which was explained by ‘quantum phenomena’.
If proven it’s interesting to see how quantum effects in our ‘macro’world can be applied
I know the research and was far from convinced. Even the group themselves call it ‘speculative’.
And for some really odd reason, I ordered a chunk of optical calcite just for fun.
https://m.youtube.com/watch?v=H4_zkgZAJ1E
14:36 – 14:53
21: 12 – 22: 19
Amazing lava waves!
Kilaueas lavas are extremely fluid!
These lava waves spreading over the filling Iki lava lake, are amazing to watch. Just like waves on an ocean.
The viscosity of Kilaūea summit magmas are exceedingly low, probaly the most fluid of all normal sillicate lavas today.
Its probaly also the hottest of Earths magmas today.
These are exceedingly fluid lavas.
Cannot stop watching this.
and a spinning vortex drainback back into the vent Amazing!
Kilauea Iki was such a unique and spectacular eruption, another one of its most spectacular eruptions was Mauna Ulu, here is a video from one of its episodes (not sure which one), it has all sorts of fluid lava action toward the end. Hard to decide which of the 2 eruptions was more gorgeous!
https://youtu.be/nYHRY4Kd-WA
And Nyiragongo also does splendid lava waves, we know thanks to the Kraftts (I am guessing this must have been the 1982 eruption). At 5:39:
https://www.youtube.com/watch?v=x21rUj3inLg
I am probably the only here but I sort feel an urge to jump into a drainback and go into the volcano when I see one of those on video.
These Nyiragongo Krafft footage are from 1973 and 1982
Amazing fludity
Halema’uma’u had similar waves in 1967
Emphermal lava pools
Both Nyiragongo and Kilaūea have exceedingly low viscosity.
Nyiragongo because of extremely low sillica and high temperature.
Kilaūea summit haves extremely fluid low viscosity too despite much higher sillica
Its probaly because Hawaiian Thoelites are so very very hot.
Kilaūea summit magmas had have viscosities as low as 10 Pas or lower.
Halema’uma’u 2008 – 2018 was so fluid it reminded me of liquid aluminium sloshing around. Extremely low viscosities Hawaii haves at Kilaūea.
And Kilaūea is my favorite volcano too : )
Please post more videos of fluid lava action If you finds any.
The following channel has a lot of videos on eruptions from Hawaii and Ol Doinyo Lengai, it has published videos on many historic hawaiian eruptions, you might find it interesting if you don’t know it already:
https://www.youtube.com/user/volcanoimage/featured
I know 3 other videos on lava pools of Kilauea (Kilauea must have done several tens of lava pools in its history though few are recorded).
1934 Halema’uma’u: https://www.usgs.gov/media/videos/mauna-loa-volcano-hawaii-1930s-eruption-part-5-5
1961 Halema’uma’u (3rd eruption of 1961 I think): https://youtu.be/_BRnGikv2VQ
1998 (or so it says) Pu’u’o’o: https://youtu.be/MBUKOATZP9s
https://m.youtube.com/watch?v=K6mefA_QSrg
Good one on Mauna Ulu. The lava falls are spectacular over a 100 meters high into Ale pit crater.
I been on Mauna Ulu 7 times and climbed it
Loved it every time.
But the
shelly pahoehoe is terrible to walk on!
Craaash craaash!
And the steep lava splash channels up makes obstacles when you hikes up.
Nice film!
Thanks for the films I seen all these LoL
Kilaūea is also my fav volcano.
I haves a question
Knowing that Puu Oo eruption drained magma constantly from Kilaūeas system.
If Puu Oo eruption Never happened
Woud the 2008 – 2018 Halema’uma’u lava lake constantly overflow?
Since No rift eruption woud rob the summit of pressure.
Without Puu Oo in action in alternative history.
Woud Halema’uma’u overlook overflow more?
If the connection to the rift had blocked and the lava lake was still there it would have started overflowing like crazy, it would channel out almost all of the 0.1-0.2 km³ supply (no spreading, no rift eruptions). That would go on until Mauna Loa took over the hotspot and then overflows would become infrequent.
By the way birth of a mountain ends with the 1974 eruption at Keanakako’i! That was a legit pahoehoe sheet flow, x10 that eruption rate and you might get something like Nyiragongo 2002. Part of the Keanakako’i eruption fed directly from the south caldera reservoir, it had more primitive magnesian lavas than usual eruptions of Kilauea. It is amazing to have that on camera even if it is just a few glimpses!
Kilaueas yearly supply is Often saied to be around 0,1 km3 every year.
But quite higher than that right?
It changes a lot over time, it can be extremely low during periods as long as centuries when Mauna Loa keeps its dominance.
While I don’t know the average, the current is probably a bit below 0.2 km³/year, the long-term growth of the island, this is because Mauna Loa currently gets a very small fraction.
And if you add the eruption rate of Pu’u’o’o, 0.12 km³/year, and how much magma is estimated to be accommodated into deep rift spreading, 0.05 km³/year, you get the expected number. Another small amount goes into shallow dikes and summit storage growth.
0.1 must be about right. by the way, several shallow quakes between the Pahala swarm and Kilauea. There is movement on the western rift. No magma though
The earthquakes are roughly in the sharp western limit of the mobile south flank, it could be some strike-slip faulting.
Among single individual Volcanoes
Kilaūea probaly haves the largest yearly supply of them all.
Carl always pushes foreward with Grimsvötn. But Grimsvötn is heavly robbed by passive rifting and most magmas never comes up. The estimated supply for Grimsvötn is poorly known and No good data exist
The magmas from Pahala is around 1600 C deep down! and glowing like the sun and flowing like liquid iron!
As the magmas rises up from the hotspot melting source, it cools and crystalize a bit. Kilaueas summit magmas haves often a tiny bit of Olivine crystals in it.
Its about 1220 C in Halema’uma’u. Perhaps 1240 C If its really hot.
The summit can erupt at full basalt liquidus temperature.
Hawaii is maybe hot enough to potentially erupt komatiite,
if the lava rised extremely fast quickly from depth into kilauea it likely would be erupting at well over 1500 C
Grimsvötn is getting seriously Intresting now = is inflating all the time
Also the gas emissions are curious
When is the next Grimsvötn article comming to Volcanocafe?
When is Carl getting back? I’ve loved the past articles from Albert and Carl on Grimsvotn, where the approach was mostly different but their conclusion was in the same ballpark.
Perhaps someone should reach out to turtlebirdman, as long as he gets his personal Kilauea page?
I have the feeling that because of the volcano quietness in the world going on since some time now (nothing Iceland, Hawaii or VEI 5ish), the comment section is becoming a bit sleepy.
Don’t get me wrong, I love the articles from Albert.
Maybe it’s just me and months in solitude.
And the fact that I can’t read half of the comment section on my iPhone.
As long as Jesper & Tallis bring some craziness from time to time, I’m satisfied.
So come on Laguna del Maule! Bring out the big guns.
Try turning your I phone on it’s side. The comments are much easier to read in landscape than portrait.
So simple yet so effective. Thanks!
I posted this in May, hope it helps:
In Safari what you need is the AA symbol to the left of the address bar at the top. Tap that to drop down the menu, and hit “Request Desktop Website”.
In Firefox, the three-dots icon to the right of the address bar brings down the Page Actions menu, which includes “Request Desktop Site”.
Both fix the problem and make it much easier to read.
I know, but this doesn’t work for me. Nothing happens after I click Request Desktop (Web)Site
So, the “mobile optimized” version is actually worse on mobile devices than the non-“mobile optimized” version?
What kind of definition of “optimized” are the admins using??
We have been here before. Lack of activity and other external factors make lengthy comment a bit unproductive. That the dragons produce articles of high quality periodically is well beyond the call of duty. However times will change, we have seen them change before. Stuff happens, but we have been a bit spoiled this last decade.
https://www.google.se/amp/s/scitechdaily.com/young-volcanic-island-nishinoshima-belches-ash-and-lava-as-it-grows-in-the-pacific/amp/
Nishinoshima is very active now
If it continues on this rate, it will become a Grand stratocone in just a few 100 years.
The viscosity and temperature and composition is similar to Heklas lavas.
Basaltic Andesite or a Hot Andesite
If it continues at this rate we will have a flank collapse within months.
The video I posted in the VC Bar that was entirely in Japanese has some satellite images showing a bit of a landslide on the cone.
This video
I’ve just had a Red VAAC alert pop up on my phone for Grimsvotn. Does anyone know anything?
Ignore. This is an announced test of the VAAC system. They are running a simulation of an eruption.
Grisvötn seems to be erupting, fligt code red, ash at 20000 ft.
Nope.
No panic. It is a test. Pity, really.
Minor swarm with a star near Herðubreiðartögl…
Yep. And a cracking swarm on Mauna Loa.
Double star now. Almost same location around 4km depth. Is this still the same ‘rebound’ from the intrusion that came from the funny-name-volcano?
Fairly shallow.
Has anyone seen what kind of signature this quake had?
3.0 once more, 4.5 km depth.
Looks like there is more stress released by the plates being pulling apart as usual now?
Reykjanes peninsula in the south, Husavik Flatey fault in the north, some minor faults halfway those…
This is how the fresh magma in Grimsvötn is like If it was visible
Extremely gas rich and very fluid and hot. Grimsvötn is a basalt gas slurry
Holuhraun magma looked very similar in Baugur.
Another volcanos magma in the video
But Icelandic basalt is probaly just as gassy
https://m.youtube.com/watch?v=vpHcoYyWWlo
Looks like we’ve been making quite a lot progress towards solving these mysterious sulfur spikes. Dull’s study on 540-to-Ilopongo is strong. I think there is one more independent team, led by Victoria Smith, that has just investigated the eruption date in detail but unpublished. Maybe they are waiting for IntCal20? It would be interesting to see if they will reach the same conclusion as Dull’s team
https://app.oxfordabstracts.com/events/574/program-app/submission/94180
The abstract associates Ilopongo with the 536AD eruption as they give a date no later than 535 AD. But this is unlikely as the 535/536 was a northern eruption. As you say, Ilopongo is associated with the 540AD tropical eruption instead, and this was strengthened by The Dull 2019 paper. Note that Smith’ work is not about the dating but about the ejecta. It was published in https://www.sciencedirect.com/science/article/pii/S0377027318303706. Probably pay-walled (it asked me for a login). I have no idea why volcanologists tend to hide their papers and make them inaccessible. It seems to be surprisingly common in volcanology compared to other research areas. After all the effort involved in the research, why prohibit people from reading it?
They mentioned a promising dating from a Mahogany tree stump in the abstract. It seems the result was not published with the article on jvgr. Do you have any clue to why?
Yeah volcanology papers are expensive nowadays.
It’s the journal that causes the paywall, not the scientist.
Elsevier is the prime culprit.
True, but other disciplines have found ways around it, mainly the preprint servers. The version of the paper that was accepted for publication is not owned by the journal but by the scientist. So that can be distributed and this is done in physics and in biology – but apparently not so much in volcanology. The scientist benefits too, as papers that are in preprint archives are cited more often than ones that are not.
True.
When I worked during my PhD (medical research), all my papers were in Elsevier, but we had them also in our university website for free access. It didn´t do that, it was my IT colleague that took care of the website and uploaded all papers there. So this requires a conscious effort from a research group to publish it elsewhere, like we did. Most scientists do not go that far.
Usually scientists are just solely concerned to publish papers (in the journals that are pay-walled) so they get to build a good curriculum, which is a requirement to get research grants. The more papers the better, and some papers in high impact journals as the cherry on the top of the cake.
@Irpsit. The situation has slightly changed. Today, funding agencies often require you to publish open-source. When I used to publish a lot (chemistry, material science), only the impact factor counted.
It is coming. The EU now requires it for funding as well. University repositories are becoming more common but are difficult to access and too often only link to an abstract with the paper hiding in the dungeons. The Arxiv system works best. It is funded by a consortium of universities, and exists for biology, physics and math. Google scholar links to it when available. But for some reason, geology does not have an arxiv domain. Many scientists are unaware of how difficult it is to read their papers. They live within their university domain which may subscribe to their favourite journal. Other universities may not.
One warning: never ever pay for access a paper. The charge is there to put you off, and to force universities to subscribe. If you pay, the publisher just needs to raise their charge until you stop. Ask around, contact the author, ask your library – lots of ways to get hold of the paper.
As a (retired) librarian I agree with Albert. Ask your university librarian. When I was active I have many kinds of resources, quite a few rarely known, from which I could acquire papers.
Luckily my employer has many institutional subscriptions, and since we have a geological department…. 😉
Having read the above I will more gratiously send out copies of papers at requests. (why do people do want to read these articles that were written ages ago, really puzzles me….)
https://en.vedur.is/earthquakes-and-volcanism/earthquakes#view=table
Tuesday
14.07.2020 00:56:17 64.620 -17.490 1.1 km 4.0 50.5 2.9 km SE of Bárðarbunga
Gautier et last year proposed to use sulfate isotopes to identify historical large eruptions, better than just looking at sulfur concentration alone. It seems like they identified a major eruption around 74-ka but glass shards trapped in that layer do not share composition with YTT.
https://meetingorganizer.copernicus.org/EGU2020/EGU2020-4.html?EGUSphere#discussion
Works to be published soon!!!
Wasn’t there also a (non-super) Yellowstone eruption around that time? This would have been much smaller than the YTT, but also much closer to Greenland, particularly in latitude.
If memory serves, I do believe there was a relatively minor eruption in Yellowstone around that time. I’d have to look it up, but wasn’t part of Yellowstone Lake excavated around then by an explosive blast?
The most recent eruptions from Yellowstone are very large but very slow slow Ryholite – Obsidian glass flows.
Pitchstone Plateau ryholitic glass flow is the latest lava flow from Yellowstone.
Late Pleistocene.
These flows can have volumes of 60 km3 and erupt very slowly over timespanns of 40 years. Degassed ryholite that came up.
Very slow gentle flows, over 150 meters thick and perhaps 40 kilometers long. Erupted very slowly.
This was from one of the ice-cores in Antartica and the sulfur spike is bipolar, so it should be a major low latitude eruption. Yellowstone was effusive during this period, unlikely to be the source.
The okmok-roman connection is mentioned again in Sweden’s biggest newspaper https://www.dn.se/nyheter/varlden/studie-vulkanutbrott-i-alaska-bakom-romarrikets-fall/
Japan today
Nishinoshima now! doing tall viscous Etna – Hekla style lava fountaining Nishinoshima doing fountains 100 s of meters tall now
https://www.jma.go.jp/jma/press/2007/15b/nishinoshima_200715.pdf
Wow.. wish I could read Japanese buy the pictures are impressive!
https://m.youtube.com/watch?v=r421zjv-hoE
Albert this scene is amazing! Amazing effects for being over 20 years old film.
I knows that Dantes Peak is totaly dog crap.But these effects here are stunning, and cannot fully be CGI.
The crusted pahoehoe lava on the road are probaly real thing, lots rock melted by by humans for the film.
Or a miniatyre? Both me and Jesper thinks the lava on the forest road is real effects, something hot poured there for film effects. It coud be poured asphalt with lots of stuff in it. But it coud be the real thing made poured from furnace by humans for the film effects.
With No actors in the car thats drives over for safety. The forest road lava looks like something physical and not CGI. For a very old film its stunning effects.
How did they do the lava on the road?
As Dustin say in youtube comment
”I’ve heard a rumor that this scene was mostly filmed for real, as in the truck was driven over actual lava that the film crew made by melting down rocks. It sounds crazy, but if you pay attention you’d notice that there is no clear view of the actors inside the truck when it’s viewed from the outside. They could’ve been using stunt drivers and tried to hide it, and the only reason they’d do that is if the main cast would be in danger otherwise., I swear up and down that what they’re driving over physically exists on screen
If it’s not actually real, then congrats to the animators who made the 1997 cgi look that convincing.”
While the rest of the lava in the end of the scene is clearly CGI fake
This was listed as spam by our filter, probably because of the youtube video. It was discovered there today – admin
Probaly is a miniatyre
But I watched Dantes Peak with directors commentary
And they saied
”This is the real thing!, we did it with avaible technology and just tryed it”
So teasing! and No more information
So it coud be something they melted down and used for the film. But it coud be a large miniatyre too.
Albert do you agree that the visual effects are stunning here? Its 23 years ago
Even if its a bit unrealistic
The lava they drive over is NOT cgi .. its real,
but what it is I dont know really
But the lava comming down the slope is indeed CGI
But How do they made the lava on the road pathway?
Short NHK video of Nishinoshima. Indeed impressive
https://twitter.com/i/status/1283723503879979009
Oops…. De-publishing myself rapidly…
Oops part II:
There seems to be no way to depublish an article.
Well, I guess it is raining articles today.
For everyone else, both me and Albert edited in at the same time not seeing the other.
So, here goes…
A new article is up about Nishinoshima’s seminal eruption!
https://www.volcanocafe.org/nishinoshima-the-seminal-eruption/
I have deleted my post. It will re-appear at some time in the future
pretty cool article about chillin’ Kilauea.
https://volcanoes.usgs.gov/observatories/hvo/hvo_volcano_watch.html?vwid=1473
What they found came as a surprise. A study published in the journal Science in May, 2020 describes how they detected deep earthquakes beneath Mauna Kea that repeat every 7–12 minutes. Noise in the seismic records from wind and nearby cars, together with the small size of the individual earthquakes (magnitude 1.5), had prevented these earthquakes from being detected with the regular earthquake detection system.
Grindavík throwing stars since sunday, pretty impressive.