
Our modern world is one of scepticism. Trust is scarce. In the UK, politicians tell the voters not to believe experts, at least those experts that the politicians do not agree with. Of course they assume a certain level of trust in politicians. Facts are disputed, and the contradictory era of false facts has arrived. A whole industry has grown up around changing the facts, with the aim to shape people’s opinions. We distrust experts, politicians, bankers, lawyers, – and this list can readily be expanded. But on whose authority do we question authority? If we don’t trust experts, who do we rely on for our information?
An extreme example is the scepticism expressed in some circles about the reality of the moon landings. It started with an article in the New York Times from December 1969 by John Wilford, although all he did was telling that this story went around some bars in Chicago. It gained little traction. Opinion polls showed that about 5% of the US population had doubts about the lunar Apollo landings. However, this changed when Fox news reported on the story in 2001, after which as many as 20% preferred the hoax. VC made use of this with one of the news items on the April-1 Mars Bar. It is reprinted below, for your enjoyment.
But the problem of false facts goes much further back than 1969. The (rather harmless) Flat Earth society started in the 1800’s, and it still exists. It now advertises itself as ‘free thinkers’ (that claim may have lost some of its credibility by advertising a round-the-world cruise.) The flat-earth stories have themselves an interesting history. In Greece, the view of a flat earth was replaced with that of a spherical world already in the 5th century BC. In South Asia, it took until the 5th century AD, and China remained flat until the 17th century. But you may have heard that Europe in the Middle Ages thought that the world was flat? It turns out, that is a fib. It would have been hard for such an idea to make a come-back. The story that Europe of Columbus believed in a flat earth appeared in the early 19th century: it can be traced to Washington Irvin’ biography, The Life And Voyages Of Christopher Columbus, published in 1829. It made for a nice story, but was a false fact.
But there is nothing new under the sun: false news has a much longer history, and seems a normal human attribute. The oldest recorded ‘false news’ is 3,000 years old, when Ramses II engraved great victories over Libya and Nubia, representing battles we now know he lost. Perhaps it was the headline in the Daily Papyrus or the Tablet Weekly?
Facts
It is important to discern which facts you should accept, and which you should treat with some healthy suspicion. When someone from Nigeria emails you with the request to give you a lot of money, letting greed get the better over common sense can become quite costly. So it is with phone calls about pension investment ‘opportunities’. And if a magazine reveals how crystals cure cancer, believing such false facts can badly damage your health.
So what is a fact and what is not? And why do we accept some facts but not others? It appears it partly depends on language. Facts need to be phrased in terms that people can relate to. Use the wrong words, and there is trouble. And it works both ways: a real fact using the wrong language may be rejected, while a false fact phrased in a language that resonates may be accepted. In a volcano blog, use the words ‘It’s going to blow!’ and the audience looses much of its critical faculties. An other example is the difference between the words ‘climate’ and ‘weather’. People know weather, but they do not experience ‘climate’ in the same way. The words ‘global warming’ convey what is happening in a way people understand. The words ‘climate change’ are vague, and meet more resistance. The importance of using the right language goes even further: research has shown that people who are bilingual are more likely to accept a fact in their first language, and more likely to deny it in the other language. Our language reflects (and determines) our way of thinking. The divisions go deep: people who speak different also think different. After all, what we call consciousness begins with putting our unconscious thoughts into words. The words and vocabulary we have mastered determine what enters our consciousness. The tower of Babel did lasting damage to the world.
Science
The battle between facts and non-facts, fake news and real news, is sometimes fought in the territory of science. Not everything that labels itself as science is indeed science. And science is an easy target, because it uses a language all of its own, which can be incomprehensible to those outside the ivory tower of babel. Everyday language and sentences are not precise enough for science, so that it needs to create new words and even sentence structure. But before science can go into battle, we first need to know what science stands for.
You can find definitions of ‘science’ on the internet, but they never seem to get to the heart of it. Some only apply to a single area of science, or a single way of doing science. Others are phrased in the language of philosophy, rather than that of science, introducing a whole new level of confusion.
To me, science is an empirical and systematic way of understanding the world. Its goal is to obtain knowledge (after all, that is what the word means). The ‘natural sciences’ operate by creating a model which fits current knowledge. Next, the intrepid scientist determines how the model responds to a new situation, and courageously tests this in the real world. If the test fails, the model needs changing, but any proposed change has to fit existing data and has to be tested in the same way, using a prediction on something which was not used in creating the model. As the data becomes more accurate, the models become more complex, but a complete change of the model is quite rare. Applied science now takes the model and uses it to design machines (or something similar). For example, the model of quantum physics is used to design (with disputed success) quantum computers. Medical science can skip over the model building phase. It puts more emphasis on practical outcomes, and worries less about exactly how medicines achieve that outcome. (To a physicist this sounds primitive, but physics does not have to deal with life and death situations). Psychology studies how stimuli lead to responses but exactly how the process works remains vague. All this is science, and what it has in common is that it always looks for evidence.
A very important point is that science is not based on personal authority. The models and the evidence can be checked by anyone, and it doesn’t matter who does an experiment: anyone doing the experiment in exactly the same way will find the same result. Science has its heroes, but the validity of data does not depend on who did what. Science belongs to everyone. This does not mean that everything done is science. A fossil hunter and a paleontologist may find the same thing, but if the fossil hunter fails to record the relevant details of the find and its context, science can’t do much with it. That is why fossils bought on ebay have little scientific value.
Bad science
But not all science is good science. You may read a paper that has an error in the interpretation. An effect may have been overlooked. And sometimes a paper has so many holes that you don’t know where to begin. Scientific publishing uses a system of peer refereeing to catch these cases, but things do slip through.
An example in volcanology is a paper claiming that explosive volcano eruptions depend on solar activity, which is sometimes mentioned on this blog. (I won’t mention the authors.) The paper claims that muons created by cosmic rays enter a magma chamber and can make it act as a bubble chamber: gas bubbles form and a run-away explosion is triggered. The study makes the spectacular claim that the solar cycle has an effect on volcanic explosions: during solar minimum, the solar wind is weaker, and as this wind keep cosmic rays out, the cosmic rays on earth increase. A careful reading of the paper reveals four main issues. The data consist of 11 eruptions of which 9 fit their expectation as occuring during a presumed solar minimum: that is too small a sample for a significant result. The muons which supposedly cause the eruption only penetrate a few meters into the ground, far too shallow to reach magma chambers. In any case, the muon flux is less than the radiation from natural radioactivity even at the surface of the earth, let alone in the ground. And finally, the muon flux only varies by a few per cent during the solar cycle, while the day-to-day variations are larger: a high flux can therefore occur at any time during the solar cycle. The data is unconvincing, the mechanism disputed (to put it mildly) and the model does not work.
Still, this is science. The paper follows the scientific method, and the results make a prediction which can be falsified. It is an example of rather poor science, but it is not pseudoscience.
Progress: the science of change
Science does not stand still. Take the flat earth as an example. There was a time, rather a long time ago, when a model of a flat earth made some sense. It fitted with the evidence of the eyes. But as more evidence came, and people traveled further, that changed. Accurate clocks showed that the times of sunset and sunrise were different in different places (the accurate clocks of course did not exist: the Greeks instead used times of solar and lunar eclipses seen around the Mediterranean). Nowadays we have a much better model, and the flat earth has been banished from the domain of science.
As an other example, the earth-centric model, where the sun moves around the earth, was proper science for a long time. It was central to Ptolemy’s Almagest which remained the reference book for astronomy for over a thousand years. The Almagest did not just survive out of scientific inertia. The model predicted where each planet would appear on the sky at what time, and how fast and it which direction it would move. The predictions were accurate, and therefore the model survived. When Copernicus proposed a model where the sun moves around the earth, it was not accepted – not because of religious concerns (as often assumed), but because the model did not predict the correct movement of the planets on the sky and the Almagest actually did a better job in fitting the data. A new model should be an improvement, not a step back! Now we know that this was because Copernicus assumed circular orbits while the Almagest used epicycles to form oval orbits: the latter is a better approximation. Tycho Brahe, a superb observer, was the first to find discrepancies between the predictions of the Almagest’ model and actual observations. The dispute was finally settled by Kepler, who showed that orbits are not circles but ellipses, and was able to account for Brahe’s data. In addition, Roemer showed that Jupiter orbits the sun, not the earth (which he did by measuring the distance to Jupiter at different times in its orbit). Nowadays we can measure the speed of the earth directly and the Almagest is now science of the past. Science moves and what once belonged in its domain may no longer.
Global warming is another example. The scientific argument raged in the 1990’s when the evidence was studied in great detail. The evidence for warming became conclusive. Predictions were made, and in the following decades the data confirmed the predictions. The earth is now considerable warmer than it was even in the 1990’s. The discussion has moved on. Details of the models are still being improved, and the discussion is about how fast and how much – not if. The IPCC reports specify in great details what aspects are secure, and where further work is needed.
Science uses the body of knowledge that exists at the time. Something that was science in the past may no longer agree with the data we currently have.
Pseudoscience
The term pseudoscience was first used in 1796, when James Andrew described alchemy as a fantastical pseudo-science. It was a most effective term which quickly caught on. The term has been used on occasion in the comments on this blog, not always justified.
What is pseudoscience, and how can you recognize it? The objective of the research is important: pseudoscience often is either about the promotion of a particular theory (whilst disregarding opposing evidence), or it has the goal to discredit a particular scientific theory or branch of science. In addition, it tries to give the impression that it is or reports science. Examples are alchemy and UFOs. Another is astrology, but its proponents can argue that they never claimed to be a science. There is a fair amount of pseudoscience involving volcanoes. Mainly one volcano, actually. Yellowstone.

There are a few general categories found in pseudoscience.
Denialism: the claim that there is a scientific controversy when there is in fact none. This is not new. In the science of history, holocaust denial dates back to the 1980’s. Tobacco companies denying a link to lung cancer, and chemical companies denying that CFCs destroy ozone, all fall in this category. These statements were supported by ‘research’ designed to promote one side. Obviously, science has real controversies, but denial tries to create a controversy in disregard of the evidence.
Scepticism: this term has been adopted by both sides and can therefore be confusing. Scepticism is an accepted part of science but it has to take account of the evidence. When it goes beyond this, and goes against the scientific consensus, it enters the realm of pseudoscience. Scientific scepticism questions assumptions behind models. Pseudoscientific scepticism questions the data.
Facts resistance: a disregard for the evidence when advocating a particular theory. A requirement for scientific papers is that opposing evidence is also presented and acknowledged. Pseudoscience does not do that: it ignores evidence that is not in its own interest.
How do you recognize pseudoscience? Here are some pointers, taken from the Stanford Encyclopedia of Philosophy
-Unrepeatable experiments: Reliance is put on experiments that cannot be repeated by others with the same outcome.
-Handpicked examples: Handpicked examples are used although they are not representative of the general category that the investigation refers to.
-Unwillingness to test: A theory is not tested although it is possible to test it.
-Disregard of refuting information: Observations or experiments that conflict with a theory are neglected.

This list can be extended but you will get the idea. To get an idea how pseudoscience can develop, the post https://www.volcanocafe.org/volcanoes-and-co2-continued/ tells how the fallacy that volcanoes produce CFCs came into the world, through a chain of hyperbole and chinese whispers.
Yellowstone
Yellowstone is the pseudoscientist’s favourite volcano. This is the most dangerous volcano in the world, at least, according to the usual suspects. Here is an excerpt from that well-known science journal, the Daily Mail, based on an USGS report.
The eruption could kill as many as 90,000 people almost instantly and release a 10 ft (3-meter) layer of molten ash 1,000 miles (1,609km) from the park.
The ash would block off all points of entry from the ground, and the spread of ash and gases into the atmosphere would stop most air travel, just as it did when a much smaller volcano erupted in Iceland in 2010.
Sulphuric gases released from the volcano would spring into the atmosphere and mix with the planet’s water vapour.
The haze of gas that could drape the country wouldn’t just dim the sunlight — it also would cool temperatures. It adds that falling temperatures would damage our food supply, destroying crops and causing a worldwide food shortage.
The article actually acknowledges that an eruption is not considered likely, and what it reports is indeed in the source material: it just focusses on one possibility.
You can find many of these stories, and they have a few things in common: they quote selectively from USGS research; they focus on the consequences of a supereruption; and somewhere in the article they will have a disclaimer saying that it is unlikely to happen. It is possible to find worse than this on the internet, often based on such second hand stories with the disclaimer left out. Here is a bad one from the weathernetwork:
About 600,000 years ago, the last super eruption occurred at Yellowstone Volcano, located in its own national park in Wyoming, U.S.A.
The eruption was so large that it played a part in sending the world into the last ice age.
Data suggests that Yellowstone erupts every 600,000 to 700,000 years, meaning it is due for another eruption.
The volcano has an elevation of almost 3,000 metres which, to put into perspective, is about a thousand metres smaller than the city of Toyko, Japan. A super eruption from it could send rocks and ash 1600 kilometers away from its current location.
Volcanologists have come up with different theories on how large the next eruption would be, and if it even would be large enough to consider it a super eruption, which is rated as a Magnitude 4 or greater on the Volcanic Explosivity Index (VEI).
According to the USGS, a super-eruption is equal to the force of 1,000 Hiroshima atomic bombs exploding every second, creating the potential for widespread destruction.
At this time, however, it’s still safe to visit Yellowstone, according to the USGS, which monitors the volcano daily and posts reports online. Scientists have no detection of any kind of warnings of an eruption happening in the immediate future. If they do detect something, they believe they would be able to see the activity months, or possibly a year, in advance.
While we won’t be around to see the next eruption, the next one is scheduled to take place in the near future, geologically-speaking. It’s forecasted to happen sometime in the next 1000 to 10,000 years.
It is very hard to find anything in this that is factually correct!
Here is another example. A paper in 2014 reported that helium degassing in Yellowstone was much larger than expected. They interpreted this as helium that has collected below the ancient craton over 2 billion years, until the Yellowstone hot spot melted through the crust 2 million years ago, and the helium found an escape. So far, this is very interesting as it shows how stable this craton has been. But this is what one random website made of it: What has scientists very concerned is that Yellowstone has suddenly begun emitting massive amounts of Helium-4. Helium-4 seems to be the predictor of activity, as proved with other volcanos. Apart from the typo, the site takes two observed but unrelated facts, leaves out confusing information such as the 2 million years that the helium has been leaking out, and builds up to the conclusion that an eruption is coming. This is pseudoscience in a action.
I should point out that in my experience, science journalists go to great length to get the story correct. They always ask about all the provisos of the research. They are normally scientifically trained and know what ‘uncertainty’ means.
What is the reality of Yellowstone? It has had three enormous eruptions in the past few million years, and a repeat would be bad news, although how bad is under discussion. There is a large magma reservoir at depth, and the geysers show that water is circulating through zones heated by the magma. On the other hand, for a supervolcano it is remarkable quiet. It hasn’t had a major eruption for half a million year, and no eruption at all for 70,000 years. At this rate, it may actually be one of the safest places in the US! The geysers are in fact a sign of the stability of Yellowstone. It may never erupt again, and if it does, it may be a small eruption. The chance of a VEI-8 event somewhere on earth is larger than that of any eruption at Yellowstone.

Yellowstone – the world’s safest volcano. Source: nationalparks.org
Volcanocafe
VC is a popular science blog. It tries to provide a forum to look at volcanoes (and a few other topics, on occasion) through the eyes (and language) of science, and makes scientific results accessible. After all, science is meant to be shared. It always amazes me when scientists publish papers in journals that restrict access. What is the point of doing research, but to publish your findings where no one can read them? But that is beside the point. The second goal of VC is to close the loop, by giving the public a chance to comment and in that way contribute to the progress of science. Centuries ago science was done by people in their spare time. (If you work at a university, it may feel like that is still the case.) We belong to that tradition.
Curiosity is an essential part of science. So is lack of knowledge! Science aims to learn, and you can’t learn if you know everything already – or think you do. Asking questions is fine – especially on this blog. The discussions they generate qualify as science. In most cases, at least.
Science is not everything. There are many aspects of our lives which it does not cover. It doesn’t know about right and wrong, it doesn’t do friendship and humanity, and it only knows love as a chemical. There is more to us than science. But that is beyond the topic of this post.
Albert, January 2019
Appendices
Here is the promised April-1 story:
Apollo 11 moon landing site found on Mars
NASA admits deception
Reprinted from http://news.marsbar.space/: see that site for more Mars news stories.

During the exploration of Mars, the Musk team has found a complete Apollo-11 landing module, surrounded by the various items used by the astronauts during the moonwalk movies. Even the famous footstep is still there.
When NASA was pressed about this discovery, the spokesperson admitted that the Apollo-11 landing had indeed been faked, and in reality had been staged on Mars. She said this was due to problems with the landing rockets. On Mars, they had been able to use the tested parachutes.
She said it had worked very well, but the strength of the wind on Mars had come as a surprise. ‘It became impossible to keep the flag still’, she said.
1 April 2018
Origin of a myth
A pseudoscience story of volcanic proportions, reprinted from https://www.volcanocafe.org/volcanoes-and-co2-continued/
Some have claimed that volcanoes emit more CO2 than humans do. Ian Plimer famously stated “Over the past 250 years, humans have added just one part of CO2 in 10,000 to the atmosphere. One volcanic cough can do this in a day.” A politician, Mike Huckabee, said “The volcano that erupted over in Northern Europe actually poured more CO2 into the air in that single act of nature than all of humans have in something like the past 100 years.“ He can be forgiven for not trying the pronounce the name Eyjafjallajökull. But what is the scientific truth?
It turns out, they were a little off in their numbers. Mike Huckabee claimed that Eyjafjallajökull produced as much CO2 as humanity in 100 years. The correct number is 30 minutes. Huckabee was therefore wrong by a factor of 1.7 million, a sad indictment of the level of numeracy required for government. Ian Plimer stated that one volcanic cough equalled 250 years of human CO2 emissions. He doesn’t define what a ‘cough’ is, but presumably it is less than one Eyjafjallajökull in which case he was wrong by a factor of at least 4 million, and possibly much more. ‘Astronomical’ doesn’t begin to describe it. Such extreme arithmetic errors can be career-defining for a politician but would be career-ending for an engineer. We can safely discount their numbers as silly.
So where did these outrageously wrong numbers come from? Both people wouldn’t have done the calculations themselves: they quoted from somewhere else. It turns out, there were several steps on their path from science to silliness.
The story began with a paper by David Johnson, published just after he died in the St Helens eruption. The paper discussed the chlorine emission from Augustine volcano, Alaska, 1976 and argued that of the 525 million kg of chlorine it produced (it erupted 0.19 km3 DRE), roughly 100 million kg could have reached the stratosphere in the form of HCl: such a stratospheric contribution would be equivalent to a quarter of the 1975 world industrial production of chlorine in fluorocarbons. Read that sentence twice to see what he actually said, and remember that at this time, fluorocarbons were just about to become a major concern because of the destruction of the ozone layer. Johnson argued that explosive eruptions could inject enough chlorine into the stratosphere to be a significant factor.
He also wrote that if the Bishop Tuff of Long Valley Caldera emitted the same fraction of chlorine, its stratospheric contribution would account for 570 times the 1975 world industrial production of chlorine in fluorocarbons. This number represented a 100 km3 eruption 700,000 years ago. In hindsight, the paper was correct about the total amount of chlorine, but overestimated how much of it entered the stratosphere. The explosions also eject water, and HCl dissolves into this water and rains out before it gets to the stratosphere. But that is a different story.
Dixie Lee Ray, in 1990, wrote that Augustine volcano put out 570 times the total world production of chlorine and fluorocarbon compounds in the year 1975. He quoted Johnson but mixed up the two volcanoes and ended up overstating the Johnson number by a factor of 2000. These things happen. He also used the number for the stratosphere as if it were for the entire atmosphere.
The next year, Pinatubo exploded and the discussions re-ignited. This was at a time when industries were trying to avoid restrictions on CFC production. In their defence, Rush Limbaugh stated in 1992: “Mount Pinatubo has put 570 times the amount of chlorine into the atmosphere in one eruption than all of man-made chlorofluorocarbons in one year”, again mixing up volcanoes, and also confusing the atmosphere and the stratosphere. (In fact, measurements did not show any significant increase of stratospheric chlorine after the eruption.) In Limbaugh’s book of 1993, he amended the statement to: “Mount Pinatubo in the Philippines spewed forth more than a thousand times the amount of ozone-depleting chemical in one eruption than all the fluorocarbons manufactured by wicked, diabolical, and insensitive corporations in history.” He changed a single year (1975) to all of history, and increased ‘570’ to ‘more than a thousand’. Note that he wrote in the context of a polemic defence of the chemical industry, and note his use of hyperbole.
After this, the story took on a life of its own. In 2006, Christopher Monckton said “In a good year for eruptions, Erebus can put out as much CFCs as Man used to.” This is another change of volcano, and again there is confusion with Long Valley, but in addition HCl has now become CFCs, something volcanoes do not produce. This confusion was clearly based on using Limbaugh as his primary source, as Limbaugh hadn’t specified which ozone-depleting chemical was meant – Monckton substituted the only one he knew about.
Remember the mentions of fluorocarbons? Jude Wanski, in 2004, wrote “The eruption of Mt. St. Helens in 1980 dumped more greenhouse gases into the atmosphere than all that has been released since the industrial revolution”. Long Valley has now morphed into St Helens, HCl has become ‘greenhouse gases’, and the stratosphere is again equated with the atmosphere. The greenhouse confusion came about because Monckton had changed HCl to CFCs, and these do act as powerful greenhouse gases.
And this led directly to Ian Plimer, who changed ‘greenhouse gases’ to ‘CO2’ (unaware there were others), and elsewhere in his book writes that Mt. Pinatubo released “very large quantities of chlorofluorocarbons”. He gives a reference to a 1992 paper, but this paper contradicts his writings and he cannot have read it. His information clearly came from Wanski. Mike Huckabee used Plimer as source, but substituted Eyjafjallajökull for Pinatubo (which through several previous substitutions was actually Long Valley) , CO2 for HCl, and 100 years for one year. (An interesting aside is that Eyjafjallajökull and Augustine had about the same eruption volume in DRE, so replacing one with the other could have been defended, had it been that simple.)
This strange story shows how important it is to go back to the original source, preferably peer reviewed. Authorative, reliable sources are needed for factual information. Pseudoscience picks any data that seems to support its objective, fails to check its accuracy, and ignores any opposing evidence. This is pseudoscience in action.


Once again you give another great article, I do love a peer in intelligence, one that forces me to think over my standing and just how solid it is in reality.
To me science is like religion, the core of it is to gain a more complete understanding on the nature of life and to better society. The core of science and religion is incorruptible but the one who brings the words or claims to understand them is easily corrupted with money or fame, and they go on bringing skepticism to a science or belief that should have none,
The messengers of science need to expose the lies, as a person who loves to study weather, climate, and geology. I feel it is my duty to clear misunderstandings and falsehoods. People put too much trust in society and think the information they give is immaculate but they fail to understand just how much science threatens some groups.
It’s only a religion if the proponents of one point of view ignore the tenets of what science is, and treat dissenting views as if they are heretics.
One important aspect is that the theories have to be specific and testable.
I believe science and religion have more in common then some what would like admit. They are vividly different but are still so similar in how they are treated in society, As a skeptic of modern views of climate change, people call me stupid, Oil whore, and a host of other names just because i don’t accept the highly politicized narrative in climate and pharmaceutical science.
I would say big companies are like the church of the middle ages quiet suppressing science that goes against their narrative, (Because of the spam dragon, i am only going to link to two articles but there is more.)
https://www.dailykos.com/stories/2015/03/27/1373484/-Monsanto-s-Discredit-Bureau-Swings-into-Action
https://www.courthousenews.com/Class-Says-Merck-Lied-About-Mumps-Vaccine/
People today do make a religion of science and vice versa, they both have their proper corners, religion isn’t the tool to cover astronomy (like if the earth is a globe) just as science isn’t the tool to cover logical first cause or natural infinities, or what makes something valuable or meaningful etc.
“-Disregard of refuting information: Observations or experiments that conflict with a theory are neglected. ‘ I have personally seen so much of this in academic science that it makes me quite skeptical of “studies” that prove the dominant paradigm. The first question I ask is, who funded that study? Second, was the experiment or data gathering designed so as to produce the conclusion the funding agency wanted. Often the bias enters in in the data gathering phase and that renders the objectivity of the analysis suspect.
Science nowadays always has to reveal its funders. That is not the case for politicians! There can be a tendency to look less hard at any issues in your work if you find the expected answer. A good referee will spot this, and in case over time it corrects itself. As for testing a paradigm, you always have to specify what a study aims to do. For instance, if the paradigm is ’10’ and the study finds 9+-1.2, it both confirms the paradigm and finds a different number. It can be reported in either way. That is why ‘studies of studies’ where people don’t do their own research by combine different studies, can come up with funny results. You can have ten studies that agree with the official model, but when you combine the data it may no longer do. These combination studies can miss that.
https://wattsupwiththat.com/2018/12/30/brace-yourself-for-a-brutal-winter-experts-say-disruptions-in-the-polar-vortex-could-cause-temperatures-to-plummet-in-parts-of-the-us/
This is a bit old.
And it’s on a climate change denial kookshite, I might add.
I have found a much more reasoned tone there than many other places that toe the party line and simply regurgitate what they are told.
Very nice article, highly illustrative!
Some comments on the scientific process…………..
In a large number of scientific fields, the process includes oral reports in congresses, then written reports in so-called scientific journals. Volcanocafé readers should be aware that there are scientific journals that accept just about any article while other newspapers only accept articles that are anonymously submitted to a reading committee. Of course, peer reviewed journals discriminate between “bad science” and “rigorous scientific work”. Peer reviewed journals generally provide higher quality articles that have a significant impact on scientific research. Of course, published results must be confirmed by other teams. Published scientific work is subject to criticism and questions from other fellows and, above all, to the test of time. Then we know the value of published scientific work.
That’s why I was surprised to see in VC an article published the same day in a scientific journal …
Money and scientific research………….
Without money, no research or career possible. Publish or perish. This can introduce some bias in a reasearch work (even cheating).
Politics and scientific result………….
A very good example of interaction: In France, in April 1986, Chernobyl accident, the French Office of Radiation Protection and Environmental Monitoring, under the direction of a university professor, states: “the cloud from Ukraine stopped at the french border. So that there is no risk”. No additional comment needed.
The problem also affects volcanology, in the form of retention of relevant information.
Perhaps a good example are the sites of volcanology observatories …. Do you know one that gives free access to all piece of information?
pseudoscience…………….
A preliminary remark: the boundary between “bad science” and “pseudoscience” is held.
At the time of the internet, anyone can publish anything and can be read on the other side of the world. Journalists have to write sensational articles to sell their newspapers. Actually, people are well educated. What is the impact of this problem? Maybe it’s only a problem for people that have particular psychological profile
………..
Conclusion:
ANY RESULT (provided by a scientist, a journalist, a politician; in other words a human being) MUST BE REVIEWED WITH A CRITICAL EYE (from the Merriam-Webster diccionnary : in a manner using or involving careful judgment about the good and bad parts).
LOL
Perhaps a good example are the sites of volcanology observatories ….
should be read
Perhaps a good example are the web sites of volcanology observatories ….
Data from US observatories are public. That is pretty much the rule across the world. The problem with this is twofold: the manpower to keep working data on web servers is often not available (it is a big job!) and the second is that the public demand for such data is so high that it quickly forces those servers off-line. That has gotten a lot worse recently.
Do you think that will limit more independent studies in the future?
I found VC very interesting and read poster for years. Sometimes, I ask myself from where they got these graphs. I didn’t found them on IMO websites. For instance, It seems to me the usable shape of EQ and Tremor are not publicly available. Last time I asked VC, that’s the answer I got. Is that a misunderstanding?
I doubt (seriously) that a meteorological institute does not have the staff to run computers.
Today, it’s easy to run a dedicated webserver: cpanel, centos 7, modsecurity, automatic update…. Thats’it.
Everything is a question of will!
To understand the interactions (mode of operation) between the political world and the observatories of volcanology, it is necessary to read all the official reports regarding the management of the la soufriere volcano and the disputes between Mr Allegre and Mr Tazieff.
It’s fascinatring.
Hopfully, cataclysmic events are rare!
I know HVO got overwhelmed in 2011 during the kamoamoa eruption, I don’t think that has happened so much recently because they have a bigger server now to accommodate the increased view load but after the show last year kilauea is suddenly on the top if the list of volcanoes that people are watching for activity so the next eruption will probably draw a massive crowd. Same for mt st helens whenever it reactivates again, even though in all likeliness it will be effusive dome building or even a basaltic eruption 1980 is still on everyones mind and the risk is always there.
I think the US government is also going to end shutdown soon out of necessity so all the observatories will finally be up and running fully again, HVO hasnt added a new picture since November 30 and I think quite a few people want to see what has been going on. A full aerial of the 2018 lava would be nice.
US goverment is a disaster today
Trump is a living nightmare!…
A huge forest in US was recently destroyed burned down by republicans
They are building border conceration camps, walls, destroying national parks
shooting wildlife, denying global warming…
Tyrannosauros Trump, Pencesaurous Dumb
Here is USA under trump 2019: https://www.youtube.com/watch?v=_qE5FSG6K0Y
There is NO limits how much I dislikes this orange brownshirt dinosaur in Office
We try to stay out of politics as we have a readership from across the political domain. And that is true for the admins themselves as well. And at least one of your accusations is not factually correct. I am personally very concerned about aspects of US policy, especially the reluctance to work on global warming while it is still a solvable problem. But global warming is within the scientific domain of this blog. Political choices are not.
Yea this is a page for volcanoes, you are correct
Im sorry— I dont like orange
Im happy to be home in sweden again.
Im going to stromboli in summer.
Volcanoes only here
All sides are just as bad these days! Trump’s plague is a reaction to the plague that is currently the other side. Result: no one wins! 😀
Jesper, think of orange as really, really hot lava. You know, the runny, yummy stuff of your dreams. For some it’s a scary destructive force, for others it’s a beautiful spectacle 😉
They forgot to add beryllium to that list…
Love you long time.
Mac
https://www.skylinewebcams.com/en/webcam/italia/sicilia/messina/stromboli.html
Stromboli is really active now! go and watch here the webcam is up and running
I’m so glad this cam is running again! Thanks for letting us know Jesper!
Looks like a new cinder cone is growing in that steep slope
I think we will see a collpase landslide into the ocean pretty soon.
Stromboli is one big hill of rubble and lava flows, unstable.
This is the BEST volcano webcam on the internet!
No other webcam beats this one
https://www.youtube.com/watch?v=PENT_hnyO-o
And I found the english version!
I may have posted this before
this is what woud happen if Vesta hit earth
Stromboli woud take many tens of thousands of years to erupt the same volume as Leilani
Stromboli only erupts little stones everyday
Apparently the modern volcano is largely the same since about 15000 years ago, so you are probably right on that. That is what made pu’u o’o stand out among long term continuous activity, it was actively erupting and with enough lava to sustain flows up to 20 km away for months to years. Many volcanoes are technically a lot more active than kilauea but erupt almost no lava, few volcanoes worldwide have what it rakes to create something like pu’u o’o and none could do it more than once except kilauea, which has managed to make 4 lava shields since 1969 and then do what it did last year on top…
No other volcano can compete with Kilauea!
Thats my favorite volcano too.
Kilauea is totaly massive count in the Puna Ridge and she is 200 km long and 60 km wide and around 14 km tall from her submarine pressed down base.
Her volume is over 55 000 km3.
Even the puna ridge itself is larger than all other subarieal volcanoes combined many times
Well I think it would be better to say no volcano outside hawaii can compete, the two maunas are far bigger. Mauna loa also generally has larger eruptions, but in terms of erupted volume kilauea is unrivaled in the modern day, technically based on the conversion of solid basalt to tephra being about 3/1 any eruption on kilauea that erupts more than 35 million m3 of lava is a VEI 4 equivalent, which is basically about 80% of eruptions on kilauea and every year between 1983 and 2018. Fissure 8 would have reached VEI 4 status in less than 2 days and been a decent VEI 5 in total volume (3.6 km3) that is after reaching the equivalent of over 0.5 km3 of tephra every year for 33 years previous…
Some readers might not be convinced by my energy method of comparing eruptions but looking at it this way is as close a comparison as can be done. I think that using all the factors it also makes leilani probably the biggest eruption in hawaii in over 1000 years.
It is notable then that the caldera created this year is small and as a whole relatively little damage was caused, even the connections between the east rift and summit is unbroken. To me this seems like kilauea is set to return to previous behavior as soon as enough pressure exists to break open a dike to the surface again (probably not as much as might be expected, and likely within the next year) and after erupting like this for a time repeat what it did last year in another part of the LERZ maybe 10-20 years from now. With all that I know maybe I really should write an actual article about kilauea, maybe when HVO is able to function properly again…
Stromboli is highly active but not very produvtive
This volcano makes a few tons of materials every day.
Mostly lapilli and scoria and large spatter pieces.
Its very much like startup phase of Leilani eruption
I agree to most of your review. But. We must never confuse (political) consensus with facts. Science is theories. Untill properly observed. And repeated.
With the immense lack of understanding in so many fields of science we are left with guesstimating and trailing/failing in so many areas. In great part because we (as mentioned in medicine) don’t focus enough on underlying cause/effect and mechanisms.
We come closer every year we reserarch and stay curious, but to confuse this with “final knowledge” is dangerous. Because we are nowhere close.
No-one today can say what triggers volcanoes exactly WHEN. Or how much. Yes we have better understanding of build-up mechanisms, but no-one can produce the list of volcanic outbreaks for the decade (or millennium) to come with precise timing of place, date and time.
That must be the goal. What are the exact internal/external mechanisms behind? When and where will the next volcanic eruptions strike. And forget “forecasts” or advises. The EXACT knowledge telling us this.
So. Let’s face it. We are barely scratching the surface of what we NEED to know. Making all the potential factors of getting it wrong way too many. Decerting science that MIGHT tell us something of one potential mechanism behind volcanic activity I would concider bad. Untill disproved or proved. And beeing in the third weakest SC since 1755 the coming years will certainly be interresting in respect to this theory (that you actually spend time on in relations to science/unscientific) here. The 95% knowledge/incidence level is highly disputed. And misused. The period 1979-2019 makes an “certain” timeinterval reguarding seaice, but 100’s of years of recorded volcanic activity (showing a distinct pattern) does not…. Would you believe it?
Only my thoughts on this subject. On global climate we are on our way towards +0,00 deg.C. anomality from NCEP/NCAR 1981-2010 reanalysis, making 2019 cooler than many of the years in the 1990’s. Not making up “climate” but showing a consistant downwards trend since oct. 2015. No more interresting than “the 90’s”, but still.
(lacking data since partial shutdown): https://s3-us-west-1.amazonaws.com/www.moyhu.org/data/freq/ncep.html
Clarification: The downwards trend in global temperature relates to same month following year. With oct. 16 being cooler than oct. 15 and so on. On y/y the same trend is in place since 2015.
I think you are misreading the data. 2018 was a LOT warmer than any year in 1990’s. Below is the most recent plot. I am wondering whether you missed the change in the baseline. 1990’s temperature anomalies were quoted against the 1950-1980 baseline. Current anomalies are against the 1980-2010 baseline which was a lot warmer. And the data you link to shows that we are currently well above even that baseline.
I state 1981-2010. No misunderstanding there. Look at single-year actual global temperature anomalities UAH. With same baseline. 1998 was way warmer than 2018 UAH. Still stating 2018 was the 6. warmest in the satellite-records. No doubt from me whether the planet has warmed. I simply state there is an ongoing cooling-trend still continuing from the stated top oct. 2015 (same month year/same month year). If 2019 becomes the 9. or 10. warmest the trend is still in place. 😉
This development from 2015 is also seen JMA, GISS, NOAA, Hadley. And different baselines will not change a temperature from falling or rising (trend). The total change from baseline will be the only difference (different baseline, different anomaly). I think this trend will continue. But I acknowledge that that is my opinion based on the data I research.
You are comparing the current conditions to a recent el-nino year. Of course you are going to see the effect of that. But even so, we are now considerably warmer than any year in the 1990’s.
But let’s look at the data set you yourself link to, and use October which you pick. It lists th following anomalies:
Oct 2014 +0.281C
Oct 2015 +0.567C
Oct 2016 +0.419C
Oct 2017 +0.372C
Oct 2018 +0.298C
You start from 2015 which was warm due to El Nino. Start from 2014, and every year since has been warmer than it. Warming is going at a rate of some 0.1C per decade, so both of these are dominated by normal month-on-month fluctuations. You can always pick a few years where the line goes down, if you take the right starting point. That is the point about hand-picked data made in the post. You picked October because Oct 2015 was the peak of the El Nino effect. If you had taken August, the line would have looked very different.
And note that all numbers are positive. Even compared to 1980-2010, we have warmed considerably.
And your claim that the 1990’s were as warm as now is based on a misunderstanding. Apart from 1998, every year since 2000 has been warmer than every year in the 1990’s. And every year since 2013 has been warmer than 1998 as well. And that includes 2018.
I know exactly what I picked. But please test it for every following month from oct. 15. (nov-nov. aso.) and you will see what i see. I am not stating anything else than that the trend started at that point. I am not stating “this is the end of global warming” either. I simply have expected this and I expect it to continue for some time (2-4 years).
For a good comparative graph go to Moyhu and scroll down to see the development. from 2015/16.
Third and fourth from top: https://moyhu.blogspot.com/p/latest-ice-and-temperature-data.html#L1
As for 1998 I used the satellite based and well known UAH6.LT. Most other groundbased measurements have 1998 above 2018 in overall temperature. I know this. But it is still a fact that the 1990’s (focusing mainly on 1998) had periods with warmer weather than in 2018. I even know I’m streching this, but still a fact monthly/seasonally.(One can search JMA (or other) timeseries, go monthly or seasonally and compare all years).
https://ds.data.jma.go.jp/tcc/tcc/products/gwp/temp/ann_wld.html
Winter(DJF) and summer(JJA) were actually warmer in 1998 (JMA). The full year came out slightly cooler than 2018 (JMA). So, yes, I should have been more specific.
As for right now, I would say (based on GFS so far into jan. 2019) that we are certainly lower right now than in Jan. 1998. As we were in years exept jan. 2018, 2017, 2016, 2015 and 2000 since 1998. (JMA).
Don’t get me wrong here, I know these dataseries well, but since global temperatures are up and down within the overall long-term development I stressed that as of from oct. 15 it has trended downwards and continues to do so. Within the 100+ years warming period.
Do not read anything else into this. 😉
All the best from cold Norway!
I think moyu uses the lower troposphere temperatures rather than the surface temperatures. That will make a difference. The UAH6 data comes from Christie, who used to be a climate sceptic, but I don’t think his preference affected his data. After the updates to his model, he is now largely in agreement with the warming found by other scientists. He still argues that the total warming is less than in other data sets but in his 2017 paper he also finds the warming.
Global warming is an emotional subject. There is a lot of pseudoscience which fits all the pointers in the post. Christie is part of the science arguments on precisely how much warming there is (not if there is warming), where he is at one end of the range of findings. On the far side is a group who blames every extreme weather event in global warming, and that also is pseudoscience. The task for science is to show how much warming to expect, what impact on food production/tropical diseases/etc, and how much the sea level will rise. It amazes me that people take extraordinary precautions against some risks (i.e. terrorism) whilst ignoring others. Emotional responses are pot luck, and are not a good basis for decision making. We need science.
I am all for polluting less. It is just a good policy and long-term will make a lot of things less grubby.
But keeping with the actual science theme, it is still considerably cooler now than at the end of the last ice age. Greenland melted back then and that was even before there were loads of planes, trains, and automobiles and the power plants needed to make electricity for the internet to work.
….and that managed to reverse itself quite dramatically and in several successive episodes before that without any help whatsoever from humans.
In fact,for most of the past 2 million years, the earth looked much more like this….
The actual science is that we are one significant VEI 7 eruption (and stratospheric SO2 loading) from a potentially disastrous cooling and disruption to the global economy on a scale that modern humans have yet experienced. VEI 7’s occur on average of 1 -2 times per thousand years.
Part of what you say is correct. The temperature plot you show is I think the one from the Antarctica ice core, but with the temperature scale changed (the original shows relative temperatures, not what is shown here. But the relative scale is correct). Note that the plot does not show the current warming which is not yet in the ice cores. So the recent uptick is not shown. As this is polar temperatures, the increase is much more than the 1C globally and would take the plot to closer to the peak 100,000 years ago. We are higher now than at the end of last ice ago, by the way, but still below the peak at the start of the previous interglacial which I think is what you meant. As for CO2, we were higher than it is now 3 million years ago.
But now consider three things. First, we are not in equilibrium now. If nothing happened, we would still get warmer for some time. Second, if we get similar temperatures to 100,000 years ago, we can expect a similar sea level. And that was 5-9 meters higher than it is now. Are you ready for that? We ourselves will be ok (most of us, at least) but our children will suffer badly. Third, if we get back to conditions 3 million years ago, sea level would go much higher still.
The higher temperature at the start of an interglacial is due to the Milankovitch cycle. It is well understood. During an interglacial, temperature slowly drop until the onset of a new ice age. We were getting quite close to that. A bit higher CO2 was not a bad thing: I am not advocating a return to the climate of the 1800’s. But now would be a good time to stop. In my opinion.
Your last point is partly true. A VEI7 would cool us by perhaps 0.5C and takes us back to climate of the 1970’s. It would not put us back into a cold climate: we have had too much warming for that. But there would be a worldwide impact other than climate – for instance, the reduced sunlight could reduce crop yields worldwide. We have been concerned about the impact a large eruption could have. A VEI-7 occurs on average once every 300 years, so you are underestimating the risk.
Certainly not meaning to discount the CO2 loading issue.In the history of history there has never been anything remotely on the scale of what China is now producing annually. I completely agree that, ideally, it needs to slow down. For that to happen, however, there needs to be a viable cheap alternative for China (and India) to reverse the tide. Unfortunately, I also have no idea what that energy source might be. LNG is probably the best bet.
5-9 meters higher sea levels would indeed displace a lot of communities but, from above, I just wanted to also include the volcanic cooling topic to this thread. And regarding the potential impact, it all depends on the latitude of the VEI7 stratospheric SO2 loading. Tropical probably gets to your 0.5C “global” cooing. Farther north and the same loading impact to the NH could be much more dramatic. Plus, as you noted, the cooling will happen suddenly.
As a bonus, the additional snow and ice might even trap some of the CO2 …at least in the short term.
The real CO2 imbalance started about the time that China, and to a lesser extent, India began to seriously industrialize. China in particular is fueled by massive amounts of cheap coal.
The pseudoscience part of the climate discussion is not recognizing that China is, by far, the biggest problem and that there will not be a meaningful decline until an alternative energy source can be implemented there.
The US and Europe have actually already been declining in overall CO2 emissions for a while.
Yes, can’t sort the problem without China. The air pollution in China is terrible (I know from experience) and they do have reason to do something about it. But make the same plot using the per capita emissions, and China isn’t even in the top 20 (at least in 2015). (It is slightly ahead of the UK.) The worst emitter is Qatar, by quite a large factor. (Not sure why – perhaps the capita is wrong.) Australia is the worst ‘western’ country, followed by the US. Look at this another way, and the US should be able to half its emissions without making any changes to its life style. Australia could do better than that.
As an Australian I can say that our government is basically ignoring the public and are trying to use more fossil fuels and sell overseas, I live in the only state which usnt fossil fuel dependent which is convenient,
I dont really know how this actually works but our conservative party calls themselves the ‘liberal party’…
Soon Albert when Im 70
Co2 will be back in early miocene eras levels
https://xkcd.com/1732/
oh, sorry for teh bare link, that’s a temperature timeline that I think is worth looking at if you have trouble describing the issues with the rate of climate change 🙂
That is pretty funny.
Not sure the part about the warming was initiated by “changes in the earths orbit” passes the full “facts” test, but overall that is a very clever presentation.
That is actually what governs the ice ages, and it passes that ‘fact check’.
https://www.volcanocafe.org/ice-age/
I get the argument, but am just am in a different camp on the overall direct causation.
There has obviously been a lot of effort put into trying to identify correlations between global climate and things like orbital eccentricity and solar/sunspot cycles. The problem is that there are also obvious exceptions to each of these patterns that should not be possible if any one of these factors is the primary driver.
For example, even this chart downplays the significance of the nearly 2000 year Younger Dryas cooling which, to me, should not have been possible if the sun had already been cooking things for 10,000 years primarily due to the position of earth’s orbit.
It is clearly possible/probable that orbital eccentricity and solar/sunspot cycles impact temperatures at the margins. I just do not think those impacts can compete with the direct and immediate impact from volcanic activity. The Zelinski GISP2 Greenland ice core data shows that there is a much more direct correlation between significant cooling periods and volcanic SO4.
It is still a very clever chart.
I am not sure what you mean. The correlation between the Milankovitch cycle and the ice age cycle is very good. But if you try to explain an event lasting only 1000 years with a cycle lasting 40,000 years, you are flogging a dead horse (or whatever the right expression is). Same when comparing it with a volcanic event lasting 10 years. Horses for courses. And the Milankovitch cycle is not ‘at the margins’.
The Earth’s current climate is amazingly unstable. That is newish: the climate was much more stable against this cycle a million years ago. That already tells you that much of the instability has to with ice/snow cover, which did not exist before.
From that graph, it appears that the there are multiple instances where predicted increases in solar irradiance helped move the planet out of icy periods and also instances of decreased solar irradiance that alligned with cooler periods. There are, however, also significant departures in the trends of the two graphs.
So I think I agree that the ice and snow cover things (aka Ice ages) have probably been the leading cause of the instability and departure from this trend. The Ice Ages are relatively new to the planet and did not exist on this scale before. I think going back a little farther to the Calabrian period is the place to start but, either way, the point is made and it is a speck on top of a speck on the geologic timescale.
At this point, I am just questioning whether the decreased solar irradiance in the cycle actually caused the recent Ice Ages or whether it was more that there were periods where increases in solar irradiance actually helped to break out of Ice Ages that were primarily cased by volcanic activity.
That is an interesting question. There have been series of ice ages before. One was 600 million years ago. And in at least two cases the glaciers reached the equator: snowball Earth. And there have been times of intense volcanic activity, for instance the Siberian traps. But the two dd not coincide. Quite the opposite in fact: the volcanic episodes led to strong warming. Extreme (lethal) warming so in the case of the Siberian traps.
I do have a theory about the source. I believe you, AZ, have reviewed a very early draft of the theory. The overall theme of the analysis has not changed but, since last fall, the actual write-up has been significantly refined. Unfortunately, it is still not yet ready for public consumption, if ever.
I am also getting input on the idea from a volcanologist whose name you would instantly recognize so I will not post it here.
Here is the latest monthly temp anomalies from multiple datasets as plotted at https://moyhu.blogspot.com/p/latest-ice-and-temperature-data.html – you can play about with the settings at the link.
Anomaly base years 1994-2013
All it shows is an expected drop back after a large El Nino event followed by La Nina. Current pacific temps are above the El Nino threshold and if the event continues then global monthly temperatures are likely to start picking up again but they usually lag some months behind.
As can be seen after previous temporary drops, global warming continues.
Sorry anomaly base years on that plot were 1981-2010.
Concerned.
Long time lerker Seldom Poster. However in the last number of weeks i have noticed a higher level of posts from individuals promoting poorly thought out, poorly researched or just plain false or deliberately incorrect theories/thoughts & information. Without knowning the individuals personally it is my view that their actions are an effort to produce ‘flaming’, merely to garner more attention for them selves. While i am not a fan of censoring, i do think come comments need to go into a holding place ‘dragons dungeon’, then reviewed and if found to meet a quality standard then allowed to be moved to the blog. While appreciate that our moderators would experience a higher workload perhaps this measure is now needed.
Yours in Science
Richie
You have my support
OT: Hekla. A while ago there were a couple of posts that explained that Hekla was displaying some very unusual activity (as far as we know, because current measuring equipment is much more sensitive than we used to have). Any updates on Hekla? Is it still acting weird or did it peter out?
Fairly sure it’s just puttering along as normal atm
(IMO)
Monday
21.01.2019 22:09:37 63.990 -19.684 1.1 km 0.3 99.0 0.8 km WSW of Hekla
Monday
21.01.2019 21:52:17 63.993 -19.691 1.2 km 1.3 99.0 1.1 km W of Hekla
Monday
21.01.2019 21:39:42 63.998 -19.671 5.2 km 1.2 99.0 0.7 km NNW of Hekla
And one more. And these are very close to the summit. It is a bit restless.
Oh, yeah…
Disclaimer: I trained and worked as a Scientist, spent a lot of time doing calibrations and wrangling robots.
I write fun SciFi and Urban Fantasy, have posted some on my DA website, but I follow the Sci news avidly, loathe the fake stuff…
My father, very clever but mostly self-taught, gradually stopped reading my Science News magazines because he literally could not keep up with the torrent of changes. He could usually relate to eg ‘Plate Tectonics’ because the lovely diagrams made sense. Sub-nuclear physics’ and Quantum Mechanics’ bizarre consequences totally threw him. D’uh, threw me, too…
For antidotes to ijits and idiocies, may I recommend…
https://rationalwiki.org/wiki/Main_Page { Care: High snark content, albeit deserved… }
http://www.badarchaeology.com/ { Care: More in sorrow than anger… }
https://scienceornot.net/science-red-flags/ { Care: Ijits’ pronouncements just keep coming… }
And that’s my thruppence-worth of links…
N
Albert: If co2 emissions dont stop
Will brittain turn Subtropical when Im 120
And over 500 ppm of co2
Maybe where are soon back in Eocene
Eoxit now!
had many “discussions / arguments” with a friend until i realized she considered “Global Warming” was a political term and i was using it as a scientific term…… she totally didn’t get ‘science’ and was frustrated that it kept ‘changing’ and our latest argument was “Don’t tell me this cold is from global warming!”………….. well yes, yes, it is. so we don’t talk anymore; about anything. Lots more peaceful around the house now. Some causes are just lost. Best!motsfo
I preferred VC at the beginning, when it mainly did volcanoes monitoring. Less propaganda and more volcanoes monitoring data. Trash article in my opinion, sorry.
Truth is not propaganda.
Are you referring to the lead article by Albert?
Sorry mjf, I was asking ScienzaObsoleta…
We are always happy to consider guest posts. If you don’t like what is provided, you can try positive action!
How do you post guest articles? I have been trying for almost 2 months.
Send a proposal, or a draft, to the email address.
I’m sure we’d all be interested to see your data if you find something is in error.
That’s science, you know.
Article from NZ on the Havre eruption in 2012. Approximately 1.2 cubic K.
https://www.stuff.co.nz/science/109964788/monster-undersea-volcano-in-kermadecs-gives-up-its-secrets
Yellowstone is pretty dead soon
slowly being blocked by the huge west moving american craton
Well depending on how active the mantle plume is having it trapped under a craton is not a good thing at all potentially… Personally I dont favor this model of future continental drift but if pangea ultima does happen and america sits still for a while before it subducts the atlantic I think some pretty scary things could happen with all that magma.
The yellowstone hotspot is much weaker than Iceland or Hawaii
Its not powerful enough to cause flood basalts if trapped under a craton.
Soure snake river plain is miniatyre plateau basalt with many flows
But the craton is very close now and dirfting west
And I wants a new siberian traps or camp event….
I wants the world to spew inside out… # volcanofanatic
I wants the Hadean Era!….
Nothing is better than Hadean
I loves Hadean… the best times ever
The original yellowstone thermal plume head have been sheared off the plume stem long ago by movements in the upper mantle
And what remains of the plume head is dying.
Today Yellowstones hot plume stem is active under the litopshere
It have burned a series of sillic calderas and basaltic flows through the west moving continetal plate
Hekla two earthquakes around M1.2. I am too tired to see what happens next.
A few earthquakes there above M2 within a couple hours could mean an eruption soon.
Wouldn’t be surprised to see an eruption I’m the weeks ahead.
We still cannot predict volcano like Hekla or Katla. But others like Grimsvotn, Eyjafjallajokull or Bardarbunga, seem to be more predictable!
Three quakes now. But they look tectonic.
They do look tectonic, but at the same time they are a bit larger than usual and at least one is a bit deeper. The ones at Hekla proper usually weigh in at <M1 and closer to the surface.
At this point I don't think an eruption is imminent, but, as we know, with Hekla that might change quickly.
Tectonic
Hekla have often long response times
It may not erupt in my lifetime
If you were born in the 90s it already has erupted in your lifetime Jesper.
Heklas last eruption happened on my 1st birthday :>
I was born 1995
It may not erupt again in your or my lifetimes.. response times can be long. The longer the hiatus is the more evolved the magmas gets
I doubt it will go back to that sequence, especially with a hotspot surge this century I think it is almost a guarantee hekla will erupt before 2050. We probably aren’t going to know until maybe a few days before ut happens though.
Thanks for good and much needed post. One may add that in the long run only models based on real science survives as data is continued to be collected. (let us see in 20years which climate model survives) However, pseudoscience makes a lot of short term damage and blurs the vision for many people.
Agung had another one of its moments. Two smaller eruptions yesterday evening, that were obscured by clouds, followed by a new strombolian event during the night.
Poor quality timelapse:
https://youtu.be/GPAQTBp7LgE
Thank you for the article, Albert. I read it with mixed feelings.
I have become very sceptical about many things past years.
I’ve worked in nature conservation more than 30 years and have seen that (I thought what were) results, are crumbling and fading faster and faster. Changing environment make ecosystems vulnerable. Species drop out. I recently moved to a rural place and a bit of winter has arrived in the low countries. It is shocking to see that the only birds that are here are few Blackbirds and some pigeons. Ecosystems are breaking down as a result of intensive food production methods.
Our human species succes is build on short term results and short term measurements lead to short term successes only. Most people do not want to act and pay for a green a speciesrich earth. They see the environment as a green wallpaper.
But we will just follow nature rules. We are with too many on the planet. Dominant species are vulnerable, and will disappear from its environment at certain stage. No exception for mankind.
Sceptical? Yes. Very. Is my opinion based on pseudoscience? Perhaps. But also on things I experienced.
I have been gathering vegetation data for research, so been lurking in that dark pool enough. Where to draw the line pseudo or not, when science much is influenced by financial supports from industries and gouverments? Even have influence on what scientific questions/results may be investigated/published and which not?
You write VC is a science blog. The subjects in the articles have become of wider range past years indeed.
I must say I am hoping for ‘a large blow’ soon, so we may return to our hobby and read about and discuss volcanoes! 🙂
There have been a few negative responses to this post, not unexpected actually. This post was written because of comments made on this blog which called something pseudoscience. Pseudoscience starts with a preconceived result, and fits the research and data to create that outcome. Counting birds and plants seems a very valid thing to do, to me. In our garden, we have also seen changes. 20 years, everything was either a sparrow or a greenfinch. We now have very few of either. Instead we had within a few minutes a group of redpolls, goldfinches, a siskin and several bullfinches. (Than the sparrowhawk grabbed one. It had clearly misunderstood the term ‘bird feeder’). Why? Hard to know. Birds come into the suburbs now when they did not used to, either because there is less food elsewhere or because they have lost some natural fear for the human environment. You may have more of of an idea than I do. We have noticed quite a decline in number of insects around.
As for topics, we depend on the interests of contributors. You may consider this an invite!
Haven’t posted for a long while, been waiting for Katla..
Proper science depends upon its proponents having read at the very least the fundamental evidence for the phenomena under study. I have a topic to offer as a article, one which I definitely no longer count as pseudoscience, although I did for most of my academic career in biology. The title is ” Only a matter of time: the UFO phenomena”.
And Iceland’s GPS array would be useful for testing the hypothesis.
Carl will be familiar with Sweden’s unexplained post-war rockets.
Peter.
That was an unexpected offer. I don’t know which tack you want to take (and professionally know something about the topic), but do email us your suggestion or draft!
On the point of trolls offering fake information and conclusions the approved method is not to reply ie don’t feed trolls. Sadly many cannot resist (see above). Excessive fake information posts should be killed by the dragons.
On the point of ‘on topic’ for the thread or the group, this was set up as a ‘cafe’ specifically to allow some banter and thus a bit of fun and personal interaction between participants and it has been spectacularly successful in this IMHO.
On the point of ecosystem changes these have definitely occurred, at least in this patch of central england. First was the arrival of a sparrowhawk (very rare then) in the 1980’s with the immediate disappearance of most of the birds finch sized and smaller (? starlings) . Then local farmers stopped rearing cattle, and the grassland went and so did the bats, owls, housemartins etc. Now we seem to have few pigeons or even rooks and one of the farmworkers said to me yesterday that he thinks its because there is nothing to eat in summer because nowadays there is almost no grassland for miles in any direction. Given the increasing spread of vegetarianism, and regulations oncoming on ammonia losses this will likely spread to areas that currently have a lot of grass. With ecosystems, and farming is definitely part of the existing ecosystem, there are commonly a lot of unexpected consequences of any changes.
I agree with you Farmeroz, farming contributes to very rich ecosystems; it did so in Europe very much. Herbrich grasslands count to the speciesrichests vegetation types. But the contributing stops when the farming becomes intensive. When I compare older data (60′) with what I can find nowadays, the loss in variety is extreme.
Most meadows around here are ‘renewed’ (weeds and grass killed by chemical controlling) in cycles less than four years. A grass specialist seller advertises that renewal costs (killing and sowing) of a productive meadow vegetation easily can be recovered within two years. In such renewed meadow vegetation are growing three grass species and some harmless annuals.To mow one lot seven times a year (average weather) is no exception.
In the years 1989 – 2016 German entomologists caught at 63 spots insects in a standardized way. The outcome, presented in a scientific piece, was that the total caught weight/year had lessened about 75%.
So lack of food for birds indeed.
An educating (with lots of humor!) book about bumblebees (and other insects) and its changing habitat is written by Dave Goulson: A Sting In The Tale.
Goulson is the founder of the UK’s Bumblebee Conservation Trust.
“Dust” by Charles Pellegrino is seeming more and more relevant with every passing day.
That is not a calming thought.
Silent Spring got there first. And insects did have a part in the Permian extinction which -unusually- got them as well. And that was caused by a volcano. I gave my opinion in https://www.volcanocafe.org/echoes-from-a-silent-spring/
There is a problem with the most productive grass species, ryegrass. This is selectively grazed by leather jackets (crane fly/daddy longlegs larvae) allowing other species in (even in intensive swards). Equilibrium occurs at about 10-20% ryegrass. This is why swards are resown and as you note, new grassland is not initially biodiverse (arthropod-wise). The local farmer sprayed insecticide in late autumn, when most arthropods are inactive but leatherjackets are feeding and reduced the numbers so kept one sward productive for over 50 years (there are other advantages to permanent pasture as well as biodiversity). Note that this spray reduced numbers, but did not eradicate.
It would be totally unusual to mow UK grassland more then three times. 50-70% of the production comes in first cut in May, second cut end june is about half that and third cut in August often fails. Typically a cattle farm will cut 70% for first cut, 30% for second cut and grab a third if conditions are favourable. This reflects the reduced grass growth and higher grazing requirements.
Certainly spraying for broad leaved weeds is common, they are hugely unproductive and many are proscribed weeds (thistles, ragwort etc) so spraying is essential.
Farming is by definition the act of removing weed species and replacing them with a monoculture of farmed species ever since man started to weed (dawn of agriculture?).
Interesting – sounds like you have hands-on experience.
I’ve (ended up) a landscaper/gardener (went into the arts, instead of biology, only because my English teacher said that you could change the world by changing people’s minds…) . I’ve always loved looking after and creating lawns, and am getting seriously nerdy about the seed, the feeds, the herbicides…
Was horrified to discover, recently, that 2,4 D is a known bumblebee killer. There are three or four broadleaf herbicides available in lawn treatments anybody can buy from the garden center and even supermarket. Out of all of them, 2,4D is both persistent and straight-up toxic.
I’ve seen a real drop in numbers of insects in gardens over the years. I see ‘wildflower meadows’ being planted up with spectacular insect-attracting plants that should be crawling with life, and there’s barely a bee.
My horror is the accumulative time bomb of neonicotinoids. They don’t go away. It’s DDT for the bottom of the food chain. I dread to think what they are doing to waterways. They are just too efficient a product.
Rob, thank you so much for the recommendation of the bumblebee book. I just checked out a few reviews… looks absolutely essential
On the topic of Flora and Fauna, a Hurricane can really screw up your yard. I had a pristine St Augustine yard until a Hurricane bopped by here and gave me more crab grass than you can shake a stick at. Not to mention a few strange bugs that I hadn’t seen around here.
well i enjoyed the post as well as all the comments…. like the reminder that this was set up as a cafe. People can enjoy the conversations but we are reminded that everyone has their limits by the ruffled feathers. (“bird feeder”: hehe) Reminds me of my favorite card: Picture of Superman carrying Lois Lane on the front with the words “You’re my He-Man” and opening it reveals “He he he” i’m just so strung out lately… with the government and the earthquake and winter and trying to make dinner on one hot plate that keeps cutting out before it finishes… “Someday, my stove will come”. Need to be thankful for the positives; heat, water, and more light. (not saying sun as it is hiding behind the clouds like it always is. “Erik the Viking”) Anyway, as always, Hoping for the Best!motsfo
Perfect time to acquire some Icelandic Spar to see if that whole “Sun Stone” idea works as claimed.
don’t forget the rapid movement of the magnetic north… 😉
Kiss the Internet goodbye.
https://hotair.com/archives/2019/01/22/eu-preparing-tax-internet-existence/
Good luck with getting that to work…
I attribute it to Lawyers seeking free rent… Much like how a group of Miami Lawyers set themselves up as arbiters for Florida’s portion of the BP penalty monies despite South Florida having little to no ill effect from the Deep Water horizon thing as compared to NW Florida. The way karma rolls, that’s not gonna turn out so well for them in some future Hurricane season.
Note, this is annecdotal (in part). Your mileage may vary.
If they could tax breathing they would.
We had a deep quake under Pahala,
2019-01-23 10:08:59 3.1 37.8, after the quake we had some strong harmonics.
This was followed by 8 quakes at depth between Pahala and Loihi.
Any one want to comment on this activity?
Mac
Here are the remaining quakes,
2019-01-23 12:40:05 2.2 38.4
2019-01-23 12:27:24 1.8 2.7
2019-01-23 12:12:14 2.2 36.6
2019-01-23 12:11:31 2.1 39.4
2019-01-23 12:11:03 2.3 37.2
2019-01-23 12:09:26 2.1 38.2
2019-01-23 12:07:53 2.6 45
2019-01-23 12:06:03 2.5 35.5
2019-01-23 12:03:33 2.4 39.5
They started from the south and progressed N/NE towards Kilauea.
Looking at Google earth, the 8 quakes follow the contour of the slump off of Pahala-Naalehu, maybe a under sea slide?
Quakes are way too deep for that, this area also lacks slump/slide deposits and has relatively gentle slopes.
The first 3.1 quake happened at about 10:08 UTC and is followed by tremor lasting 30-40 min, it also seems to me as if there were some big earthquakes in between that mesh that aren’t showing in the page, yet? Then the sequence of 8 magnitude 2 quakes started at about 12:01 and lasted for 12 min with some weak tremor going on. It also seems that not long ago another small episode of earthquakes/tremor might have started?
Having been in the Pahala area I think there is good chance for these quakes being magmatic in origin but I have no clue of what this would mean. It will be interesting to watch for any changes in Pahala, Loihi or Kilauea.
Yes, new sequence just started, just showed up in the HVO page, two so far:
2019-01-23 17:43:09 2.1 44.6
2019-01-23 17:32:32 2.2 44.9
Interesting.
Graphic.
Given the direction they point I think it is pretty safe to say which volcano is receiving this magma, I think this could be ultimately part of kilaueas recent decompression drawing in magma to recharge.
Either way whatever this was, it was a very big event, you dont get signals like that from that depth very often and i dont think I have ever heard of something on that scale, I would put the number of years before kilauea erupts to well into the single digits now at maximum. I have a theory that the decreased inflation of the rift around pu’u o’o is not because of slowing supply at all, but because there is no more extra space there and rather than erupting it is easier just to fill up the lower pressure areas further uprift, and so the next eruption could really be anywhere. A big intrusion like this though is not likely going to be contained all the way to the middle rift, more likely it is going to go straight through and out the summit ring fault and then we all get to see an eruption like 1959 or larger, something like the massive high volume ring fault eruptions that the galapagos volcanoes do.
I don’t know, I think it is a bit too early to tell if Kilauea is going to get a surge or not. First we don’t know for sure if a surge of magma has left Pahala or not and neither if Loihi would be the one to get the magma instead. Now that the 3.1 quake has been relocated today’s swarm does appear to have started from the south and progressed north but there had already been some high activity from the main “head” of the Pahala Swarm 11-16 of January, so one could argue that the swarm has progressed south into the southern branch of the Pahala Swarm instead.
That is a possibility but given that historically kilauea has been getting its magma here for a while that is the most likely option. At this depth such a signal could be equivalent to a full blown large scale intrusion the quakes happened almost as far underground as the distance from HVO to fissure 8, that deep under kilauea the ambient temperature is over 1500 C so the fact earthquakes happen here at all is remarkable and this very recent event is exceptional.
These quakes are probably hundreds of times more powerful than an equivalent surface quake of the same magnitude. Either way i dont think whatever happened here will be the very next eruption on kilauea but some point in the next decade there will be a pretty large eruption there if this event has anything to do with it.
Pointing at? Obviously a random alignment. 🙂
1530 C for Kilaueas depths
1510 C for Grimsvötns depths
My guess/opinion/$1 bet is that the next event in Hawaii will be something more significant than anything that has been witnessed since Ellis arrived in 1823.
If the next event is at Kilauea, my $1 bet is that it will be something like the high volume episodes that are estimated to have occurred in the period between 1790 and 1823.
If the next event is at Mauna Loa, my $1 bet would be for something significantly bigger than anything witnessed in the modern era. It is long over due.
Either way, I agree that it will probably be a summit oriented eruption. ML has been steadily inflating for a while so, as of now, I would lean slightly towards placing my $1 bet on ML being next.
Note that the rule of the longer it sleeps the bigger the eruption will be doesn’t apply AT ALL with Hawaii. Big eruptions seem to closely follow periods of high activity or other big eruptions. Leilani 2018 of course marked the end of the Pu’u’o’o eruption which doesn’t need much introduction. The 1840 eruption and huge ERZ intrusion event followed decades of very intense summit continuous eruption.
Same goes for Mauna Loa: the 1950 eruption (0.4 km³) happened just 1 year after the previous eruption. The 1859 eruption (0.4 km³) followed the also very big eruption of 1855 (0.3 km³).
With prehistoric eruptions it is harder to tell but a good example is 1790. The fissure eruption of kilauea’s LERZ seems to have closely followed the Heiheiahulu shield formation and of course some months later the summit went off in a VEI 4 event. Activity by the way remained intense until 1840
There is no reason to think Mauna Loa will do anything different to what it usually does, the eruption will maybe have a volume of 0.1-0.2 km³ which is what the volcano tends to do. Knowing other effusive volcanoes I’d say the rule of long periods of dormancy preceding the big events is not applicable (Etna and the 15th century). Effusive volcanoes can just throw at you several big events in close succession something maybe to blame from a fluctuating supply? same doesn’t appear to be the case for subduction arc volcanoes.
Mauna loa doesnt tend to do vigorous high volume summit eruptions, those sort of eruptions happen low on the southwest rift like 1950, that is where it differs from kilauea, which can do summut eruptions as large or even larger than the average rift eruption as the 1790-1820 sequence and 1959 shows. It is also notable because until this year kilauea had not had a really big fast eruption before in recorded history, leading to the assumption mauna loa erupts bigger when it is more that it just erupts less often.
Well recorded history in hawaii also just happens to miss the pre-1840 kilauea but is right on time with mauna loa reactivating from an extended inactivity that had lasted several hundred years since probably before 1500, with eruptive intervals separated by decades, a stage it has now returned to and so likely mauna loa wont be doing all that much more in our life times, maybe 3 more eruptions at most before 2100. Also given the quake orientation I dont think mauna loa is getting any of the magma from the other days big quakes.
In terms of eruptions, i think kilauea is far from done with what it started, last years eruptions were its biggest in centuries but for all that the caldera it made is not all that much bigger than the 1840 caldera that was made by an eruption 1/5 the size. Holuhraun was only 1/3 bigger than leilani but it made a collapse of well iver twice the size. The east rift and summit are still in contact and almost appear to have been unaffected with the only loss being the shallow magma body under halemaumau and pu’u o’o being cut off. Clearly the potential is there for a collapse that dwarfs last year, and that might be what happens next, not immediately, but within the next 20 years.
I would expect mauna loas next eruption to be pretty big too, hawaii gives a different view on magma supply rate than the rest if the world. Mauna loa has about 5% of the supply kilauea has right now but kilauea has a supply rate of probably over 0.2 km3/year and so that still leaves mauna loa with about 0.01 km3/year, which is more than average worldwide. Its last eruption was 35 years ago so since then about 0.3-0.4 km3 of magma has been supplied, similar in size to 1950 and much bigger than 1984 volume. Obviously it probably wont erupt all of that but the potential for a large eruption is there, and it is likely to be on the southwest rift which makes it pretty much the worst case scenario as far as a mauna loa eruption is concerned.
It is possible that if kilauea reinflates rapidly at some point in the near future it could trigger an eruption at mauna loa, the reverse has probably happened a few times in the past and I think mauna loa is supposed to have erupted around the late 1700s which would fit with kilaueas activity at the time. Hualalai also erupted several times then too, very busy decade in hawaii 1790-1800.
In general I would expect eruptions less than 3 years apart in hawaii hor most of the foreseeable future, and some to be very big, as well as possibly a lot more activity in the LERZ and possibly abandonment of the area as modt if it ends up under lava. The topography of pu’u o’o also niw allows lava erupting in that area in the future to flow far to the north of the rift zone into areas previously out of reach, the rift had probably not grown too much since before the eruptions that created the aila’au shield, but now that seems to be changing and large structures are increasing the height if the east rift a lot over 90 meters in some places compared to before tge eruptions took place. The rift only descends 200 meters between the bottom of mauna ulu and the 1977 vents, it drops off more after that and fissure 8 is about 800 meters lower than mauna ulu.
Yes, 3rd comment on this, but I have looked at something that is apparently uniwue to kilauea. One kilaueas summit and major rift zone are disconnected, and said major rift zone has had very large scale long duration effusive eruptions in recent time but not older than about 2000 years ago. Thus is unique among all the recent hawaiian volcanoes. One thing else is that the puna ridge trends on an arc that goes north of the current east rift and better alligned with kilauea iki and the former more northern location of the powers caldera. The last eruptions of any real size on the puna ridge were probably related to the powers caldera firming and were about 2000 years ago. I think it us possible the east rift is doing these shield eruptions because of the discontinuity between it and the summit, the summit grew by a very significant degree between 1000 and 1500 AD, around 200 meters of lava flows exposed in the southwest wall of halemaumau, representing probably tens to maybe even hundreds of km3 of probably almost continuous activity over that 500 year period. The east rift before 1952 had only had 3 long duration eruptions in over 2000 years, and only kane nui o hamo, the oldest one, was very large, the smaller ones, pu’u huluhulu, heiheiahulu, and another shield buried by heiheiahulu, were in the 1 km3 range, kane nui o hamo is probably about 5-6 km3. The rift was relatively less active. However now about 2 km3 of lava erupted from mauna ulu, and 9 km3 from pu’u o’o, 9 years apart, as well as about 2 km3 from other ERZ eruptions since 1950 (2/3 of that was last year). That combined with the massive size but relatively little damage from last years eruption says to be that this phase of activity now is not so typical, and we should expect some more unexpected things to happen in the future over the 21 century, one casualty is likely to be kilaueas reputation as a safe and non violent volcano…
The thing that might be the biggest change is when the rifting within the koae faults manages to breach into the magma feeder and become an actual eruptive rift rather than a seismic rift, that could result in some very interesting and very fast changes, where geological time moves on a human timescale. As I have said before this initial eruptive activity, should it happen this way, is likely to be very powerful and not very typical of kilaueas gentle effusive eruptions, something more on the lines of etnas lava fountains – basically a plinian eruption with no ash. This activity could be dangerous, occurring in an area where eruptions are not known, and being of a type people dont expect in hawaii, even HVO has given almost no real attention to koae compared to other areas, apart from saying they expect it to become eruptive some day.
I think that Mauna Loa’s potential is frequently underestimated. In the past 1000 years more area has been covered by Mauna Loa than by Kilauea.
In the past 1000 years, it is estimated (Lockwood and Lipman 1987) that approximately 40% of the surface area has been covered.
That’s over 2,000 km^2.
In comparison, approximately 90% of the surface area of Kilauea has been covered in the past 1000 years.
That’s around 1,700 km^2.
Since 1823, neither has done all that much by historical standards, but both have terrifying potential.
Mauna loas flows are ‘bigger’ because the mountain is steep and so the lava flows very far easily, that doesnt happen on kilauea. Last years eruption was 3 times the size of 1950 and of even higher average output, but the surface area is 37 km2 vs 94 km2 for mauna loa 1950, the reason is the distance the flow had to go and the flat surfaces. Also ‘neither has done much’ after last year is now a false statement, and even ignoring that i woukd say the past 70 years at kilauea is among its most impressive eruptive sequences in millennia, it all started with one of those exact high volume ring fault eruptions in 1959 (if that was all tephra it would have been a sizable VEI 4) and then an even larger and almost as intense eruption 2 weeks later over the new year, and since then only 5 years total have not had an eruption and using tephra conversion on the volumes of kilauea eruptions per year there have been 50 VEI 4s and one large VEI 5. Also to note, mauna loa erupts about 0.2 km3 of lava on average, but its average gap between eruptions between 1840 and 1950 was 3 years, kilauea erupted at least 0.2 km3 every year of mauna ulu and pu’u o’o and erupts closer to about twice a year on average, kilauea also was still almost as active as mauna loa during the 1840 to 1950 period except during the last 30 years and maintained a large lava lake, compare to mauna loa going almost completely inactive since 1950. I have a theory that 1950 could have been so big because kilauea was inactive in the previous 16 years and most magma was diverted to mauna loa for that time.
Mauna loa is though far from underestimated, if anything it might be overestimated. People all over the internet think when it erupts it will be like the bigger version of kilaueas eruption last year but in reality if you combined all of mauna loas 20th century eruptions the volume wouldnt even double the volume of the leilani eruption, mauna loas tgreat is overestimated while kilaueas threat is seriously underestimated, mauna loa has shown its cards, kilauea has barely got started. There are also abiut 100 times more people in kilaueas danger zone vs mauna loa.
Using the best geologic map I could find I get that the extension covered by lavas of Kilauea and Mauna Loa during the last 1000 yr is very similar at about 1300 km². Consider that flows of Kilauea will tend to overlap more due to the smaller total surface of the volcano, also that the sea is closer and that limits the maximum posible subaerial extension of flows as more volume is sent into the ocean per eruption. Kilauea has also probably undergone 2 major caldera collapses (1500, 1790) during the last 1000 years and a lot of volume has gone into almost completely filling both calderas with little contribution to surface coverage of recent lavas. The output of lava during 1823-2019 stands at 0.018 km³/year for Mauna Loa and 0.067 km³ for Kilauea, so Kilauea appears to be almost 4 times more productive than his neighbour. I think the rate for Mauna Loa is representive as it hasn’t dome anything very different during the last 1500 years to what we have seen.
If we go back to around 500 AD that was the last time Mauna Loa went crazy. Through a period of ~300 years the NERZ erupted 3 massive flows (Upper Waiakea, Kukuau and Pana’ewa) the first two around 1 km³ in volume and Pana’ewa maybe about 3-6 km³. There were long lasting summit eruptions estimated to have happened between 0 and 1000 AD not very well constrained in age which covered a total surface of about 1000 km², if Pana’ewa really caused the Mokuaweoweo caldera to form then all the summit overflows should preceed 500 AD. But this won’t happen anytime soon, it is important that Kilauea and Mauna Loa influence each other, either if they share the same source or not their supply rates have an inverse relation. 1840 marked the transition from high supply of Kilauea to high supply of Mauna Loa, and then in 1950 Kilauea returned to high activity. Both transitions are quite dramatic. Since 1950 Kilauea is in a dominant phase which leaves Mauna Loa with a very low eruption frequency, the current dormancy period is of 35 years and don’t expect anything special when it wakes up. The high activity of Mauna Loa around and before 500 AD probably was simultaneous with Kilauea going into long periods of dormancy, it is hard to get this confirmed but I certainly do not recall Kilauea doing anything from about 200 BC to 600 AD appart from some small explosive events probably shortly after 200 BC.
In terms of how much risk do they pose, all Hualalai, Mauna Loa and Kilauea are threatening populated areas and have a high enough eruption frequency to be worried about and of course have them monitored. The damage an eruption will do sometimes depends on “luck” a vent opening 100 m farther downrift can make a big difference and a highway up the slope can redirect a lava flow right into your town. But my personal opinion is that by the end of this century Kilauea will have done far more damage than the other two, Mauna Loa may even miss all populated areas, Hualalai might not erupt at all, but Kilauea is currently inflating far down the ERZ threatening a handfull of towns and the caldera given the state it is in if it goes through another collapse we get a crater lake, we know what comes with that. Kilauea is well monitored so any these events will hopefully go without losing any human lifes, but Pahoa or Leilani Estates cannot be moved somewhere else.
I think one thing us also being overlooked here too, the thickness of the flows. Both volcanoes produce a’a fllws about the same thickness on average, but pahoehoe flows on mauna loa are never very thick compared to kilauea. Based on the fact it buried the 30 meter tall cone of pu’u kahualea, the 2014-16 flow on pu’u o’o was at least that thick. Mauna loa flows are rarely compound and dont build large lava shields either.
Really the only reason at all that mauna loa even looks comparable to kilauea us because of when historical time happened coinciding with mauna loa reactivating. There is a reason pele lives in kilauea, and it is because kilauea was far more active and also a lot more violebt than mauna loa. These legends likely recall events in 1790 but the pele hi’iaka lrgebd probably describes an eruption like last years event that created the existing wider caldera, and even older legends probably describe the summit overflows and even the powerful explosive activity that occurred in the powers caldera prior to that, back when kilauea was a very different looking volcano. With the recent exception of the first one we have not seen any of this behavior before but likely the next 10 years will give an indication of which one is more likely to happen next. If the summit fills rapidly then overflows may dominate the future, if the rift keeps erupting then any summit eruptions are likely to be much more brief and powerful lava fountaining events that generate a lot of tephra, and coukd become violent plinian eruptions if the caldera collapses further in future events. After this year and how little damage even an eruption that big managed to do, I wouldn’t put it beyond possibility for kilauea to do something significantly bigger than this year even, if an eruption can occur just beyond cape kumukahi then it will be 500 meters lower down than any other eruption before and could drain an enormous amount of magma. It is also pretty plausible the next LERZ eruption will be downrift of last years eruption, like 1960 was to 1955. All of this will probably happen in the next decades, certainly at least a few times before the end if this century, while the rift between heiheiahulu and mauna ulu is likely to see significant eruptions every year just about with one of them eventually becoming long term like pu’u o’o was. Halemaumau is likely to see some large lava fountaining events like 1959 or the 1790 period. It also could develope a long lived vent.
True, the legends of Kahavari, Tamapua, Pele-Hiiaka all seem to refer to volcanic events happening in Kilauea. I have only once seen a possible small reference to a Mauna Loa eruption, if I remember correctly Namaka killed Pele or at least its physical body but then its flaming spirit reappeared in the sky above the summits of Mauna Kea and Mauna Loa. Native hawaiians were much more worried about Kilauea than Mauna Loa when William Ellis visited in 1823, they described or mentioned a couple of eruptions from Kilauea but I don’t recall any mention to any from Mauna Loa.
Kilauea is also over the hotspots inner plume stem that feeds Kilauea and Mauna Loa thats a cylinder pillar of heat thats makes crust under the interior of Big Island and its eastern coast completely molten.. deep 1530 C partial melting pool.
The plume head is much larger and goes outside Loihi and way outside puna ridge. The plume head is almost 700 km across and goes almost to Kauai
The plume swell is even larger.
Iceland plume head is enromous too IF this data is correct
thats almost 1000 km across or more
http://hraun.vedur.is/ja/skyrslur/hotspot/node3.html
Link is a map of the the current Iceland plume.
If this is true its one of the largest plumes on Earth.
But Hawaiis deep sea plume is likley larger and hotter
Last 6 hours
I think you folks are getting way out over your skis on this one. Just some stuff moving around down there. Something under 10 k depth and the ears pop up.
When an earthquake happens under an active volcano in rock that is over 1500 C, it is significant… this is basically like trying to make honey act as a solid and snap, the forces required to do that are enormous and way more than trying to get a solid reaction out if something that is actually solid…
These quakes are probably as energetically equivalent as 1000 equivalent surface quakes of the same magnitude, which is why they showed up as being significantly bigger on the seismometer despite being much further from the meter than a lot if shallower quakes. The location and strength of these quakes are idicating this is magma moving into kilauea which is important if you consider its serial VEI 4+ character after going caldera in past instances…
Don’t underestimate Mauna Loa. It endangers far more people than Kilauea does (Hilo is build on its flows) and acts fast. Lava can get into inhabited areas within hours. It pulls its weight. Being so much bigger, time scales are slower than for Kilauea. Whereas Kilauea has cycles of perhaps a few hundred year (governed, I think, by tectonic movement), Mauna Loa takes its time and may have cycles of thousand of years or much longer (how can we know for sure?). The summit crater is huge but not deep. This suggest to me that it has largely recovered from the last big eruption (1500 years ago). In another thousand years the summit will be a cone again. Until then, expect rift eruptions but in fairly unpredictable locations. It tends to start at the summit but quickly migrate – either way. that is one reason why Hilo needs to be cautious.
Mauna Loas caldera have pretty much filled up by lava flows
There are lava flows but there is another effect at play. A caldera forms by removal of magma below the summit. When the reservoir refills, the bottom of the caldera is pushed up again. And the caldera begins to disappear. The depth of the caldera tells you about the magma level below it.
The 1880-81 eruption of Mauna Loa entered the current boundaries of Hilo but no other flow has reached the area of the town since the eruptions of Kukuau and Pana’ewa in about 500 AD. Mauna Loa is also not going to suddenly throw a massive flow from one of the rifts, Pana’ewa seems to have followed huge long-lasting summit eruptions which completely overflowed the previous caldera and are comparable in size to the overflows from Kilauea, activity seems to gradually escalate before the big event.
The other major concern is Hawaiian Ocean View and that one should be a little more worrying. It sits right on top of the SWRZ, two historic eruptions, 1887 and 1907 would have hit it had it been there. Other 4 major flows that are poorly constrained in age but bracketed between approximately 750-1500 years BP would have also affected the town. I however think that once past the bend of the SWRZ intrusions have it very hard to reach there. The 1887 and 1907 eruptions may have only reached so far down to Ocean View because they reused the dike of the 1868 eruption which almost reached the shore. I think that now that Mauna Loa is in a low activity period activity in the SWRZ will most likely be restricted to the portion opened by the 1950 eruption, this is completely speculative though, as the prehistoric record is not accurate enough to confirm this.
I think ocenic island rift zones are pressure driven not tectonic, both models are still there but I would say the pressure rift fits much better observations. Most large flank displacement events of Kilauea and Mauna Loa happen when the volcanic system is overpressurized and sometimes when an intrusion is already underway.
Those links were helpful, Thanks.
Now I can add a name and some more info to the Hilo flow discussion.
Pana‘ewa picrite flow—Widespread, vesicular, olivine- and plagioclase-rich ‘a‘ä and pähoehoe ….. Lava erupted from a
cinder cone at 6,020-ft elev. …..covers 173 sq km
and forms coastline from Hä‘ena (Shipman’s Estate) to Bayfront (Hilo Bay). Age, 1,470±50 radiocarbon yr B.P.
By contrast, the most recent KL eruption in 2018 covered just over 35 sq km.
The lava that formed the Pana‘ewa picrite flow would probably have have been from at least a 2-4 cubic km eruption (not even counting the amount that would have disappeared into the ocean).
My overall point was not necessarily to start a team KL vs Team ML debate but more to make a point out that either (or both) is easily capable of a MUCH higher volume of activity in a single eruption than anything witnessed by eithersince1823. …and that it just appears that ML has done so on that scale more recently than ML.
My $1 bet was that ML is the most likely to be next in line for something on this scale, but I am personally only willing to risk $1 or that guess.
Comparing surface area is not a very good way to compare eruption volume between the two volcanoes. Panaewa started from a vent higher than kilaueas summit and far from the ocean while fissure 8 is at 200 meter elevation and much closer to the shore so of course it will end up with a way bigger area. It was still a bigger eruption but not for that reason. Mauna loas flows are way bigger because they can flow a lot further because mauna loa is a way bigger volcano.
Also I actually dont think mauna loa is capable of more than another 1950, which is probably its limit right now, its supply is way too low it would need to be dormant for over 200 years to have an eruption as big as leilani. Mauna loa might have been a volcanic powerhouse like what you are talking about during its shield building stage but that is basically over now and over the next millennia it will start to become less active while kilauea does the opposite. Already there is a clear domination by kilauea looking at the past 2000 years and with kilauea doing what it did last year and not crippling itself I think this is where to focus on. Mauna loa will do its next eruption, likely a pretty standard eruption on the SWRZ about 0.2 km3, then be out if the picture for decades again. In that time kilauea will have easily recovered from last year and probably had at least one other large LERZ eruption by 2050 and most likely a few major summit eruption and another long lived shield. This year shows that for whatever reason the main plumbing must be deeper than in earlier collapses so unlike 1500 or 1790 it isnt destroyed during a caldera event, that means these big eruptive phases of a shield followed by a LERZ eruption may well keep repeating until kilauea eventually does its own version of panaewa at much lower elevation 500 meters underwater and maybe eventually creates an island on the puna ridge about 5 km off cape kumukahi. This ERZ eruptive episode already is way bigger than any of the recent previous events so some things are probably within the realm of possibility that normally wouldnt be considered.
Agree.
I love Kilauea and certainly it is a perfectly capable volcano. In the next 50,000 years, it may even eventually catch up with its brothers and sisters to the northeast but, historically, the other Hawaii volcanoes (and especially Manual Loa) are simply on an entirely different scale. Even in the relatively unimpressive (by ML standards) period since 1840, Mauna Loa has still easily outpaced Kilauea.
Of course, Kilauea has caught up a bit more recently, but ML could easily up its own pace again with almost no warning.
Adding to the point made above, the map below shows all of the overlapping flows including the one Hilo is sitting on which is likely only around 1500 years ago. Just the one eruption that created the land under Hilo and the delta that forms Hilo Bay (30 to 80 meters thick above sea level) would have been easily MANY times larger than the recent 2018 eruption in Leilani Estates.
Does anyone know of a paper that studies the ML activity 1500 years ago?
Since 1990 kilauea has FAR exceeded the number on that graph and the number on tgat graph is too low anyway, between 1952 and 1990 kilauea had erupted about 3 km3 of lava and now that number is closer to 12 km3, mauna loa between 1840 and 1950 erupted about 5 km3 of lava. And no mauna loa wont suddenly take over the hotspot again with no warning there would be years of steady obvious inflation and a visible decrease in the yearly eruption rate of kilauea before this happened. It might seem like this is exactly what has happened with the gps showing upward movement but 0.5 mm in half a year is nothing to get exited over, it would ve drowned out by the day-night temperature variations if it was closer to sea level since 1984 kilauea has also significantly increased its activity. In the past 2000 years it has been 80% kilauea vs 20% mauna loa, and the fact that even an eruption bigger than anyone thought was even possible on kilauea did little more than drain out a shallow magma pocket and leave the entire main plumbing still completely intact is pretty good evidence that kilauea is a much more powerful volcano than previously thought. Last year wasnt the terminator event, it was simply a way bigger version of 1960. The real terminator will include collapses along the upper ERZ as well as wide scale caldera subsidence and will likely be followed by massive summit eruptions as the magma chamber is no longer there and the supply has nowhere to go except straight out. As i have pointed out many times, well recorded history in hawaii basically coincides with mauna loa reawakening from a dormancy that could have been a lot longer than the one now, and so it erupted frequently and that combined with its massive size lead to premature assumptions. There are few mentions of any mauna loa eruptions in traditional stories, but many of kilauea, including one talking about events over 1000 years ago and just after the supposed massive eruptive episode of mauna loa before 600 AD, which appears to not be well remembered. Also both pele and aila’au have association to kilauea and not mauna loa. Obviously in the 2000 years people had lived in hawaii they would have seen both volcanoes erupt almost countless times (and also hualalai and east maui too) but in all this they put the home of their volcano deity not at the towering summit of the biggest volcano on earth but in its relatively smaller neighbor, which says enough to me.
Mauna loa probably erupts faster on average because the height difference between a flank vent and the summit is way more than on kilauea, fissure 8 was 800 meters lower than the level of the overlook lava lake, while the main vent of 1950 was over 2 km below the 1949 summit vents, and even still fissure 8 has a higher average effusion rate (0.4 km3 in 1 month vs 1 km3 in 2 months) and probably a comparable maximum, one of the surges in July included overflows all around the cone and a dome fountain as tall as the cone – at that point 70 meters above the pre-eruption terrain. No in depth look into that event was done but the eruption rate was likely going at 400-500 m3/s.
I see some strange things in that graph, well first if they had no idea of how much volume was erupted in Kilauea before 1930 they should have just started from that year. Also the jump in volume of the 1950 eruption of Mauna Loa shows as the biggest one while the eruptions of 1859 and 1872 were more voluminous, the 1880 eruption was also absolutely huge but the number on it is always for some reason that escapes my understanding around 0.1 km³.
Between 1823 and 1840 Kilauea erupted a little more than 4 km³ estimated from the filling of the caldera observed. From 1823 to now Mauna Loa has erupted about the same, around 4.1 km³. That means Kilauea’s graph of cumulative volume has always stayed above the one of Mauna Loa during the modern period. For Mauna Loa it has taken the whole historic period to match the volume Kilauea erupted in less than 20 years.
It is true that generally Mauna Loa does bigger short-lasting eruptions and no recent fast-emplaced flow of Kilauea is known to come close to Pana’ewa (the flow of the Hilo Delta).
I think that hawaiians are estimated to have arrived to the Big Island around 1000 yr ago or later. They missed all the events of the Kulanaokuaiki eruptions of Kilauea, probably Kane Nui O Hamo too. They arrived when the summit was overflowing into the south flank and shortly after must have seen the Aila’au overflows into the north flank. They probably saw some sizeable eruptions of Mauna Loa but they probably mostly forgot with all the action going on at Kilauea, summit overflows, summit explosive eruptions and Puna flank eruptions.
There are less publications on the eruptive history of Mauna Loa than of Kilauea, and none are centered on the activity around 1500 yrs ago, But there is this on the NERZ:
https://pubs.er.usgs.gov/publication/sim2932A
https://pubs.usgs.gov/sim/2932/a/sim2932a_pamphlet.pdf
And this on the SWRZ:
https://ngmdb.usgs.gov/Prodesc/proddesc_9152.htm
Hawaii was apparently discovered 3 times, the first by a people that were polynesian but little is known about them, then by the second wave which were the people encountered by the europeans about 600 years later (3rd wave).
The first wave was a bit over 2000 years ago. They were displaced by the later people but likely influenced some things and could be who invented the original versions of some stories which were adopted by the later generations. I don’t really know though.
Manam seems to be acting up again;
Manam Volcano Volcanic Ash Advisory: CONTINUOUS VA TO FL500 MOV W OBS VA DTG: 23/1330Z to 50000 ft (15200 m)
Wednesday Jan 23, 2019 13:30 PM | BY: VN
Explosive activity continues. Volcanic Ash Advisory Center (VAAC) Darwin warned about a volcanic ash plume that rose up to estimated 50000 ft (15200 m) altitude or flight level 500 .
The full report is as follows:
FVAU03 at 13:25 UTC, 23/01/19 from ADRM
VA ADVISORY
DTG: 20190123/1330Z
VAAC: DARWIN
VOLCANO: MANAM 251020
PSN: S0405 E14502
AREA: PAPUA NEW GUINEA
SUMMIT ELEV: 1807M
ADVISORY NR: 2019/24
INFO SOURCE: HIMAWARI-8, RVO
AVIATION COLOUR CODE: RED
ERUPTION DETAILS: CONTINUOUS VA TO FL500 MOV W
OBS VA DTG: 23/1330Z
OBS VA CLD: SFC/FL500 S0418 E14453 – S0412 E14517 – S0357
E14517 – S0340 E14458 – S0341 E14317 – S0416 E14321 MOV W
25KT
FCST VA CLD +6 HR: 23/1930Z SFC/FL500 S0415 E14510 – S0447
E14144 – S0208 E14204 – S0325 E14505 – S0402 E14517
FCST VA CLD +12 HR: 24/0130Z SFC/FL500 S0414 E14514 – S0400
E14517 – S0311 E14504 – S0119 E14047 – S0509 E14033
FCST VA CLD +18 HR: 24/0730Z SFC/FL500 S0414 E14513 – S0509
E14033 – S0120 E14048 – S0312 E14504 – S0359 E14516
RMK: VA TO FL200 NO LONGER DISCERNIBLE ON SAT IMAGERY.
CONTINUOUS VA TO FL500 MOV W IDENTIFIABLE ON 23/1300Z RGB
IMAGERY. HEIGHT/FORECAST BASED ON HIMAWARI-8 AND MODEL
GUIDANCE.
NXT ADVISORY: NO LATER THAN 20190123/1630Z
https://www.volcanodiscovery.com/manam/news/74004/Manam-Volcano-Volcanic-Ash-Advisory-CONTINUOUS-VA-TO-FL500-MOV-W-OBS-VA-DTG-231330Z-to-50000-ft-1520.html
Unless it has been opened to the sea, this one is pure eruption driven.
On the ‘S vs PS’ issue, and the hope that more data and time will resolve stuff, I’ve just been taken ‘hard a-back’ by an, um, unfortunate comment on PhysOrg.
https://phys.org/news/2019-01-debunking-solar-cyclenorth-atlantic-winter-weather.html
I’ve no argument with that. YMMV
For his tangential take on ice ages etc, @MS referenced a Harper’s Magazine article from 1958 which, incidentally, proposed a north polar shift to/from mid-Pacific…
At least I now know the ‘Authoritative’ source for most of the ‘Rapid Crust Shift’ woo’sters !!
But then they end the paper with
The current solar minimum will be providing more data and, if we do enter a new Grand Minimum, we can watch in real time.
Funny that. From an article a few months ago that stated ‘dogs like to poop aligned with north’ idea, Yesterday I noted that my Pekinese and Pekinese/Chihuahua mix were pooping at the same time. One pointed west and the other pointed North by Northwest. They were about 20 feet apart and not being interfered with by the big dog, who was over trying to molest a squirrel on the other side of the property.
Both dogs are about the same size, in fact the mix is the son of the other.
Planetary K-index
Now: Kp= 3 quiet (as it was yesterday)
Amazing you would notice such a thing
I know. That’s something one sort of expects from him. 🙂
Well, I have to follow them around when they are out doing their thing. The Pekinese, if left unattended, will attempt an escape. When ever I loose track of where he is in the dark, I send the half lab out to track him. (Which he does quite well). For that, the half lab is my buddy and I dodder on him because he keeps me from dealing with my wife who is inconsolable whenever the Pekinese is missing. The half Chihuahua is more concerned about getting left outside and makes it a point to stay nearby.
Strange that Phys Org used “Debunking” in the headline when the paper actually “calls for caution”.
Anyone fancy a free helicorder?
https://twitter.com/IRIS_EPO/status/1088078653018292226
Evidence of a huge (Krakatau 1883 size) volcanic eruption 56 million years ago where the Isle of Skye is now, off the west coast of Scotland, and the effects it had on worldwide climate – cooling for a few years then drastic warming…
https://www.bbc.co.uk/news/uk-scotland-highlands-islands-46986509
Apart from the breathless OTT description – the eruption would have beaten Krakatau 1883 by several orders of magnitude, surely?- I’m wondering about the Red Hills. Does the item perhaps refer to the Red Cuillin? Which are technically granite, although so crumbly (I’ve been there) as to resemble large piles of pink gravel
This story makes little sense. A big explosive eruption in SKye at that time is entirely possible. It can have been Krakatau-size. But that is not particularly large. The climate effects it describes are far too large for his eruption. I think the BBC got some wires crossed. This was the time the Atlantic opened with lots of basaltic eruptions. The authors probably meant that this was part of that overall process. The BBC states it is a Scientific Reports paper but nothing has appeared there (yet?)
Skye is indeed an interesting place, volcanically speaking; googling for ignimbrites and Skye, I found this:
https://www.geolsoc.org.uk/Geoscientist/Archive/April-2018/Falling-Skye
And there was me thinking that it was only -only!- the remains of a bloody great basalt shield
The Skye is falling – cringe. But very interesting indeed. I knew part of this but not all.
Yes but at least that would leave something to Mull over.
That’s a bit Rhum!…Don’t Eigg him on!
At least give him a Cuillin off period !
I simply Canna cope with these dreadful puns!
Oh I don’t know… All this talk of matters Hebridean makes me feel… Uistfull !
Hmmm….
Circa 61MYA what appears to be a significant impact previously unreported despite being in a “well studied” area.
Personally I have rather doubted that a single impact could have done for the diverse and successful group like the dinosaurs but I am always minded of the ‘string of pearls’ that struck Jupiter. A large fragile object coming from the Oort cloud doing a slingdrop and ending up in earth intersecting orbit having broken into large fragments seems more plausible to me. In that case its quite possible that Chichlub (?) was simply one of several peppering the globe over a relatively short period, indeed debris may still be there as one of our well known meteor showers.
For no very good reason I do like the idea that hotspots are caused by very large meteoric impacts however current physical models seem to rule this out.
Chicxulub was a mixed iron-chondrite asteroid, a comet would not leave an iridium layer.
In saying that comets can be way worse impactors than asteroids. If hale-bopp hit the earth in the 1990s it would gave been a global sterilization event, a 60 km wide object moving at over 200,000 km/hr is going to blow a crater the size of a continent into the mantle, it would probably not look all that different to that animation of a vesta-sized protoplanet hitting the earth that Jesper found. Maybe not evaporate the ocean but it would for sure leave a mark…
Skye did huge flood basalts at that time
And was tropical rainforest in Eocene hothouse
Paleocene – Eocene thermal maxium was the hottest climate in a long time
Northen Siberia and Greenland had forests like Thailand and Borneo back then when Co2 was higher
I think this counts as pseudoscience.
https://www.bbc.com/news/uk-scotland-highlands-islands-46986509
Not really…just journalists getting a tad over-excited, and needing to lie down in a darkened room for a bit
I was thinking more along the lines of them having a dire need for a qualuude.
Manam just had a large eruption. More details will likely come shortly – possibly VEI-4 right now.
Warning to FL550 (55000ft./16,8 km.) now from Darwin.
https://www.volcanodiscovery.com/manam/news/74105/Manam-Volcano-Volcanic-Ash-Advisory-VA-TO-FL550-MOV-W-VA-TO-FL140-MOV-ESE-AT-241600Z-to-55000-ft-168.html
It had several of those blasts since the second half of last year. I don’t think it has reached VEI4 in just a single blast.
It has been somewhat Redoubt-like so far, but the current pattern is similar to late 2004 before the VEI-4 70,000ft eruption on Jan 27, 2005, so I wouldn’t be surprised if it happens again.
OK this event seems to be a bit bigger than the last paroxysms….continuous eruption for over 24 hours, plume to 50000 ft yesterday and today to 55000….reports of widespread devastation on the island
Have yet to read this nut caught my eye. Not the best source, might want to check with usgs instead.
https://www.express.co.uk/news/science/1077163/mount-st-helens-volcano-warning-scientist-molten-rock-rising-spt
Normally we’d check with USGS or GVP. Not currently available, thank you Donald. Not.
And that would be about what is expected from it. Something has to push those extruded domes.
Just a guess, but looks like a re-hash of his 2008 work. Prof LaHusen wrote book chapter with other authors:
Seismic-monitoring changes and the remote deployment of seismic stations (seismic spider) at Mount St. Helens, 2004-2005: Chapter 7 in A volcano rekindled: the renewed eruption of Mount St. Helens, 2004-2006.
This was in Amazon Prime’s “Mega Disaster: It’s Happened Before, It Will Happen Again” programme (broadcast date, 2006 https://www.amazon.co.uk/Earthquake/dp/B01KKVU6S4 ).
I expect it was a slow news day at Express, pulling up second-hand news from nearly thirteen years ago.
Ahem – sorry – a re-hash of his 2004-6 work
“Glacial retreat in the Canadian Arctic has uncovered landscapes that haven’t been ice-free in more than 40,000 years and the region may be experiencing its warmest century in 115,000 years, new University of Colorado Boulder research finds.”
https://www.colorado.edu/today/2019/01/25/landscape-unseen-over-40000-years
(For non US folks..time limited before YouTube pull it down) Nova/PBS documentary of the 2018 Kilauea eruption. https://www.youtube.com/watch?v=s9oFVpPc_iA
Ade
Thanks for the link.
Mac
Funded by a climate change denier (one of the Koch Bros., no less). Reliable?
I was able to watch this in the US. Leaves an awful lot of information out. Why no mention of PGV? The adventure tourist, that showed up cameras ready to profit filming the footage, yet no Rusty the copyrighted Rooster etc. At least there was a shot of Piney the younger. We finally do get to see some of that expensive drone footage, that was sold for large sums.
Makes one wonder what else is left out in reporting these days. Too bad in this era information has been commoditzed for the profit of a few that can afford it. No wonder magical thinking and pseudoscience prevail. I would not be surprised if 40% of those who view this documentary feel that the special effects were sub par.
I thought it was pretty good, they didnt show anything false, and they didnt say anything about the hilina slump collapse that was obsessed over for a while.
However… they did forget to talk about the massive quake, and that fissure 8 was literally the biggest lava eruption in the modern era (no, holuhraun was not larger, it had more volume but lasted twice as long with only 30% more lava) and that the lava from fissure 17 was the only instance of andesite on that entire half of the big island .
Overall though it was a lot better than a lot of other documentaries i have watched.
-someone who literally watched 95% of the livestreams and can remember the individual eruptions by date…
“Rusty the Rooster and Piney the Younger, Yes, those were good days…….. i actually tweeted a comment on that long running coverage… “These shots are so great; i makes me feel like i’m actually there. i can almost smell the…. wait a minute…. nevermind……. ” actually got some hearts on that one…. 😉 Best!motsfo
Three stars in a row!
Credits IMO

Propagating strain release along the oblique part of the rift. You get bookshelf faulting with “books” leaning on top of each other. If one segment moves it is common that nearby segments follow as demonstrated by this sequence.
Jackpot!
And the prize will be… fresh magma?
Looking through the major eruptions of the past, Large VEI 7 eruptions are almost always accompanied by smaller VEI 6 eruptions. It happened with Samalas, Tambora, Paektu. It might be just coincidences but my eyebrow is raised
Coincidence. There were 3 VEI 6 eruptions in the 20th century and no VEI 7. There was also more than 1 VEI 6 in the 19th century.
Yeah. I let the idea of some type undiscovered phenomena causing 2 large eruptions in rapid succession get in the way of the fact that VEI 6 eruptions are really frequent, happening 3 or 4 times per century.
The latest image of Ultima Thule. Note that there are some small craters but not many, and note the ring on the facing side, which is about the same size as the connection to the second bulb. It look as if that used to be connected where the ring is.
These two objects merged extremely slowly both are likley not solid through the divide
A giant machine or hulk coud pull these icey asteroids apart. They are not fused in other words
Nevado de huila shook a little bit.
https://www.elpais.com.co/cali/temblor-sacudio-a-y-la-region-este-sabado.htmlhttps://www.elpais.com.co/cali/temblor-sacudio-a-y-la-region-este-sabado.html
Well hello! Interesting activity suddenly occurring on the west side of Torfajökull, Iceland. The seismos look like it is purely tectonic. I wonder what spurred that on? One reached 3.7.
Is it close enough to Hekla to disturb it? (Personal opinion: no).
“the seismos look like it is purely tectonic”
would you like so kind to explain that for me please?
Sharp. Cracking rock, no ongoing coda – nothing ‘fluid’ rumbling through. I think this is the nearest working station: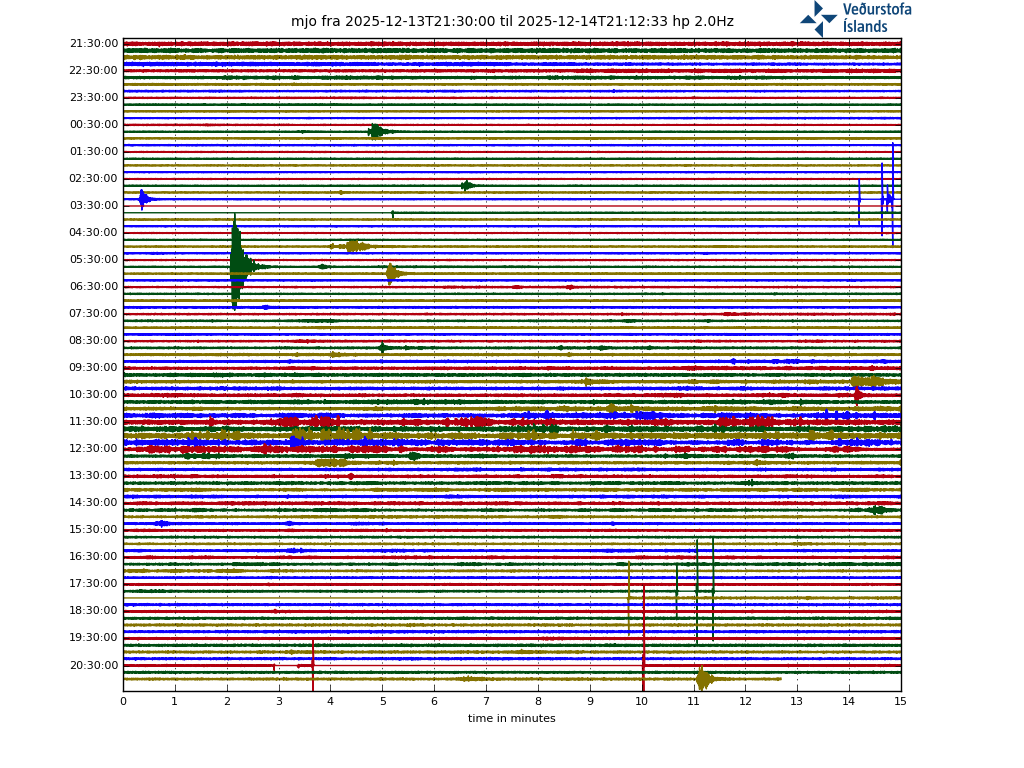
Mind you, experts here will no doubt have their say!
where did you get this graph, thks
and what about tremor graph: blue line above green line. wind?
Click on the chart and it should take you to the source.
Turtlebirdman here once again the high resolution version Of the protoplanet impact.
Souch scary things happened only when Earth formed.
https://m.youtube.com/watch?v=bA2afzgT1iM
Here is the japanese version.
The only animation of youtube to show that.
Thats an impact event thats 50 times larger than chicxulub. My favorite part of this animation
Is when the searing 10 000 C Wall of vaporized rock hits the Himalayas .. Epic
That’s some seriously detailed and well thought out effects work right there. Chillingly good.
And people say a Mars base is a stupid idea!
The asteroid in that animation is 500 km across
Yup Hale Bob woud be extremely scary if it hit Earth at its speeds. ( Hale Bob is over 50 km across ) Holy crap.. so the Nucleus of that one is 60 km across? Thats 6 times larger than Chxlulub impactor
If Hale bop hit Earth at its speed it woud form a crater 1060 km across. The Comet and an area 140 km deep and 460 km wide instantly vaporize into 22 000 C rock vapour. The crater then springs up forms a flat melt impact melt province.
The volume of the target melted or vaporized is 3.14e+06 km3 = 753000 miles3
Roughly half the melt remains in the crater, where its average thickness is 24.7 km.
That Will take millions of years to cool
So much vaporized rock and hot ejecta enters the atmosphere thats its enough to completely combust set fire to the worlds forests.
All large animals woud go excinct as togther with all land based vertebrates and shallow ocean fishes.
Every square meter of hale bopp apparently has a volume of 600 kg (though this is assumed and could well underestimate). Each of those kg has a kinetic energy of about 150 megajoules, and there is probably over 100,000 of those m3 in a sphere 60 km wide.
I dont think an object with that much energy has hit the earth since the moon creation impact…
Well I was way of, it would have a volume of 100 trillion m3, and each of those contains 600 kg, and each of those kg has 150 megajoules… 600 x 150 is 90,000 megajoules/m3…… x 100 trillion………………….
Whatever this thing hits is not going to have chemical bonds anymore…
My calculations above suggest as you say .. it will be extremely nasty
Hale Bob ends all complex life forms
@turtlebirdman
Listen will earth surive.. being plunged deep inside the sun?
I means deep inside suns mantle
Slow earths orbit and let it fall into the solar abyss
With temperatures of 100 000 C under the photosphere I think earth is doomed
It is not really possible to say what happens in those conditions, in theory it would be destroyed but if the planet can sink far enough the pressure might keep it intact, stars that make iron likely have solid iron objects in their cores, not solid as we know it but solid as in it would be a hard very dense object that will turn into a neutron star a few days later.
Hmm,
You seem to be mixing area and volume up but its a fun thing so lets re-do the sums showing working.
**Per cubic meter:**
If each m3 weighs 600kg and comes in a 100,000 km/h or about 30km/s.
Total energy is thus ½ mv2 or about 250,000 Mjoules or 5000MJ/kg
Specific heat is likely about 1000J/kgK (or a bit less) so to heat rock by say 10,000K will take about 10Mj/kg.. The latent heat of fusion around 300,000j/kg. The latent heat of vapourisation seems not to be known but lets guess at 3x fusion or 1,000,000j/kg so perhaps another 1.3Mj.
So meteor/earthrock might need some 11.3 Mj/kg lets call it 10Mj.
So first approximation might be that each kg of meteor will vapourise some 500kg of earthrock, give or take.
And that is where you stop and think. The speed of sound in rock is less than 10km/s, much less than the impact velocity so the earth cannot deform quickly enough to accommodate the impact. Secondly the impact is symmetrical, that is the same as considering a ‘stationary’ meteor being hit by earth travelling at 30km/s. That leads you to the conclusion that the most likely initial transient arrangement is for the entire mass of the meteor and an equivalent mass of earthrock is vapourised in about 2 seconds. The likely fireball temperature would be in the 1MK area according to the sums above. There is just no way to dump significant amounts of energy in 2 seconds. Its a meganuclearblast. Its where the youtube imagry breaks down.
Then what comes next? In some ways its easier to model than an impact.
u(rms) 2= 3RT/m= 3 x 8 x 1000000/16 (I use 16kg/Mole because it will all be atomic)
u(rms) = 1000 m/s = 1km/sec. Which is astonishingly less than the impact velocity!
So even very hot atoms cannot leave the fireball very quickly
The plasma will be optically opaque so nor can light leave.
Wow!! That’s really cool!
What might happen next needs thought but its not likely to be anything like what we are used to in real life. This is just in a whole different league. Basically compared to the actual impact its all going to happen in slow motion. First is the fastest thing which is the shock wave, travelling at maybe 7km/sec (maybe hot dense plasma is similar). At this stage the atmosphere is insignificant equivalent to 10m of material, and should be ignored.
I will let the vulcanologists split energy between P & S waves.
A half decent guess is that 1/4 of the energy goes into heat, sound/shock, ejecta kinetic energy, fireball expansion.
Now earths escape velocity is only 10m/s so now I see why we have bits of mars and other planets turning up on earth, any large impact on a rocky planet should shower the solar system with fragments.
So I would guess about 1/5 into melted rock of which (given earths escape velocity of only 10m/s) probably ½ of that goes elsewhere and some from fireball going skyward too.
So the puddle of molten rock might be say 1/10th the total energy.
Energy in molten rock circa 10Mj/kg. Energy in meteor circa 5000Mj/Kg, energy converted to molten puddle say 500Mj/Kg(impactor) so some 50kg for each kg of impactor ie 50:1.
For convenience lets stick to km3!
Impactor is 30km Radius so volume is 4/3 pi x 302 or about 4000km3 so we have about 40,000km3 of a lava sea to contend with. This is much more than lake Michigan (5000km3) and almost twice lake baikal (23,000km2) so is really large.
If it were an iron meteor the heavy melt with a diameter of approx 100km would slowly sink into the earth and provide a hotspot for millions of years ……
You are a bit optimistic on the Earth’s escape velocity
came from wikipedia 11.2km/s, I don’t do everything from first principles ….
Re-reading this it seems to me that much of the plasma will eject upwards essentially as a gas and cool extraterrestrially, so earth is likely to be shrouded in a quite thick dust cloud for some long period. The edges of the impact area will be ejected more-or-less horizontally to form a wide ejecta plain (don’t we see this on the moon?).
Only a very few select places on the earth will be survivable by higher forms of organism although I’ll bet Japanese knot weed is one ….
Very intetesting and yes I know I wrote a few errors that I couldn’t fix, however I will also add that hale bopp is moving over twice as fast as you used in the calculation……
https://en.wikipedia.org/wiki/Escape_velocity
http://www.ifa.hawaii.edu/images/hale-bopp/FAQ.html
It will lose velocity as it moves away from the sun but I have no idea if its travelling in the same ‘direction’ as earth or contrarywise but my figure seemed a reasonable one to use.
And imagine if earth felll into the sun
The poor planet will vaporize.. the rock vapour streamed away in the solar wind.
ultimately only the core remains and thats stripped away too
Actually the earth would survive to impact with the sun, even the energy from a hyperactive wolf rayet star wouldnt vaporize an entire planet before it impacted. It is theorised that most white dwarfs are orbited by the cores of their terrestrial planets that survived within the stellar envelope. Obviously not all of the planets will survive but a massive rocky world of several earth masses would likely survive an event like this. Terrestrial planets can actually survive very close to stars, some gas giabts orbit stars so close they are going to turn to terrestrial objects. One orbits a blue star so close it has a temperature of about 5000 C…
It has been theorised also that massive stars might be orbited by supermassive solid planets with the mass of several jupiters up to even brown dwarf range but I dont think any of these have been observed yet. This might be because they could be mistaken as small brown dwarfs though as they likely glow brightly and have immense surface gravity.
Supermassive solid planets woud be an amazing thing!
Imagine an earthlike thing with 1000 earth masses 🙂
The internal heat radioactive heating of these objects woud be so strong,
that they can in princip not cool at all after formation
A Magma Giant Planet woud be a correct defention of a supermassive solid planet
Volcanoes are flat and superhappy and surface crust floats on a magma ocean
The magnetic field woud be crazy from 250 000 C core
Many comets and asteorids do crash into the sun
They vaporize
A large asteorid enters the suns atmopshere like a meteor and explodes in an airburst in the photosphere. The suns gravity accelerates an incomming comet or asteorid to 800,000 km an hour!
They pretty much explode in an airburst over the suns surface
I remember watching the real time tracking data of comet Ison as it approached perihelion. The acceleration that was being shown on the velocity gauge in the final few days and then final hours was truly mind boggling. It also provided some perspective on how truly massive the sun is, something that is way beyond our everyday comprehension.
New series of Kilauea overflight images shared by GVP. And isn’t it good to see that GVP are back in the office again!
https://hawaiilavaupdate.wordpress.com/2019/01/27/lava-update-january-25-2019/?fbclid=IwAR102bquByJE86mRhKivLHciiOmv4We3l2nr_0dFJ98dFPQ0SoZ3OQCWC9Y
There have been a few other swarms in Torfajökull in recent years.
There was one in 2017, near Hattver, which is more or less due S of Landmannalaugar and just N of the glacier. Then last August (16/8) there was a swarm including a 3.8 and a 3.3, respectively about 2 kms WNW and ESE of Hrafntinnusker. They too looked tectonic.
That was meant to be a reply to Clive at 11.26, 27/01 but for some reason best known to the WordPress software, it did not get posted where I told it to.
Wow they cut a road through fissure 8 s channel system
The roadcutting woud be a hot job
The lava field specialy the thick parts near Kapoho is still glowing hot inside
Fissure 8 s spatter/cinder cone glows in its inside massive and insulated