Lights of the North! As in eons ago,
Not in vain from your home do ye over us glow!
William Ross Wallace (1819–1881)

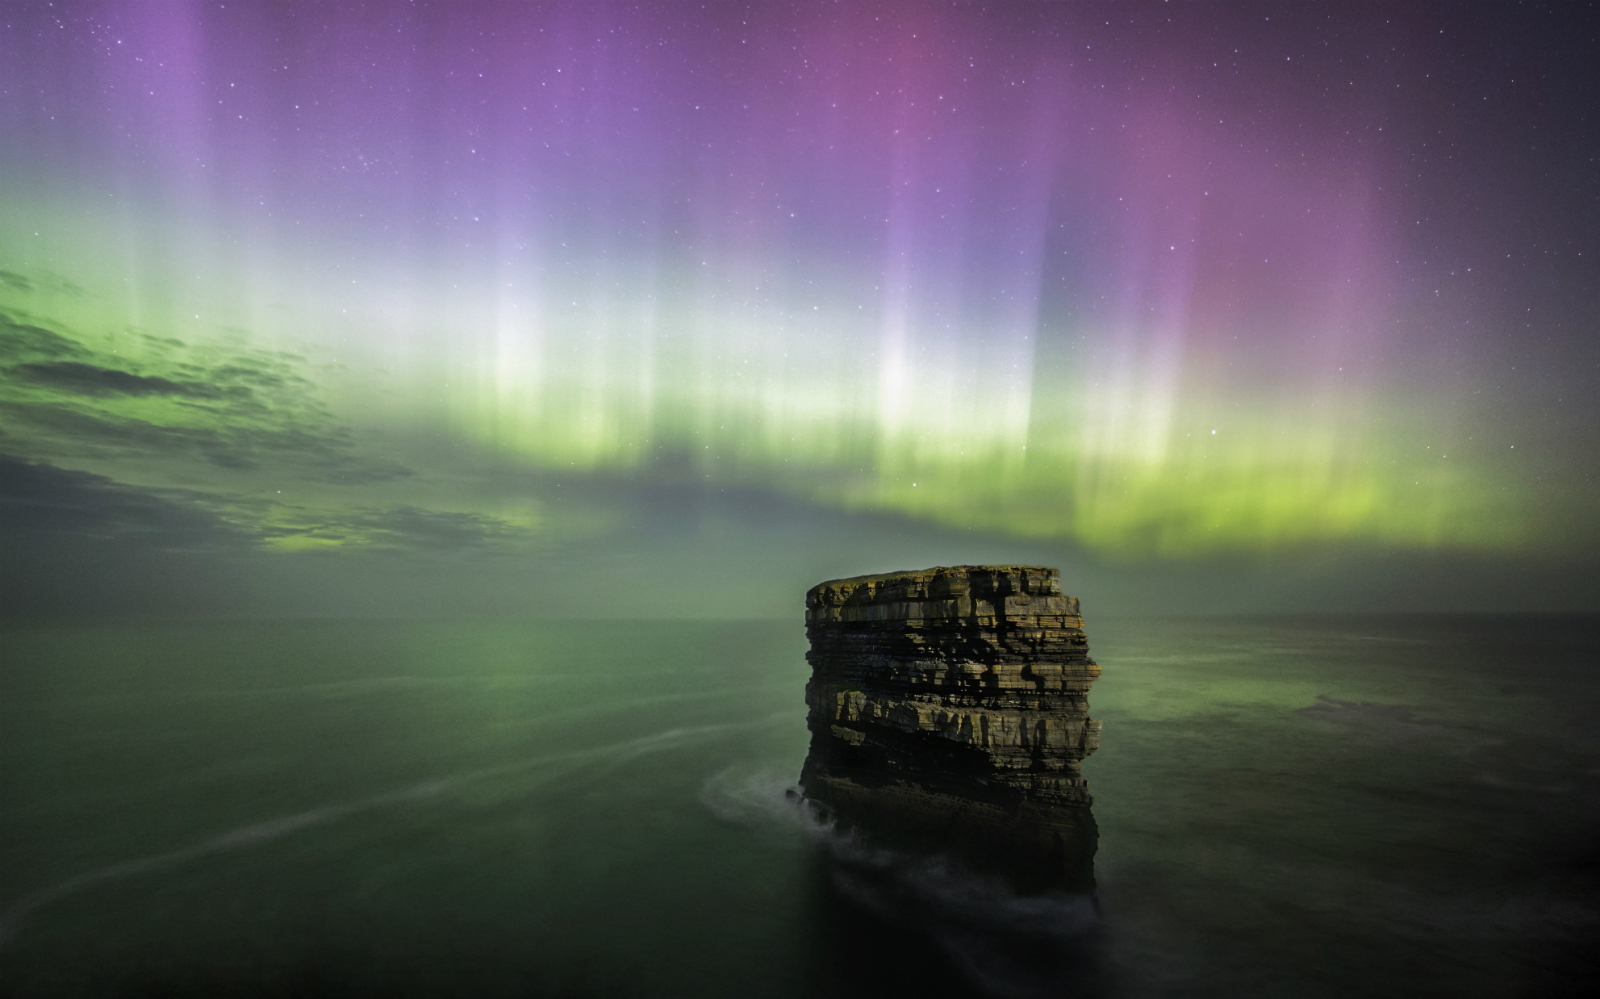
Aurora over the Snæfellsnes Peninsula in Iceland
Jan 25, 880 AD, was a remarkable night. The Arabian historian Ibn Abi Zar wrote about it more than 400 years later, from the ancient city of Fez, northeast of the Atlas mountains:
It was a great red splendour in the sky, from the beginning of the night to the end. An equal thing was never known before. It happened the night of the Saturday 19 of safar of the cited year [25 January 880].
African aurora was very rare. Ibn Hayyan described a later event seen in Iberia, where it is a little more common:
Toward the end of the night of the Thursday [27 April 942] a reddish colour as fire in the sky, from which a lot of rays that were reflected on the branches of the palm trees and on the top of the palaces emerged, appeared in the horizon. People thought that it was the daybreak light when Sun rises until the red colour became lost with the arrival of the morning and disappeared with the clarity of the day. It appeared from the Occident.

The oldest depiction of aurora, in a Cro Magnon cave painting.
We have lost the magnificence of the night sky. From cities we can hardly see the brightest stars, and even in dark places 100 kilometers from any city, their lights reflected of the clouds above them can be seen, brightening the sky. Real dark skies have all but disappeared. Aurora would have been a powerful experience in the years before artificial light, the dancing, eery lights which soundlessly move across the sky and illuminating the landscape in ghostly red and green.
The oldest description of aurora seems to predate writing. It may be depicted in 30,000-year-old Cro Magnon cave paintings, some of these have strange swirling patterns called macaronis. The best example is in the ceiling of the cave of Rouffignac in France. It looks like aurora – but whether that is what it is is disputed. With artists, you can never really tell.
Much later came the written descriptions. The oldest generally accepted as an ancient description of aurora is from the book of Ezekiel, dated to 593 BC: …a stormy wind blew from the north, a great cloud with light around it, a fire from which flashes of lightning darted […] the fire flashed light, and lightning streaked from the fire […] a light all around like a bow in the clouds on rainy days…
The Greek philosopher Xenophanes mentioned “moving accumulations of burning clouds“. He lived at approximately the same time as Ezekiel, and in view of the rarity of bright aurorae this far south, it may well have been the same event. There are some 50 accepted descriptions of aurora from before the (non-existing) year zero, including one from 567 BC listed in Babylonian tablets. The event of 112 BC was remembered by Pliny the Elder: We sometimes see, them which there is no presage of woe more calamitous to the human race, a flame in the sky, which seems to descend to the earth on showers of blood; as happened in the third year of the 107th Olympiad, when Philip was endeavouring to subjugate Greece. Other particularly bright auroras happened in the Mediterranean in 349 BC and around 460 BC. Not everyone was lucky. Much later, Edmund Halley was “dying to see the aurora and expecting to die without seeing it.” He had to wait for many decades before he finally saw the great aurora of 17 March, 1716, which blazed the sky from America to Russia.
The spectacle of the aurora borealis can be mesmerizing, even hypnotic, draping the land in an unearthly colour. The light forms arcs, bands, rays, patches or veils; it is a dance of red and green, where curtains move, jump and wave across the sky, pulsing in brightness.

The percentage of nights when aurora can be seen. It is highest in a ring around the magnetic pole. Note that few of these auroras will be bright. To see a faint aurora requires a clear, moonless night far away from any artificial lights. In the UK, the best sites are the Dark Sky Parks, preferably in the north.
If you want to see aurora, pick a week around new moon, preferably autumn or winter when the nights are darkest, and travel to somewhere 15-20 degrees from the magnetic pole. The best auroras tend to be around midnight, with the sun is on the other side of the magnetic pole. Do give yourself time as not every night is clear! North Alaska is great, and Iceland has some good spectacles, with the added attraction of the occasional volcanic eruption to add fire to the glory. And if you would like to see the aurora australis, the southern tip of New Zealand may be your best bet. Avoid Mexico: it is almost never seen there. Similarly, Spain would not be an obvious choice as a visible aurora happens perhaps once a decade. Seeing a bright aurora in Morocco is unheard of. The African event described at the start of the post is most unusual indeed.
Aurora happens high in the atmosphere. Highly energetic particles from the Sun get captured in the Earth’s magnetic field, spiral around the field lines and enter the atmosphere where the field line bend towards the magnetic pole of the Earth. The high energy particles collide with the whispers of air 100 kilometer above the ground, and cause them to give light: oxygen glows green or red, nitrogen shines blue. Each colour occurs at its own height. Red oxygen (a wavelength of 630 nm) is seen high up. Green (557 nm) is lower, down to 100 km height. If red and green occur together, the eye picks up a pink glow. Blue light from nitrogen is the lowest layer. The layers terminate suddenly at a specific altitude: this sharp lower edge is clearly visible especially from space.

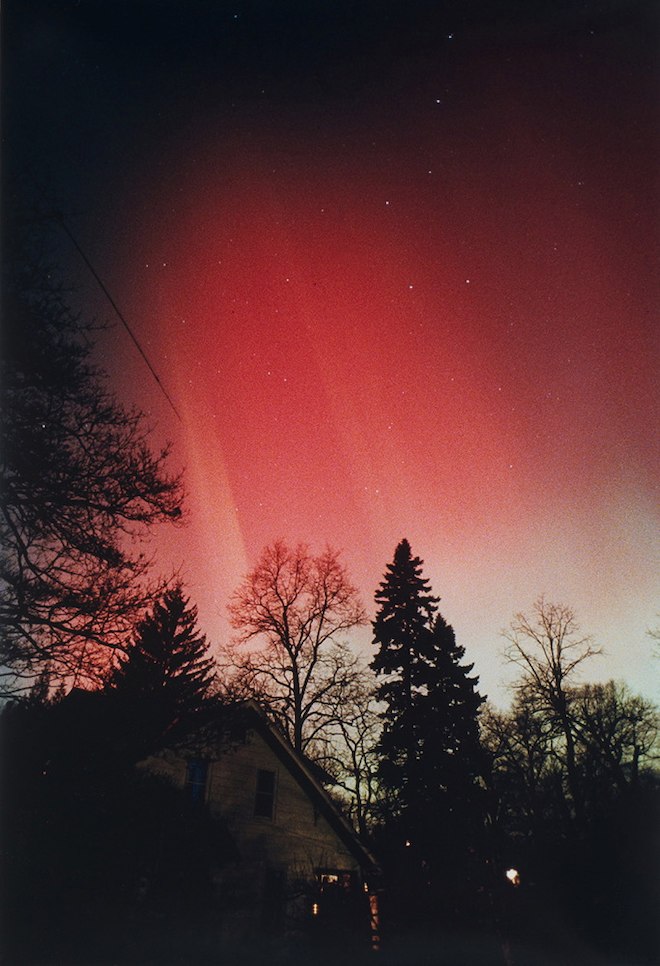
The lights form a fiery circle around the pole. There is surprisingly little aurora directly above the magnetic pole itself: they encircle it 10 to 20 degrees away. A place like Churchill, Canada has aurora every clear night. To the south it becomes rarer. It takes more energetic particles for the aurora to reach say New York. Further south, a bright aurora may become a once-in-a-lifetime event. Far from the pole the auroras that do occur are normally red, and they lack the crispness of the polar lights. Even so, they are impressive. The brightest I have seen it myself was one of those rare southern reaches, and it veiled half the sky in bright red as if the sky was reflecting a distant fire – which at first I thought it was.

Were you ever out in the Great Alone, when the moon was awful clear,
And the icy mountains hemmed you in with a silence you most could hear;
With only the howl of a timber wolf, and you camped there in the cold,
A half-dead thing in a stark, dead world, clean mad for the muck called gold;
While high overhead, green, yellow and red, the North Lights swept in bars?
— Then you’ve a hunch what the music meant… hunger and night and the stars.
(The Shooting of Dan McGrew)
Blame the Sun
The particles that cause the aurora come from the Sun. Local patches on the surface of the Sun get a strong magnetic field. Two different field lines can pass close to each other, and sometimes they connect. Such a magnetic reconnection is like breaking a taut guitar string. The tension is released and the two sides of the string whip away at high speed. In the Sun, the sudden release of magnetic stress accelerates the local gas, and it flies off in a flare. High energy, charged particles begin to stream away. A large flare can produce X-rays, gamma rays, and high energy protons.
Many miss us, but sometimes the flare heads directly for Earth. It takes the particles a day or so to reach us. Flares come in all kinds of sizes. The stronger the flare, the brighter and further south the aurora. Some warrant the name ‘solar storm’. And if storms are possible, how about hurricanes? A solar hurricane could be scary indeed!
Flare sizes
Solar flares are assigned a size in a way that is a bit like the Richter scale for earthquakes. They are ordered alphabetically, as A, B, C, M and X, where each class is ten times more energetic than the previous one. A to C are too small to affect us. M-class can cause radio outages. X-class is more like it. Each class is subdivided by assigning a number from 1 to 9. The problem with this scale quickly became apparent: flares were seen that were more powerful than X9. So the numbering was extended for X-class flares only. The strongest one on record was the Halloween solar storm of 2003: it was measured at X28, 500 times stronger than an X1. But this was an underestimate: the detectors saturated at this level. Modeling suggests it may have as strong as X35. It mostly missed Earth, luckily. And there is no reason to assume that this is the strongest event that could ever happen. In fact, a bigger one had been seen almost 150 years earlier.
The Carrington event
The solar cycle number 10 had started in 1855. It was about average in strength, as measured in sun spot numbers. Of the cycles that have happened since, 7 were weaker than cycle 10, and 7 were stronger.
During August 1859, a huge sun spot came into view on the Sun. It was at mid northern latitudes on the Sun, and dominated the solar disk. There was a smaller spot in the southern solar hemisphere, but otherwise the surface had been clear. The new spot spread out over a 6th of the width of the Sun. At the start of September, it erupted.

The sunspot of August 1859. Drawing from Carrington, RAS archives.
Richard Hodgson in Highgate, London, a retired publisher and amateur scientist, saw the flare and later wrote
While observing a group of solar spots on the 1st September, I was suddenly surprised at the appearance of a very brilliant star of light, much brighter than the sun’s surface. [..] most dazzling to the protected eye, illuminating the upper edges of the adjacent spots and streaks, not unlike in effect the edging of the clouds at sunset.
The event was described in more detail by Richard Carrington, who later had the event named after him. He worked at his observatory in Reigate, south of London, and wrote The image of the sun’s disk was, as usual with me, projected on to a plate of glass coated with distemper of a pale straw colour, and at a distance and under a power which presented a picture of about 11 inches diameter. I had secured diagrams of all the groups and detached spots, and was engaged at the time in counting from a chronometer and recording the contacts of the spots with the cross-wires used in the observation, when within the area of the great north group (the size of which had previously excited general remark), two patches of intensely bright and white light broke out, in the positions indicated in the appended diagram by the letters A and B, and of the forms of the spaces left white. My first impression was that by some chance a ray of light had penetrated a hole in the screen attached to the object-glass, for the brilliancy was fully equal to that of direct sun-light.
Seeing the outburst to be very rapidly on the increase, and being somewhat flurried by the surprise, I hastily ran to call some one to witness the exhibition with me, and on returning within 60 seconds, was mortified find that it was already much changed and enfeebled. Very shortly afterwards the last trace was gone, and although I maintained a strict watch for nearly an hour, no recurrence took place. The last, traces were at C and D, the patches having travelled considerably from their first position and vanishing as two rapidly fading dots of white light.
What his paper didn’t say is that he didn’t look for a repeat of the event. According to his note book, he was ‘too busy cutting trees’!
What Hodgson and Carrington had seen was a so-called white-light flare, a relatively rare event that can happen a few times per year around solar maximum. This was the very first ever recorded. But this was more than just such a flare, and what they saw was only the beginning. Almost at the same time, the magnetic instruments at Kew recorded a disturbance. The magnetometer quickly returned to its previous position. But 17.6 hours later, the disturbance came back and this time the instrument went off the scale. The geomagnetic hurricane had arrived.
The disturbance reached a level of 110nT in London. The observers did not fully appreciate how unusual this was. Nothing stronger was seen at this latitude until the super flare of 28 February 1942 when the force reached 112nT. The Halloween flare of 2003 reached 114nT. But in both these cases, this was the maximum seen over a range of stations across the globe: in a Sun storm, the measured strength of the magnetic disturbance can vary dramatically from location to location. The 1859 data is based on a single location only. It is very likely if more locations had been available, much higher strengths would probably have been measured.

Storms of light
The Carrington event refers to the solar storm of Sept 1 to 5, 1859. But there were in fact two storms in short succession. The first one started about 2300 UT on Sunday, August 28, intense but short-lived. The second one began on September 2 about 0500 UT, and lasted for three days. The white flare seen from London was the start of the second storm, but both had come from the same sun spot. And both storms were accompanied by worldwide auroras which reached as far as Honolulu, and reached to 18 degrees from the magnetic equator. This is not entirely unique: in later years the aurora on 4 February 1872 was even more widespread. But nothing like it had been seen in living memory.
The first aurora began on Sunday, Aug 28; it was seen from the Mediterranean to the Gulf of Mexico. The aurora re-appeared late on September 1 (September 2 in Europe), brighter and even more widespread. There are hundreds of reports and descriptions, some describing in detail how the spectacle changed from minute to minute. Picking just a few example, the Indianapolis Journal wrote: ‘It was far more brilliant than the one of Sunday night, and it certainly was much more luminous, though less marked by the darting rays and wonderful pulsations that made the first so splendid.’ John Cambell, also in Indianapolis wrote: At 3h 45m A.M. Magnificent corona in the zenith. Central portion spiral, red and white, changing instantly to a beautiful rose color, with spiral streams shooting forth into all parts of the heavens; the most brilliant streams flowing east and west.
Further south, the aurora was celebrated differently. “The influence of the Aurora Borealis has been felt in the Garden District. We see in the police reports, this morning, that several denizens of that delightful spot have been found drunk – many under a strange delusion, having taken the gutter for their own comfortable beds’’ (The New Orleans Daily Picayune, Wednesday, September 7, 1859).
The Physio-Meteorological Observatory at Havana approached it in a more scientifically detached manner: White rays with red and blue were then seen towards the west, which dilated longitudinally, oscillated laterally, were extinguished and resumed their brilliancy again by turns. […] At 2h the Aurora had attained its highest magnificence. The heavens then appeared stained with blood and in a state of complete conflagration. Havana also had aurora on Aug 28, and the Observatory commented how rare such a double event was: between 1784 to 1859, aurora had been seen from Havana a total of six times; two of these were the double storm of 1859.
A little further south, Kingston, Jamaica, reported: It appeared as if there was a colossal fire on earth which reflected its flames on the heavens. The whole island was illuminated. It looked as if Cuba was on fire, and many believe that a portion of this island had been destroyed by a conflagration. Other persons were of opinion that the light was that of an aurora, but the aurora has never before been seen in this latitude.
London and Brighton both reported a vividly white aurora. In Prague and Rome too the aurora was predominantly white. This is notable, given how colourful the light was in America. The aurora at Sept 1/2 also reached Hawaii. In Australia, the aurora australis was seen as far north as Brisbane.
Telegraph
The aurora was impressive, memorable, and perhaps frightening to those unfamiliar with it. But the sky light could not do anyone harm. There were other effects from the Sun storm which had a more direct impact, caused by the technological revolution that was going on: the rapid adoption of telegraphy.
The idea for the telegraph originated in the 1830’s, and the first telegraph was send in 1844. It was based on the discovery by Oersted that an electric current could change the direction of a magnetic needle, and on the development of the electric battery by Volta. The system was based on needles pointing at a display of letters and numbers. A push of the button closed the circuit with the battery, an electric current would move the needle, and words could be spelled out by varying the current. A person called Morse had been involved (obviously). By 1859, telegraph wires spread between al major cities. The first transcontinental wire came into service in 1861.
The telegraph used long wires, and these could pick up induction currents. During the 1859 storms, this is exactly what happened: the rapidly changing magnetic field put too much current on the lines, and the needles were moving too much to read any message. Many connections became impossible. Or worse: in Gothenburg, the telegraphist got an electric shock when disconnecting the earth. He came off lightly compared to some others. In Norway, the wires discharged sparks in the telegraph office, setting pieces of paper on fire. A telegraph operator at Baltimore even reported that The intensity of the spark at the instant of breaking the circuit was such as to set on fire the wood work of the switch board. Bright sparks were also noticed in Bordeaux and Toulouse.
Some telegraph lines did better than others. As one report states: On Friday, September 2nd, 1859, upon commencing business at 8 o’clock A.M. it was found that all the wires running out of the office were so strongly affected by the auroral current as to prevent any business being done, except with great difficulty. At this juncture it was suggested that the batteries should be cut off, and the wires simply connected with the earth. The Boston operator accordingly asked the Portland operator to cut off his battery and try to work with the auroral current alone. The Portland opera- tor replied, ‘‘I have done so. Will you do the same?’’ Boston operator answered, ‘‘I have cut my battery off and connected the line with the earth. We are working with the current from the Aurora Borealis alone. How do you receive my writing?’’ ‘‘Very well indeed,’’ rejoined the Port- land operator; ‘‘much better than with the batteries on. There is much less variation in the current, and the magnets work steadier. Suppose we continue to work, so until the Aurora subsides?’’ ‘‘Agreed,’’ said the Boston operator.
This is still the only reported case of Solar storms being used for renewable energy!
The cause of aurora
Aurora were still a mystery in 1859, and after the storm, a variety of explanations appeared in print. The Scientific American, not entirely justifying its name, proposed that it was caused by falling matter from erupting volcanoes. (The editors should have read VC.) The San Francisco Herald perhaps came closer, describing it as Nebulous matter . . . known to exist in planetary spaces’’ similar to meteors falling into the atmosphere. The New York Herald went for the least likely explanation and attributed it to to reflected light from icebergs or polar lights.
But the truth became clear once the full story appeared. The magnetic disturbance and the induced current in the telegraph lines showed that it had to be electric currents, high in the atmosphere. The alignment of the streamers with the earth magnetic field showed that the current followed these field lines., entering the atmosphere where those lines dipped down towards the poles. It clearly came from space. And the observations of Carrington showed that the cause was in the Sun. Nowadays, it is called space weather.
The uniqueness of the Carrington event
So how strong and how unique was the Carrington event? There have been many Sun storms since, a few of which caused auroras and electromagnetic disturbances. Several auroras have come even closer to the magnetic equator than in 1859. Magnetic disturbances have occurred, and although it seems that the 1859 event has not been paralleled, some came close. There have also been larger Sun spots, although not many.
Storms can be ranked on different aspects: the geomagnetic disturbance, the aurora strength, sun spot size, sudden ionospheric change. On each aspect, there have been solar storms as strong as the 1859 event since. But 1859 is the only one that was among the top few on every aspect. Putting the numbers together, it seems that the energy in the flare was twice as large as any flare since. It is estimated as between X40 and X50. An event like this is estimated to have happened perhaps only twice per millennium. However, the real strength of the event is still being discussed. It is also important to note that solar flares cannot really be described by a single number: it depends on energy, hardness of the radiation, proton flux, and direction of the embedded magnetic field. Flares with the same classification can be quite different in their impact.
Why was this event so extreme? The solar cycle of the time was not particularly strong, but it now seems that strong storms can happen during any cycle. But in 1859 there were two solar storms in short succession. That is unusual, and it may be part of the reason for the strength of the second storm. If a fast mass ejection meets a slower one and sweeps it up, the interaction between the two can amplify the resulting shock. The first storm was strong but not too exceptional. The second one went off the scale.
Our modern world
Our technology has developed quite a bit since 1859. In some ways we are better placed. Telegraph cables have become optical fibres, and these are safe from solar interference. But new risk factors have appeared. We depend on satellites and on power lines which both are open to the effects of solar storms. This became apparent during the solar storm of 1989, when an X10 (or so) flare caused a storm that affected the power lines of Hydro-Quebec. Quebec is at high magnetic latitude, and the very long power lines were perfectly placed to pick up the induction current. Large currents began to flow through the grounding points, causing the circuit breakers to flip. Within 90 seconds, the lines linking the hydro-electric dams in the north to the cities of the south were cut. It left much of Quebec without power for nine hours: restarting a complex power grid is not easy. This was a large but not an extreme storm. What could a repeat of the Carrington really do? How resilient are we?
Aurora during the 1989 solar storm
The first effects would be on satellites. These are right in the firing line, with little protection. Communications would be disrupted by surface charge building up on the satellites. In a bad storm, such charge could leak in and damage the electronics. A study in 2005 estimated that we could loose 10% of the satellites, ranging from low-earth orbit to geostationary ones. Many of the GPS satellites could fail – and repair crews are not readily available. The study estimated the total cost to replace the satellites at 50 billion dollar, while the companies providing commercial satellites could face losses of the order of 30 billion dollar. There would also be heating of the outer atmosphere, and over several years satellites in low-earth orbits would be slowly pulled down by the expanding air. Even the International Space Station could be at risk, and would require an altitude boost.
Radio communications are badly affected, especially those using high frequencies. Mobile phone connections becomes difficult. GPS signals from the satellites give high timing errors: GPS positioning becomes unreliable and intermittent. Compass-based systems would fare better but could still mis-point by several degrees. Inertial systems would be unaffected. Airplanes at high latitudes would also suffer from the communication problems (they would also be subject to significant radiation doses). During the 2003 halloween storm, planes had to be re-routed further south. During that event, the FAA could not provide GPS navigational guidance for approximately 30 hours.
How about our power lines? Here is the biggest risk. Quebec was actually a fairy mild case, where the circuit breakers prevented real damage. Since that time, capacitors have been installed on the lines to prevent a re-occurence. But a much larger Carrington event could still overload the grid, causing severe voltage regulation problems and, potentially, widespread power outages. Worse, the currents can cause internal heating in extra-high-voltage transformers, causing failure or permanent damage. The 1989 storm damaged two such transformers in the UK. The manufacture of transformers can take many months, and if many are damaged, replacement could take the best part of a year. Modeling of an extreme storm suggested that 130 million people in the US could lose power, and that 350 transformers could be badly damaged. The worst affected regions would be Scandinavia, the UK, the Pacific Northwest, and the Northeast region including Quebec, New York, and New England, with power outages of weeks to months and an economic cost of 1 trillion dollars. This is very unlikely scenario, and it assumes that there has been no real preparation. But that is what risk analysis is for.
The dark side of the Sun
The storm of 1989 became a wake-up call, after decades of a quiet sun. It was minor compared to the Carrington event? But we don’t know enough about it to really know what happened. And we still don’t know what is the worse the Sun can throw at us. The beautiful aurora has a dark side.
Albert Zijlstra, October 2018


I haves a question.. how hot .. does a flare explosion on the sun get??
I imagines it to be… very hot indeed
10 milion Kelvin is a typical temperature. But by the time it reaches us, there is not much thermal energy because the density of the gas in it is very low. So it heats the outermost atmosphere (the thermosphere) but it has no effect on any temperatures further down.
One of the things the Parker Solar probe is trying to figure out, is how the corona can get to such a high temperature when the photosphere is much cooler.
I’ve always assumed that the electromagnetic fields that emanate from the core of sun are acting as a particle accelerator. I’m sure there equation between voltage and temperature floating about somewhere.
Technology note. 7400 series TTL integrated circuit chips are for run of the mil standard consumer electronics. The 5400 series are pretty much identical, but are hardened for operation on more adverse environments. (radiation etc). 5400 series are the mil-spec chips. However, even though they are hardened, they may have trouble dealing with a Carrington level event.
As for the transformers. All of them are designed for a specific frequency range for normal operation. These characteristics affect such things as how much voltage step-up or step-down occurs. When a transitory EMF causes the load and/or ground loop current to change, it can affect the heating of the transformer core and possibly push it beyond design specifications, invoking a failure. For consumer electronics encased in a shielded metallic enclosure (effectively a Faraday cage) any penetration of that enclosure can couple spurious EMF into the enclosure. {power cords, patch cables etc…}
Here in Britain, we seem to get a Carrington event every winter- the entire country will grind to a complete in a few weeks probably- the moment we see a snowflake! We are a nation of special snowflakes after all… 😀
Though the symptom may be similar, I think the cause is different…
Link for image is from http://www.spaceweather.com/ Note: They are a sponsor of Earth to Sky Calculus and occasionally offer products such as jewelry that has flown to very near space on one of their sounding balloons. The proceeds are used to support hands-on STEM education.
The balloons are flown to measure cosmic ray intensity at various altitudes. They even developed a model that can predict your radiation exposure on various commercial flights.
https://spaceweatherarchive.com/2018/06/15/what-is-e-rad/
our home has 2 ‘Space Bears’ and one of their helmets were impacted in re-entry. i told my daughter she could get a replacement but she insisted on keeping the original…. You know; the adult middleaged daughter…. who keeps my computer running (it’s really hers but i won’t get off it so she uses a lap top… 😉 Perhaps Albert could address the ‘Steve’ aurora. Best!motsfo
My standing policy with regards to volcanoes is “Don’t be there.” It works in other dangerous situations as well. But I guess if the chips are down, running helps.
https://www.syfy.com/syfywire/science-weighs-in-on-how-to-escape-a-chainsaw-brandishing-killer-run
Specifically, in this case, you would have the advantage of not lugging around a cumbersome mass that throws your balance off and you could maintain a more consistent and energy efficient gait.
Besides, that old adage about the danger of running with scissors is even more applicable to your pursuer.
* And why you ALWAYS plan out an escape path and a safe direction you can jettison the saw if things go bad while you are cutting a tree or limb. You can always buy a new bar and chain.
Now a sort of contentious point of view for the fear mongers that pop up every time this topic comes up in other media with their alarmist style.
Using non verified proxy data for Solar Storms, the return interval is about 366 years.
With known documented events, it is 19.5 years.
Neither of these solar storm sets were necessarily as bad as the Carrington event. They are just known or indicated storms of some sort, strong enough to show up in the record they are derived from.
I mentioned 5400 series TTL earlier. That’s literally ANCIENT technology from an IT point of view. Hardening electronics is standard fare for equipment that is expected to be exposed to adverse environments. Don’t think power companies are any different. If the power isn’t working, they don’t make money. Conjecture: It’s a good bet that they have contingency plans.
Oh, “aging electrical infrastructure?” Yeah… about that.
This is a shot of the various electrical crews staging at the Pensacola Fairgrounds in preparation for the arrival of Hurricane Michael. Reportedly, they had crews from 16 different states here, waiting for tasking after the storm hit. Our infrastructure gets reworked or replaced on a fairly regular basis. It is not much difference for the North East when the ice storms roll through in the winter. Can wide scale failure occur? Yes. Complex systems are like that, and also prone to cascading failures as the network tries to adjust to changing conditions. It’s not the infrastructure at fault, it’s a mis-match in system capability verses the automatic decision making routines meant to deal with transients. Those routines are based off of models, and models are prone to failure when something it wasn’t designed for happens.
Let people do it instead of computers? Nope. A human just can not react as fast as a computer. Yeah, the operations centers are managed by humans, but they are managing computers. Computers that are fast enough to deal with the switching speed needed to route power across different circuits. I don’t doubt that AI will eventually be developed to manage those computers, but for “big picture” stuff, you still need a human.
IMHO, it isn’t local, pole-mount transformers that are the problem, they’re stock items. Rather, the big, often custom-built grid units with long lead times…
FWIW, my understanding is that a lot of heavy-duty switch-gear gas been upgraded to isolate dangerous ground currents, and ‘modern’ transformers have much more tolerance to ELF & DC than ‘traditional’ designs.
YMMV.
And a NASA thing about re connection events.
NASA Spacecraft Finds New Magnetic Process in Turbulent Space
Now, there are some out there who decry that magnetic lines of force as shown in many illustrations are just inventions of an artist making scribbles on a plot and are not physical things. Well… that only partially true. The “scribbles” are representative of the lines of force. A way to visualize the orientation of the magnetic field. Remember how they are always described, magnetic “lines of force.” If you had a vector plot of an electrostatic field, you would not say it’s just what someone scribbled and is not real. With a strong enough electrical field, I guarantee that if you stick your hand in there, it reach out and say “Hi!” Likewise, a magnetically attractive material would feel the pull towards the source of the field in much the same manner. “Re connection events” are when these field lines reorient themselves into a new more efficient state. In the Earth’s magnetosphere, this can result in a sort of sling-shot effect slinging charged particles around. And charged particles in motion, generate their own magnetic field just from their motion. That’s why coronal mass ejections get so problematic. That ejection is made up of charged particles, and their magnetic field interacts with our magnetic field and things get weird, fast.
These flare explosions must be a pretty impressive sight… it makes a VEI 8 eruption look like a little fart
Its beyond amazing How powerful the sun is
Magma is refilling the middle East Rift Zone and Kilauea summit area.
The eruptive event is regarded to have ended October 5, 2018. Per the USGS 14.7 square miles of land was inundated; over 700 homes destroyed; approximately 2,000 people displaced.
Earthquakes continue to occur at Kīlauea’s summit and south flank where small aftershocks of the M-6.9 quake in May continue.
The summit tiltmeters (measure minute changes in ground surface heighth) have recorded a slight ongoing inflation. At least one tiltmeter at the summit (UWE tiltmeter located along the NW margin of the Kilauea crater) has recorded a complete DI cycle (deflationary/inflationary) which began on October 18th and ended about October 22nd. This is a strong indication of magma resuming to be active below the surface at the summit area.
Puʻu ʻŌʻō and east towards the Pahoa-Kalapana Rd. continue to record an inflationary trend, indicating magma is refilling the middle East Rift Zone. The largest recent south flank earthquake was magnitude-3.8 on October 20, 2018 and located south of Pu’u O’o.
Fissure 8 continues fuming at low levels and the collapse pit is the central feature of the crater floor. No incandescence has been seen overnight recently.
Fissure 8 is probably dead, but the conduit in the east rift that fed pu’u o’o has definitely extended beyond it now, about as far as a bit east of heiheiahulu. JOKA station is on the northwest side of heiheiahulu and shows inflation from the south and slightly east, as well as up. This would indicate the main inflation is in this area, but there is even a slight signal as far up as pu’u o’o so basically all of that area is filling. If the summit is already going to DI events only a few months after a big drain then that pretty much confirms that there is a very prodigious magma supply for Kilauea right now.
Actually I’m not sure what the exact maths is but it should be possible to make an educated guess as to how much the east rift has inflated at the epicentre. It has inflated by about 12 cm at JOKA station which is northwest of the epicentre, and assuming that the magma is maybe 3 km deep and 10 meters wide there should be some way of finding how much has been intruded since the eruption ended. This is a rather rapid and quite significant response for only 2 months of no eruption, it is comparable to the inflation at pu’u o’o in March and April before these events started. Based on the general assumption that there was an average supply rate of about 0.15 km3/year during the last years of pu’u o’o then there has probably been 0.04 km3 of magma since then. That is already quite a lot and would be able to supply a not trivially small eruption if it broke out now. After 6 months an eruption as big as 1955 could be possible and that would probably lead on to something more prolonged at this point.
Because this is probably also mostly new magma, and it apparently doesn’t take all that long for enough gas pressure to cause high fountaining (about a few weeks to a month based off mauna ulu and pu’u o’o), the next eruption on kilauea might be pretty vigorous and happen with much less warning activity than the activity in May. It could be quite similar to the upper 1955 vents which are in the same area. The fact the magma would also only have to go up a few km or less and not make a new dike would also make this fairly low warning.
I’ve had some pretty decent success in regards to reducing local light pollution, by treatening the city council with taking a grinder to various lightposts/Streetlights in the area, if nothing gets done about the problem(there’s no reason you should be required to use curtains at night). I’m absolutely aware that this approach is not going to work everywhere. But it has resulted in us having a decent Bortle 3-4 Scale sky here, with borderline Bortle 2 outside village limits.
On cloudless nights(not many), amazing, specially when the aurora is out.
Any thoughts on the possible impact of a Carrington Event on rooftop solar systems and inverters, heart pacemakers and implanted cardiac defibrillators? I suppose the potential upside is that those of us with both might glow in the dark when the lights go out; or may simply stick our fingers in a power socket to resume boiling the kettle for a cup of tea.
Dunno. But the induced current effects will be highly dependent on the length of the conductor. That’s why long length power lines will accumulate such a large current flow. When the Carrington event happened, that massive current pulse was then left with an open circuit at the end. According to ohms law, the already flowing current would have to drive the voltage towards infinity until discharge occured.
As for surge supressors, a workable solution if they are durable enough to shunt the whole surge. The problem is you can’t be sure just how much current that is. It’s hard to design to an unknown specification and expect it to work every time.
Note: This phenomena is something that made working on magnetic amplifiers spooky. If you had your test equipment hooked up and the load circuit suffered an “open” condition, if the coils were saturated and tried to dump the current into an infinite resistance, arcing was definitely possible.
I doubt if my solar system has enough wire between the panels (26 lengths of about 500mm) to accept much of a surge, although there is a lot of wire in the panels. I imagine surge protectors on sensitive electrical items like computers should handle it. My solar system in South Australia is monitored in real time by the manufacturer in China. They can shut it down remotely (as can I). Loss of contact for a while due to EMP might actually be a good thing. Mental note to remove the wireless modem when the war inevitably breaks out. My ICD is monitored from Berlin and they call my cardiologist from Germany if there are problems. If you told me my electricity production and consumption would be watched in China and my heart function from Germany 30 years ago I would have told you that you read too much science fiction.
I read that as ‘the solar system’ – I was thinking of stringing long wires between planets to collect power
I’ve lost electronic equipment to the magnetic pulse from nearby lightning strikes. Mainly the communications chip cooks and the network switch is rendered dead within a few days. Only once have I had a strike close enough to magnetize part of the grid mask in a color TV. Fortunately for the TV, CRT based models have a degaussing coil around the face that sends a degaussing pulse whenever the TV is turned on, so the color skew/smear on the TV went away after a few days of operation.
In my opinion, network segments with the longer cable drops are the most susceptible and will likely be the first indication that the system was affected.
Years ago, I had a client that was loosing network equipment during every lightning storm. It seems that the Radio tower across the street from them was a popular strike point for lightning. Putting surge devices on their network cable runs reduced their equipment losses considerably. At the time, APC was one manufacturer that carried them. ( PNET1GB ) Evidently they still carry them, but they are listed as “Call for Availability” so I don’t know how long they will keep supplying them. Usually that means “Discontinued” or near to it. Amazon shows them at below MSRP.
Eruption on Mars?
https://www.dailycaller.com/2018/10/26/mars-plume-like-cloud/
Mac
I wonder if there is any possibility of some residual thermal activity causing the release of aerosols from Arsia Mons that is contributing to this cloud formation?
It’s most likely to be orographic as Arsia Mons is 20km high(!) but the issue of the methane spikes on Mars has never been put to bed, so the possibility of some sort of emission should not be ignored.
Just a water or carbon dioxide cloud caused by topography uplift
Mars is smaller than earth. That means that Mars cooled faster
Its unlikley to be geologicaly active today.
I’m surprised.. despite how far north Stockholm is… ( same as northen Canada and Siberia ) … haves so little Aurore.. or maybe its the light pollution
That is because the aurora is centred around the magnetic pole, not the real pole. The magnetic pole is north of Canada. Places in Canada and the US are much closer to it than places at the same latitude in Europe.
pretty hot on the sun… take a lump of granite and that woud vaporize in the photosphere… its that hot
Yet the hellish heat… makes our weather and makes our food
Thanks for that one on solar flares, Albert, made me want to go and re-read that Larry Niven short story from the 70s ‘Inconstant Moon’ A mega-flare; Niven’s protagonist, on the night side of Earth at that moment, thought for much of the story that the Sun had gone nova Don’t know how credible his science is but Niven has a rep as a solidly ‘hard-science’ SF author
It’s a shame not to mention it…. but Dr. Leif Svalgaard has just released a paper on “Up to Nine Millennia of Multimessenger Solar Activity”
Essentially 9000 years of reconstructed solar activity. If you notice in his citations, Usoskin et al have written quite a bit on grand minima and maxima
Fascinating. Based on the minima being self-limiting in duration and the maxima not, I would submit that a process is occurring not unlike those in a reservoir with a river inflow and a dam or a weir at the outflow end. Blockages can cause reduced outflow but are self-limiting as the water overtops the dam eventually, whereas high-flow periods may be caused by high-flow periods of the river feeding the system.
In solar dynamics terms, this would suggest that the cause of maxima lies with secular variations in the energy production of the core, with the lower production rates corresponding to a lack of a grand maximum and the higher production rates with the presence of one. On the other hand, minima result from a reduction in energy transfer efficiency somewhere between core and surface. The interface between the radiative layer and the bottom of the convective layer is an obvious place to look for such, as the energy transfer changes primary mechanism here. However a reduction in transfer efficiency would be self-limiting as the temperature gradient across the transition mechanism increased, eventually fueling enhanced convection above. The bimodal distribution of minimum durations may indicate two separate types of blockages can occur, possibly at different locations, with different capacities to absorb energy before spillover occurs and restores solar output to normal; perhaps one at the bottom and one near the top of the convective layer, or maybe one at the core’s top and one at the bottom of the convective layer.
I like that idea. Possibly a change in convective patterns/modes?
The energy production in the core is constant and does not show secular variations over these time scales. This comes from the physics of the nuclear burning region. The cause of the solar cycle lies in the convective envelope only.
Is that a certainty? The Sun could be, ever so slightly, a variable star, could it not? The only way to absolutely rule that out would be to directly measure core activity. The only way to do that is to observe solar neutrinos, and we haven’t been doing that long enough yet to rule out variations on those time scales.
On the other hand, that does mean it’s unlikely that this question can be settled definitively within either of our remaining lifetimes. Once we have a few hundred years of continuous or near-continuous neutrino data then we can be sure.
On the gripping hand, most variable-star mechanisms (e.g. oscillating about the radiative-balance equilibrium instead of sitting right on it) produce periodicity rather than a stochastic pattern.
The problem with explaining grand maxima without such variations is that the lack of a sharp upper cutoff on the durations of non-grand-maximum periods seems inconsistent with any mechanism involving blockage of energy transfer — the dam should be overtopped after long enough.
There are variable stars, but those are not due to variable core activity: the nuclear burning is stable in these stars. The variability invariably is due to the transport of the energy through the envelopes. Luckily, that effect in the Sun is so small to be effectively non-existent. The habitability of our Earth is quite dependent on the constancy of the Sun! Variable stars form sequences on the HR diagram. On that diagram, the Sun is well away from those sequences.
The 11-year solar cycle has to do with an exchange between toroidal and poloidal magnetic field. But very little energy is involved and the actual energy output of the Sun is barely affected: it varies by 0.1% between solar maximum and minimum.
This one will cause a significant increase in the CSM plot…
Saturday
27.10.2018 23:18:49 64.395 -17.323 4.0 km 2.6 99.0 2.6 km WSW of Grímsfjall
https://gizmodo.com/hubble-telescope-s-broken-gyroscope-seemingly-fixed-aft-1829934018
Gunung Agung might be up to something. A few days ago there was a deep tectonic quake in the area north of the volcano where the magma storage is believed to be located. Since then, the number of deep and shallow volcanic quakes has been increasing, indicating magma on the move inside the volcano. It reminds me a bit of the activity before the strombolian blast in the beginning of July.
https://www.facebook.com/photo.php?fbid=10156432874015622&set=ms.c.eJxllMttBEAIQzuK~_MP039gqUS7rd7VgsLEZN~_~_pjNvsZxPx4~%3B~%3BI81j~%3BQm6rpxUJIOiaVWQDiMk7uQ7EpCsPs64FmT1l~_PSdeinI5Wt9R2vaVPt1adep0jVVuq5K21FjUJENpKBCGW5gY6bTC3y2Fgx1egc411O~%3BAkkw9auTfDR1XfCiUmsam2~_ddTNAdId7usMe9SKeKt3VJBwy1qjp0dTt3vdVRu33Nn4RRw22~_nQbaepgwuWEy~_man4TvB78Gme~_HGj~_93IA7uIsJ5fzAJ3EXifyc43JRM~%3Bz9AiqYscIPyenwa~_av6wNMtCDn.bps.a.10156432872865622&type=3&theater
Fissure 17 and other early vents. Its incredible how green everything is already.
Fissure 17 cone is actually a lot bigger than I thought it was based on distant glimpses in older videos, its probably a few hundred meters wide at the base and ~50 meters high. I think that now people are able to get to pohoiki more easily they are going exploring and going back up to the first vents. Fissure 8 is already well known to be getting a name but 17 and 22 are equally imposing and likely will too now.
You have to wonder what would happen if a Carrington style event happened during a geomagnetic reversal.
A kicking for the ozone layer and a subsequent spike in skin cancer would be a reasonable bet!
Would some of the tech impact be potentially mitigated with a very weak magnetic field? I.e the energy would be dispersed globally rather than funneled to the poles?
Probably loose a bit of atmosphere from the top layers.
Well, I suppose sunspots count as solar volcanoes…
Flares, yes, spots, not so much. Spots form as the magnetic field lines become so intense that plasma is pushed out of the tube and off to the side. Below about 1500 Gauss, plasma can leak back into the tube of magnetic flux and diminish the contrast of the spot and increase it’s brightness. This is something Livingston and Penn were looking at.
By measuring the Zeeman effect in the Fe spectral lines, you can get an estimate of the field intensity. What they found was a bit strange since it didn’t quite seem to line up with the well known Hale cycle. (aka, sunspot cycle)
Had this “Thing” continued without shallowing out, it wouldn’t have mattered how many twisted flux tubes there were, they wouldn’t make a visually discernible spot.
But, for a better discussion about it from some guys who actually know this stuff;
DECREASING SUNSPOT MAGNETIC FIELDS EXPLAIN UNIQUE 10.7 cm RADIO FLUX
Note: If Albert has anything to say in this matter, he is just as adept in that field as these guys (possibly more so), so listen to him.
Now, I am well outside my knowledge zone, so take this with a grain of salt (or the whole salt-lick).
It is possible, that phenomena, whatever is is or whatever causes it, may be connected to abnormally low sunspot cycle counts. Back during the Maunder Minimum, there were a few periods when the sunspot count should have gone up (from a present day view) but didn’t. This has been though to have been an ultra long single period, or two diminished shorter periods jammed up against each other. Dominant thinking is towards the latter scenario. Another trending thought is that the sunspot count doesn’t related to global weather, but the duration of the cycles do.
Again, I emphasize, this is NOT my area of knowledge and for the most part, is just opinion by a non expert.
In a nutshell; I haven’t got a clue, but that’s my take on it.
From the Livingston, Penn, & Svalgaard paper The Astrophysical Journal Letters, 757:L8 (4pp), 2012 September 20
“And while there is no physical mechanism which suggests that we should extrapolate further, it is fascinating to see that the sunspot for-
mation fraction would drop below 0.2 by 2020. This would suggest that although magnetic flux would be erupting at the solar surface during Cycle 25, only a small fraction of it would be strong enough to form visible sunspots or pores”
2020 is only just after solar minimum, with few to no sun spots. A low fraction of zero is still zero – no change there. But looking at the paper, they predict almost no sun spots in cycle 25 which comes after 2020. That is a testable prediction. However, the author has recently provided a new prediction for cycle 25 which is above the (weak) cycle 24. Other people have claimed cycle 25 will be exceptionally weak, albeit on very dubious trend projections. Finally, in the last months there have been a few sun spots which have polarity belonging to the next cycle, as if cycle 25 has started ahead if schedule. Everyone is waiting to see what will happen!
{Snicker} Nice description!
“Helioseismology is a fancy way of saying that we can learn about the Sun by “listening” to it. Astonomers listen to the Sun’s heartbeat to learn about the inside of the Sun, just like seismologists learn about the interior of the Earth by “listening” to earthquakes. (But for helioseismologists their job is a lot tougher: like figuring out how a piano is made by listening to it fall down the stairs!) ”
http://solar-center.stanford.edu/about/helioseismology.html
This is something that I have thought about regarding the naming of kilauea. Mauna loa means long mountain, a sensible description. Mauna kea means white mountain, also very accurate. Kilauea means either far spreading or spewing. One of these is rather ambiguous, but spewing denotes a rather vigorous action. This could be interpreted as evidence kilaueas summit eruptions werent always slow effusion of lava lakes and tube fed flows, but sometimes much more powerful and sent fast lava flows over the landscape. This has evidently not happened in the past few hundred years as the most recent summit flows were tube fed, but maybe underneath these flows there might be more a’a and channelized flows. Kilauea iki exposes scoria deposited by lava fountains, this is proof at least part of the aila’au eruption was not so slow, or at least that eruptions had occurred in this area before then and were more vigorous than the eruptions that made the shield. 1959 is even better evidence this area can do big eruptions. Mauna ulu is also evidence, its elevation difference to the summit is pretty trivial (~100 meters) compared to how big the eruption was.
It is already well known and historically documented up to the modern day that eruptions within the deep calderas were extremely violent and included massive lava fountains and in many cases sizable tephra production or even just straight up explosive activity, but it is never assumed that this could actually happen when there is no true caldera. The very biggest eruptions would have happened regardless of whether there was a few hundred meters of extra rock above them.
Even during pu’u o’o there were brief periods where activity really ramped up even while normal tube-fed flows were still going. In 1998 this occurred, sending a channelised flow to the coastal plain within hours, the same thing happened in 1992 several times, in 1997, 2002, 2004, 2005, 2007 and twice in 2011. Particularly 2011 and 2007 were quite huge floods of lava even if they only flowed at that rate for a few weeks or less, who is to say similar things didnt happen when the summit overflows were going. The size of some of the summit overflows is also pretty important, the aila’au flows are really wide, while the june 27 flow always stayed narrow except when it started to self destruct. this seems to indicate the flow rate might have been higher and the initial flow more of a sheet flow than like pu’u o’o flows.
I don’t think the width of a flow is a good way to estimate the flow rates, pahoehoe flows tend to be very wide even when formed at lower rates than channelised flows. The morphology of the flow can be a better indicative of the rates during its emplacement, lava tube fed pahoehoe flows usually form at 10 m³/s or lower, known from observations of the Pu’u’o’o eruption. At higher rates aa flows start forming that are usually feeded by a perched channel at the higher part of the field. The width of the channel part of the perched channel flow maybe could be used as a way to infer the eruptive rates, the ones that reach maximum widths of more than 100 m like Fissure 8 or the usual flows at Alayta would form at higher rates than most perched channels that have maximum widths of a few tens of meters. But it would also need to be considered if the eruption was feeding more than one flow at the same time and if the channels were fast flowing or ponded. That is seen at fissure 8 where the flow rate would be constant along all the channel but the width was not, being much more wider at those areas where the lava ponded. Most lava flows of Aila’au are tube fed some of them are huge, the lava tube of the Kazumura flow is 65.5 km long and the total flow lenght would probably reach around 80 km adding the strecht from the vent to the start of the tube and the one from the end of the tube to the ocean plus the length of the underwater lobe. It is still though a tube fed flow and the width of the tube itself is much more smaller than the usual perched flows so formed at lower rates than other shorter and narrower flows that were less long-lived.
The reason why explosive events are thought to happen within deep calderas is because you will not find major explosive events dated contemporary to the Observatory Shield. 1959 also happened within some sort of caldera. The stories of native hawaiians also usually correlate the presence of a caldera with explosive events and some are a quite clear correlation between the presence of a lake and a explosive eruption.
A lake would need a deep caldera to form yes, but an eruption like 1959 would have happened regardless of whether there was a deep caldera near it. Maybe most of the time there was quiet effusion, but I think if this ever stopped for a period of time long enough to reduce gas emissions to low levels (like right now) then resumption of activity would probably be quite vigorous. This is best demonstrated by mauna ulu in its last months, still feeding tube fed pahoehoe but undergoing several episodes of high fountaining, some of it reaching over 100 meters high, and sending channelized a’a flows down its flanks. This was one of the things I imagined could happen at pu’u o’o way back in April before all the events happened, but as that event shows you can have a stable vent suddenly transition back to fountaining.
Kazamura is also way wider than most of the lava tubes from pu’u o’o. Most pu’u o’o lava tubes were maybe 2-3 meters wide while kazamura is at least 5-6 from what I have seen in pictures. Nahuku is also huge, it probably connected to kazamura at some point before diverting. The width that pahoehoe flows have also does probably correlate with eruption rate, not as well as those other factors but it isn’t unrelated. The aila’au flows must have been formed at a higher rate than what pu’u o’o was doing. The June 27 flow got to 23 km long before stalling out, some of the other earlier flows could have probably reached as far as 40 km, but that is still rather short of the aila’au flows. the area north of the east rift is extremely flat too, so if the lava was erupted passively even at a fairly high rate it would be able to stay as pahoehoe, if pu’u o’o erupted at a similar rate it would have turned into a’a by flowing down a steep slope. High fountains won’t make a’a if the lava doesn’t rush off, this year is a good example, 1959 is even better. Eruption rates quite a lot higher than would usually be expected could probably happen on a flat area like that without having the lava transition to a’a.
ot….. does this look like Alaska is trying to leave North America.. https://earthquake.usgs.gov/earthquakes/map/#%7B“autoUpdate”%3A%5B”autoUpdate”%5D%2C”basemap”%3A”grayscale”%2C”feed”%3A”1day_m25″%2C”listFormat”%3A”default”%2C”mapposition”%3A%5B%5B33.65120829920497%2
At the suns middle… is the plasma solid or liquid?
the pressures and temperatures and denisities are enromous
I wouldn’t know where to start with the maths, but presumably at the centre of a sphere the gravitational forces on an object would be outwards? Not sure what a plot of depth v pressure would be like deep inside a large object, possibly stratification and thermal transfers would come into play, as it seems intuitively unlikely that the pressure decreases towards the centre
https://en.wikipedia.org/wiki/State_of_matter
It’s neither solid or liquid, it’s a plasma.
;o)
According to a book I read on helioseismology, at a certain depth, the sun reverts to solid body rotation. At the “surface” what we see is that the equatorial regions move faster than the polar regions. The differential flow between these two regions {tachocline} give us tangled magnetic flux lines that then generate sunspots when they breach the “surface.”
I can’t remember the exact name of the book, but it was a great read, it was more like a history of helioseismology and the various advances that were made in observational technology to weasel out more info from the sun.
I think it was “Sunquakes: Probing the interior of the sun”
Cross sectional Rotation profile of the Sun from wikipedia as determined by the Solar Dynamics Observatory.
11 times denser than lead, it is not a solid technically but it would appear solid if you could isolate it.
It is like how neutron stars are technically not solid but neutronium (yes that is what it is actually called) is the most rigid and ‘solid’ material that exists in this universe.
The sun has an average density a bit higher than water, some stars have densities higher than any solid we know can exist at standard conditions. The biggest star we know of is in the large magellanic cloud and it is 350 times the mass of the sun, extends almost to the orbit of Mars and has a density as high as lead, and it is still in its main sequence, or was recently anyway. This star which I forgot the name of (R43a1?) could have an entire solar system made of other stars.
A main sequence ultraviolet hypergiant that was born bigger than the sun will ever be and is bright enough it could outshine entire small galaxies. In a million years is going to go hypernova and tell the whole universe about it. Actually hypernova might not cut it… Ultranova might be better.
R136a1 is what it is called, it also isn’t actually as big in most of those dimensions as I thought, but it is still an object that is 315 suns and 60,000 K that you could fit 2.7 billion earths inside…
There is a really hot star in the milky way that is less massive but really is bigger than mars orbit, it is called the pistol star. It is much further into its life cycle than R136a1 though, it will probably go (impressive word)nova in the next few hundred thousand years. It radiates the same energy as the sun does in 1 year, in 20 seconds… It would take only a second or so for the pistol star to make enough energy to exceed the earths gravitational unbinding energy.
Neutronium is technically a liquid, not a solid, and it is not rigid but will flow even inside a neutron star. We did once find a star considerably larger than the one you mention, although not nearly as massive. It would have filled the solar system out to Saturn.
UY Scuti is the one you are talking about I presume. That is the star with the biggest averaged diameter. Some have potential to be bigger but are more likely not bigger. All those giant stars are basically almost a vacuum with very energetic particles in it though, there is no surface of any real description.
No, it is about the same size but in the magellanic clouds. It has the exciting name WOH G64
what an extreme enviroment that is!
take a 1 meters sized cube from suns core and place it on earth
It woud vaporize anything it comes to toutch. melt its way through the crust.
It woud also decompress in an enormous explosion
That cube would weigh about 150 tons and have a temperature in excess of 10 million K. The energy in it is perhaps around 10^12 J. To put it in context, that would cover the world’s energy use for about 1 second.
The Sun does not actually produce that much energy per kilogram: it produces less than a human body does. The total amount of energy is large because the sun is so big. Imagine the earth is as big as a tennis ball. On that scale, a human is about 1 micron in size, i.e. a thousand times smaller than a bacterium. And on that scale the sun is the size of a decent building.
I’ve read elsewhere that a single photon traveling from the deep interior of the Sun can take hundreds of years to make it to the surface from all of the reflections, absorptions and re-emissions that it has to travel.
It takes much longer than that! It is a arduous journey for the photon
And that arduous journey takes its toll, a photon that starts off as an extremely energetic gamma ray in the core ends up in the visible spectrum when it reaches the surface (ca a millionth of the energy it started out with).
PS – another good post Albert (as always) – many thanks.
So, HYPOTHETICALLY speaking…
If for some unknown magical reason, the sun instantly stopped fusion, it would take thousands of years for the light to stop making it to the surface, and then a bit over 8 minutes for the cessation of light to reach us from photosphere?
For all, this is noted as “magical” by me since I’m pretty sure that it’s gonna be a gradual process. Things get interesting near stellar death and the Sun is about middle aged. As for the term “light,” I am referring to light in the strictest sense. That includes infra-red to x-ray wavelengths. Absorption and re-emission can change that wavelength depending on the atoms involved. Similar to the fact that the phosphor in a fluorescent bulb converts the UV photons emitted by the gas in the bulb to visible wavelength photons.
And something that used to trip out my students… if you are in a room with only florescent lighting, technically, the room is totally dark about 50 to 60 times per second, depending on what your power line frequency is. (This would be affected by the “persistence” of the phosphor. Long persistence phosphor is typically used on radar display CRTs.) I’m not sure how that relates to the phosphor used in florescent bulbs.
It takes around 1 million years I think.
The sun is all made of material that is hot enough to glow with incandescence anyway so the sun would take a very long time to actually stop emitting light and if fusion stops it will start collapsing before reigniting itself. This is what actually happens in the later part of a sun-like stars life, it will do this maybe a few times but when it runs out of helium it wont be able to do much with the carbon (maybe fuse a bit but not enough) and so will run out of energy. Its core will compress due to gravity and I think that rebound will blow off the outer layers of the star. In bigger stars around 8 suns mass this rebound is usually much more violent and that is a supernova. Red dwarfs just slowly lose energy over trillions of years and their own gravity crushes them into a white dwarf directly. Small stars like proxima centauri have surface gravity in the hundreds of g’s
If you want to see what the sun will look like as a red giant you can look at arcturus or aldebaran, both are red giants and probably looked like the sun.
IIRC, there is a long, long time between a fusion gamma’s formation and its energy reaching the ‘surface’ as visible radiation. But, the neutrino flux would shut off within a very short time. This was why the on-going shortfall of solar neutrinos was so concerning. That led to discovery that neutrinos switch types as they go, so must have non-zero mass. IIRC, the latter is still the bane of concerned theorists…
And, yes, I remember reading Niven’s short ‘Inconstant Moon’. AFAIK, he never gave any reason why he did not spin a novel or series from it…
The sun isnt going to shut off, all stars are variable stars, some are way more variable than the sun and manage to complete their lives without problems. On the scale of stars things just really arent that complicated, they are born, predictably burn their hydrogen according to their mass, then die again according to their mass.
If the sun actually did shut off fusion for a bit then its core would contract and almost immediately reignite, that probably happens all the time and is part of why it self sustains. Nothing noticeable will happen until the sun goes through the helium flash, where its core is made of helium and eventually that accumulates enough mass to ignite itself completely at the same time, making the star flare up in brightness by several times
cube of death! if it coud be keept stable .. it woud be an excllent tool of making tunnels in mountains
You’d need an incredibly powerful magnetic field to hold all that plasma in, I think!
R136a1 is a monster star… what is its center temperature?
Of course our sun is a variable star. A variation of 0,1% energy measured on OUR planet does not confirm the stability. Measurements at the outskirts of our athmosphere and in space indeed does. Without the effects of our athmosphere we would simply not be able to withstand the apx. 11 year intervals between solar minimum and solar maximum.
Se for yourselves:
Background: https://spaceweatherarchive.com/2018/10/26/a-new-space-weather-metric/
As for radiation from space it is during solar minimum this becomes an increased risk to both space travel and aviation. Because of the weakened magnetic shield surrounding planet Earth. Coronal coles are the main threats to exposure during solar minimum because of this reduced magnetic shielding of our planet.
https://spaceweatherarchive.com/2018/09/27/the-chill-of-solar-minimum/
https://spaceweatherarchive.com/2018/06/15/what-is-e-rad/
http://news.spaceweather.com/earths-magnetic-field-is-changing/
So then. The big question; does a reduced magnetic shielding allowing millions of unclassified (CERN) different particles, neutrons, rays, myons aso. have and impact on volcanic activity?
Some studies state that +VEI5 eruptions to a high degree of certainty are overrepresented during a less active sun. Typically SN<50.
https://www.sciencedirect.com/science/article/pii/S1342937X10001966?via%3Dihub
https://www.sciencedirect.com/science/article/pii/S2090123217300334
I know there is an italian study too, but can't seem to find it now.
I find the possible link interresting . Others probably not. Up to 2022 should be able to tell us more. The mechanism behind might be energized particles not yet maped out that penetrate much further down beneath ground surface than prior known. CERN says the are probably a million different. Of which only a few are mapped… Add some extra energy to a kettle only close to boiling, and it boils. The essence of the theory. Who really knows.
Good and interresting piece on solar activity. 😉
This was held for approval by the system. I happens for various reasons: new commenters, too many links etc. Hereby released – admin
You may be combining different things here. The variation of 0.1% in luminosity is not measured from the ground. It is too small for that. It is measured by space satellites, outside our atmosphere. The solar cycle is a clear variation, but it has very little effect on total luminosity. It is seen mainly in the high energy radiation and particles, important for the top of our atmosphere but it accounts for a very small fraction of the total solar energy.
The effect on the thermosphere (100 km up) is real and strong, and in fact is important for survival of near-earth satellites. There is an effect lower down on 14C production. That is indirect, because the penetration of cosmic rays into the solar system varies a bit with the solar wind. It is a small effect but measurable. But the proposed effect on volcanoes is speculative to the extreme and cannot work. People are finding it hard enough to argue for any effect on cloud formation. By the way, the fact that the nature of the cosmic rays are not known does not mean we don’t know what they are: there is a limited set of options (mainly protons), but we haven’t measured it for individual particles.
So the solar wind and high-energy particles vary quite a bit with time, but the total solar energy does not, and the variations affects the upper reaches of the atmosphere but not the ground – and certainly not below ground. IMO.
The difference in recorded temperature @500 km. above groundlevel is apx. 400 deg. K. between strong solar maximum and weak solar minimum (see link above). I would can that rather variable no matter how you choose to look at it.
TSI is measured in the mesosphere. TCI in the thermosphere. Huge difference. The recorded IR-energy (W) fluctuates 11 times between the highest recorded to right now. Huge fluctuation in energyrealese.
Of course the temperature is high in the thermosphere! How else could you get aurora? But the density is almost non-existent: at 100 km altitude, it is down to 1 millionth of that on the ground, and above that it keeps falling fast. Pressure becomes undefined there as the particles are so far apart they no longer collide. Say the density is 10^-9 of that on the ground and the temperature 2000 K. Then the energy in the (for want of a better word) air in the entire exosphere is a tenth of a millionth of that of the lower atmosphere. Even fluctuations of a factor of 11 leave the region irrelevant for our energy budget.
A change in temperature of 400 K at 500 km would involve the same amount of energy as a change in air temperature on the ground of around 0.0004 K. Your ‘huge difference’ is in a exceedingly small quantity. It is like the UK government spending 20 pounds more this year. Even if that particular item went up from 2 pounds before, the change to the national deficit is unmeasurable.
The solar irradiance is the energy in photons that reach us and there is no difference between 100 km and 500 km up.
You are actually answering to a completely different thing than I describe. I am not explaining OUR planets energybudget. I explained the large difference in recorded temperature on the outskirts of our athmosphere beeing (@ 500 km above earth)
a) apx. 760 degK at solar minimum.
b) apx. 1160 deg.K at solar maximum.
The energy is estimated at 33 billion watts as per now in the thermosphere. 11 times that at solar maximum. Scientists at NASA state this. Not me.
Of course the difference is miniscule at ground level. Due to our athmosphere. But forget our planet for a secound. I explain the change in solar output as an effect in space (or close to). Not the levelling of this on the surface of our planet due to pressure….
I see what you mean. But the amount of 33 billion W may sound a lot, it is tiny. It corresponds to a fraction of 3 10-07 of the solar energy reaching the earth. the reason such a small amount has such a large effect on the outermost ‘air’ is that there is so little gas there.
I wouldn’t exactly call 33 gigawatts “tiny”. It’s enough for 27 trips back to the future, after all, with a bit left over…
Getting to the future is easy. It is getting back that is difficult.
Dark energy? 😊
Solar maximum for the 2024 total solar eclipse?!
I remeber the summers wildfire smokey sunsets here. The smoke and evening.. turned the sun to a deep red ball that was fun to look at. It looked like a cannonball in the sky that was heated to glow red.
A similar sun I watched during the spain wildfires that got smoke up here in sweden
Would you call the highly compressed matter/energy that comprises a black hole neutronium, or has the substance of a black hole disappeared up its own rectum to the point it defies existence and a name?
Terms like substance and matter loose any kind of meaning if you are dealing with a singularity. In fact everything we perceive about the universe looses meaning when dealing with a singularity.
Whether black holes, the high mass/low volume objects we appear to observe in galactic centres and x-ray emitters, are truly singularities is a different matter. I hasten to add i have no knowledge on this matter other than what is published in popular science, but i am aware of arguments/conjecture that black holes may be some form degenerate matter rather than a true singularity. Hopefully Albert will be able to expand, verify or rebut what i’ve just written. Maybe even the subject for a post while the volcanic gods and dragons are being quite?
We have no words or concepts for conditions in a black hole singularity. But to give a comparison: in a black hole, matter (or for that matter, photons) can only go one way: to the centre. It is equivalent to how we experience time: there is only one way, forward. But we don’t experience the flow of time as ‘pressure’.
You’ve obviously never tried printing a report due at 8:30 am the next day and gotten a scary disk error on the first attempt then. 🙂
Backups are your friend…
But, I have seen two drives in error status in a Raid-5 array with a 3rd drive in a Raid-0 on the same controller ready to fail.
(For them that don’t know, Raid 5 maintains two copies of the data and a checksum so that the set can be rebuilt if one of the volumes fails. Loose two, and it’s kaput.)
Just go with the flow…towards the singularity.. for this post, make that the sungularity..
I don’t think there is any danger of the sun contracting its mass within it’s Schwarzschild radius… (2.95×10³m)
Buahah!… Schwarzschild radius for a Big Mac™ → 3.19×10⁻²⁸m
This is my current belief:
https://en.wikipedia.org/wiki/Planck_star
Irrespective of size and quantum; and whether or not a singularity is a largish lump of a highly compressed and as yet unnamed substance with very little or no space between its component stuff, a black hole is something other than nothing. It has mass and a lot of it. It has gravity. It has location. It effects things outside of it for a considerable distance; perhaps light years. It has substance; and is at least a substantial energy form. I think that substance warrants a name.
A black hole is pure potential. Some contain the remaining mass of many stars and planets; some entire galaxies; many of which may have had potential for life and sophisticated civilizations. If it could explode; which at least one large black hole singularity containing the mass and energy of our own universe has done; perhaps as the result of a head on collision with a similar sized black hole; a sizable black hole could produce any number of universes and events. It has binary information. That lump of nothing and something other than nothing can be rearranged in every way you can arrange 0 and 1; and perhaps then some. It strikes me that the substance of a black hole is possibility itself.
I’d argue that time is the interval between events. Events have progression and direction; not time; but that is probably splitting hairs.
R136a1 is a monster star… what is its center temperature?
its sure is pretty hot
There was an update today from HVO, and kilauea is currently producing the least amount of SO2 since 1982 before pu’u o’o, only 50 tons per day from the summit and pu’u o’o each. This means that there is no gas rich near surface magma anywhere but it also means that the next eruption will probably be quite vigorous as there is no degassing anywhere.
There was some very interesting stuff that was talked about by John yesterday too, stuff about the possibility of the east rift being fed from depth within the deep rift (which I think is true in my opinion) and not primarily from the summit reservoir, and also about stealthy eruptions where the magma could erupt with very little warning at any point along the dike where there have been recent vents. This obviously has big implications, and while this hasn’t happened after previous LERZ eruptions in historical time it could have happened in the 1790 event which would explain why there are two rifts in that event. The fact that the magma supply rate from depth has generally been increasing over the past 200 years would also lend support to the idea of fast recovery and potential resumption of activity. Mauna ulu resumed after 3 months and it has been about that long since fissure 8 last erupted, and this years eruption was a lot more energetic than mauna ulu (1 km3 of magma in 3 months is a lot of heating) so the area will stay hot for a long time and so eruption anywhere along the new dike could happen quickly.
“some very interesting stuff that was talked about by John yesterday”
John who? Someone from HVO from the context?
“the possibility of the east rift being fed from depth within the deep rift (which I think is true in my opinion) and not primarily from the summit reservoir”
There’s no evidence of that – that I’m aware of – from the most recent eruption. It initially erupted compositions consistent with old magma that had been stored in the LERZ for a decent amount of time, then transitioned to a composition pretty indistinguishable from summit magma, which constituted the vast bulk of the eruption. And the estimated volume erupted was a good match for the estimated volume lost from the summit.
The rest of your comment I pretty much agree with.
Yes, it is more accepted that the east rift is feeded by a conduit ~3 km deep that starts from the summit reservoir of the south caldera area, the most recent eruption probably started from the Pu’u’o’o shallow reservoir that collapsed and then the deflation area propagated uprift until it reached the summit. Most historic eruptions would be explained to be sourced from the conduit, but there is some evidence that some intrusions can use a deeper part of the rift like 1840 when the vents in the LERZ were very rich in olivine phenocrysts thought to have settled in the deeper levels of the rift zone.
Another massive hawaii-related comment wall by me, enjoy 🙂
John is John Stallman, he has done some live videos on facebook and also with Philip Ong and Ikaika Marzo. Yesterday he did a live video talking about the less than ideal but very viable circumstances of what could happen as a result of this inflation within the east rift.
I should clarify that I dont think the east rift eruptions are fed from a separate source, but rather that the magma chamber under the caldera at 3 km deep is not the only way for magma to enter the rifts. My reasoning is because there was some interpretation of the magma being able to intrude down from a tube-like conduit midway within the volcano which is somehow kept hot and fluid all the way to kapoho (how this happens is never explained though). I have problems with this, mainly how there would be a tube shape when the stress field is going to create an elongated vertical shape reminiscent of a very wide dike, but also that if magma intruded down, it would just fill in that spot, and if this keeps going then you end up with a deep conduit anyway. At that depth magma basically doesnt cool down at all on the timescales eruptions usually happen, 1955 magma included samples that were derived from stored magma which had been there for centuries, and that is far from the summit, areas near the summit have probably never cooled down. 1959 already proves that some magma bypasses the summit, and the 1959 magma actually erupted at the summit, it would seem pretty sensible to assume that magma would intrude through the deeper parts of the rift, especially as there is assumed to still be some low pressure zone at that depth that somehow allows magma to intrude down from the central conduit in the common model.
1840 was deep fed, and 1960 probably was too. 1960 erupted lava similar to the almost ultramafic kilauea iki lava from a month earlier, and instead of moving laterally along the rift it was probably moving up from the deep rift. Earthquakes preceding both the 1955 and 1960 eruptions only started beyond heiheiahulu, earthquakes this year were traceable from pu’u o’o before that point, but in 1955 or 1960 there had been no eruptions on the middle rift except two tiny events in the 1920s so there was no big conduit to move through, especially as back then it was assumed that eruptions would have to start happening in the upper and middle rifts before a LERZ eruption was possible.
1924 also started showing quakes and ground deformation only beyond heiheiahulu and seems to have been very deep set based on how much the summit deflated. Heiheiahulu is where shields stop, above that there are a number of long lived vents including two in historic time but below that all eruptions are large and fast like this year. The shields are fed from long lived stable sources, and maybe that is from a large fairly deep partly molten and interacting chamber which extends within the rifts from the base normal fault up towards the surface, and summit to a certain distance down the rift (about where heiheiahulu is), within this there are more molten pockets, a main one under the summit but smaller ones under makaopuhi and napau, and probably kilauea iki, mauna ulu, pu’u o’o and heiheiahulu too. The upper depth of this structure could lie around 3 km deep and appear as though it is a tube.
Another way to look at it, kilauea is the worlds most productive volcano, and the amount of lava it is supplied with each year is about an order of magnitue higher than any other volcano like it. Kilauea erupts anywhere from 700 to 2500 km3 of lava every 10,000 years, most volcanoes would take 10-100 times as long to do that. The feed rate of big calderas and supervolcanoes is tiny compared to that, yet it is able to melt bedrock and form massive silicic magma chambers, it would be really strange to think the magma feeding kilauea – which is twice as hot and fed at 50 to 200 times the rate- wouldn’t present any sort of heating effect on the rock around it as the popular model implies. The east rift is like a superheated version of the south Iceland dead zone, it is the same level of heating but 100+ times as often. PGV even found molten magma 50 km from the summit in an exploratory well, and that was magma that had been there for centuries not doing anything.
+1 for recognizing the WoT.
It’s on Blog topic and informative. No penalty phase, no power play for the opposing team.
I see öræfajökull has been popping away with a small earthquake swarm. Drumplots don’t show much activity, though. I’ve a feeling we might be closing on the final push to eruption.
…And I’m wondering if there is a further small intrusion at Herdubreid. Multiple small events between approx 14 and 3.2 km. The pattern here seems to have become shallower, as I believe, I may be wrong, that earlier in the year the shallowest quakes were around 4.5 to 5km depth.
I would welcome any views on this.
Whilst it does form a nice stack from ~16 km up to the surface, the energy levels involved are very small. As a rough estimate of the >60 events in this area, most being around 0.5M and a few 1+M, it’s barely equivalent to just one earthquake at 2 M. If they were all 2 M and higher, I’d be more concerned. I’d put money on tectonic adjustments over anything magmatic, but I haven’t seen the waveforms yet.
Hmm… I see what you’re saying. It’s a tidy enough stack, but not exactly energised.
I’ll keep watching, but thanks. That begins to make some kind of sense to me.
When it does move into its final push, it’ll be very noisy. Remember when Bardy kicked off back in 2014 and the IMO map lit up like an xmas tree on acid? Keep a lookout for that.
https://www.youtube.com/watch?v=ANMTPF1blpQ&t=3s
We entering now prolonged solar minimum.
Eh… maybe. But using the definition of Usoskin et al, not anything like a grand minima.
And if you want to go the stats route, the next grand minima will probably be between 1963 and 2231 at the 95% confidence interval based on the previous grand minima noted in his paper. And if so, likely about 69 years in duration.
Additional stuff;
Grand minima of solar activity during the last millennia
“In our recent work (Usoskin et al. 2007) we have defined Grand minima of solar activity as periods when the (smoothed) sunspot number is ≤ 15 during at least 20 years or forms a clear dip (the depth ≥ 20 with respect to the surrounding level) with the bottom being ≤ 20 in sunspot numbers.”
I have often railed about Volcanoes not following a schedule. This is mainly because all the things that affect a volcanoes activity are based on so many variables, that is it truly, a chaotic system. The Sun, has many more variables that dictate how it behaves, and is even more of a chaotic system than volcanoes. The deal with chaotic systems, is that you can not fully model it’s behavior. You just can’t account for all of the things that drive it. You can try, but even the ancient Greeks had a goddess that dealt with Hubris → Nemesis.
About the best you can do with system like this, is to look at their long term behavior and guess at what they might do in the future. However, that DOES NOT mean that they will act as anticipated.
Blue Öyster Cult even included this idea in a song. “History shows again and again, how nature points up the folly of man” → Godzilla
And it’s not some all encompassing slam against humanity… it’s just that as a species, we are all very adept at performing a “face-plant.” Almost as if it were in our genes.
{snicker} From the Face-Plant definition; “Although wildly popular, the face plant is rarely performed on purpose.“
And this is me beating a dead horse.
If there is a non-zero probability of something happening, that means that over a long enough time period (approaching infinity), it has to happen.
That’s why if you see something extraordinarily odd or strange occur, don’t be surprised. It had to happen somewhere or to someone… eventually.
It’s like the old science saying: when you discover a cycle, the wheels start coming off.
New cams set up at Kilauea’s MERZ. Up- and down-rift of Puʻu Kaliu, and one at Mauna Ulu looking toward Makaopuhi. https://volcanoes.usgs.gov/volcanoes/kilauea/multimedia_webcams.html
The pu’u kaliu cams would have been great if they were there during the actual eruption
The mauna ulu cam was already there but I don’t know why it was very difficult to find. The new webcams in Leilani is a good idea since the action might move close to there in a close future and I imagine the Pu’u’o’o cams will be removed gradually if it doesn’t show any signs of reactivation.
I think they will probably keep some of the pu’u o’o cams, the one looking into the crater might be removed but probably only after a good long while, the cam looking uprift will probably stay as it combines with the mauna ulu cam to cover the middle section of the rift. This is probably not where the next eruption will happen but it is good to know for sure. The cam facing east that was installed to watch the 2013-2016 flows will probably stay because it is in prime view of a potential eruption and combines with the view from pu’u kaliu. This section of the rift is the spot to watch for, the new dike is going to be very open after having 1 km3 drain through it in a few months. A sustained shield opening on the south slope of heiheiahulu is really the only way this isn’t inevitably going to end in a disaster, a shield on the highway or just up from heiheiahulu is going to cover everything. The area between pu’u o’o (including under pu’u o’o) and heiheiahulu is quite old compared to the other stretches of rift so this might be primed for shield building.
And if someone builds a house and it turns out the installed cam is staring into someones window, HVO might secure the cam feed and reposition it.
I think it’s pretty unlikely that anyone will be building any new houses around there based entirely on the fact that the long feared potential for an eruption in the lower puna area has actually happened now, and so it isn’t just a far off memory from 1960 anymore but a new modern day risk. Maybe rebuilding destroyed houses would be more likely but I doubt that any new building permits will be happening in zone 1. It also seems plausible that a new vent would send lava through the rest of Leilani estates, so things might be just left as they are now.
If it’s not logical or makes sense… the odds are good that someone will try. It’s the way of Homo Stultus. “There can be only dumb.”
There was a very short update by Phil today that was mainly about some recent deformation. There was a deflation-inflation event this past few days which was not detected in the rift zone, which indicates that the summit is not connected at a very shallow depth with the east rift, and the magma accumulating in the east rift is being fed from somewhere below the summit complex. It will be very interesting to hear more on this but this could be a massive wild card as it could mean the summit and rift are somewhat disconnected at current and this years eruption was more than just a build up under pu’u o’o causing a big leak, but rather that the magma managed to get through at deeper levels. The1975 quake moved the entire volcano a few meters, and that includes the deep rift, and Kilauea was quite inactive for a few years afterwards. The quake this year might have done something similar but with way more magma involved it was able to erupt on a huge scale. This idea I guess also infers that pu’u o’o was fed at some depth, as was mauna ulu, and by extension this year too.
Maybe deep intrusions are fairly common and the apparent damage they caused in 1840 and 1924 was more an attribute of mauna loa waking up and taking over the hotspot. Mauna loas bigger eruptions are also known to have been quite deep sourced especially 1950 and 1868.
During the summit collapse events a pressure wave travelled trough the east rift zone quite fast reaching fissure 8 and causing the surges, that is better explained by a direct shallow connection between the summit reservoir complex and the east rift zone. The reason why the DI cycles are not showing up in the ERZ is probably because they are very faint anyways, the GPS still show no inflation from the summit only the tiltmeters are picking the signal of what presumably are deflation-inflation events. The structure of the east rift zone isn’t really figured out from what I think but I would say that at least there is more evidence for the ERZ being fed directly from the south caldera reservoir which is aswell connected (or was connected) to the shallower Halema’uma’u reservoir.
I have seen models that show the area under the summit to be very wide and that the east rift connects at many depths, with the main connection being around 3-5 km deep but that parts connect deeper and maybe shallower too. However I have some trouble seeing what could pose a barrier to magma moving laterally at depth when the pressure is removed. At the very least I would expect the 1868 quake to have opened the rift up at a depth below the main chamber, which would explain the lack of a large eruption – the tiny SWRZ eruption might have been from a bit of magma leaking through a quake fault. 1924 included deflation of the entire volcano, all the way down to the deep source as there was deflation measurable with 1924 technology all the way out to keaau, which is something like 70 km from halemaumau. 1840 was deeper than a lot of other intrusions too, there was no monitoring equipment then but the lava composition indicates a deeper than normal magma source. 1960 is believed to have also originated deeper than the 3 km deep chamber, probably combined with the 1959 picrite magma. 1955 might have been mostly 1924 magma except for the upper vents near heiheiahulu. This year the magma started at pu’u o’o but probably pretty deep under it,
It also doesn’t look like there is actually any way for a shallow (<3 km) connection between the east rift and summit. The cracks inbetween the summit and volcanic part of the east rift are at angles to the proposed connection. As far as I know there is no actual proof the dike goes through this area, I don't know how magma gets through but it might be a combination of deep feeding from below the surface stresses, and maybe magma intruding from the summit through the koae faults. Not every collapse caused a surge, and if the entire chamber is molten as well as the dike and connections between active chambers, then that should conduct pressure waves anyway without the need for a shallow connection. As far as I know the only reason there is believed to be a dike in the upper ERZ is because a few old structures seem to form a natural arc that neatly connects the ERZ near mauna ulu with keanakako'i at the summit, however the east rift overwhelmingly seems to avoid the summit and continues through the mostly non-eruptive koae fault system to join the SWRZ. A while ago you said the progression of summit vents on kilauea is trending south, the lavas south of the caldera are thousands of years old, but the surface expression of the koae faults is entirely less than 500 years old, this means that area collapsed for the first time only then, and that could be a sign that the area is becoming involved in the volcanic activity. This area might well become eruptive over the next few hundred years, with shield building and/or high fountaining and eventually caldera collapse, as well as probably more frequent large eruptions high up on the volcano as opposed to only lower down. This is massive geological changes on human timescales.
A shallow dike at 3 km depth connecting the summit with the ERZ is not possible because of the reason you mentioned but that is where the “tube” comes in, some kind of conduit that at least extends down to near Mauna Ulu. There are some weird earthquake swarms that are very long, narrow and at a fixed depth (3-4 km deep) that happen in the UERZ and in the uppermost section of Seismic SWRZ, the two areas where they happen are presumably the ones where the summit is sending magma into those two rift zones so that the swarms are maybe the roof of a conduit getting pressurized. Don’t ask me how it formed though, it appears to have existed in that location for at least the last 5 centuries and maybe partially collapsed during drainning of the ERZ having to recover the connection and leading to the periods of low activity of the rift zone
I think Koae already existed around 1000-1200 years ago cause some of the old summit overflows ponded or got defleted by the faults, I don’t remember if it was the Hornet Flow or the Kalue flows. Koae didn’t form through some kind of massive collapse, it probably forms gradually from events like the intrusion in december 1965. At that time eruptive fissures opened up from Aloi to Kane Nui o Hamo and an intrusion travelled 12 km west from Aloi into Koae causing considerable deformation along that area and most noticeable at the Kulanaokuaiki Fault where the area to the north of it subsided as much as 2 m while the area to the south was uplifted by up to 0.7 m. What you get after several of this events would be the chaotical area of grabens that is Koae.
Summit activity has progressed south since 1000-1500 when the main vents were located in Kilauea Iki and near the north rim of the caldera. The north part of the caldera is now completely abandoned and Kilauea Iki hardly has had a few historical eruptions. If the south caldera reservoir collapses at some point in the future it will probably considerably enlarge the caldera complex to the south.
That is true, some of the flows seem to have been deflected, but I think most of the collapse of the koae faults probably happened fairly recently. There would have been few flank eruptions when summit overflows were occurring, and given that only a few of the almost yearly intrusions since 1950 have gone into the koae faults it seems like it is currently quite unlikely for intrusions to go that way, which probably explains why eruptions there are very infrequent and extremely small. If few intrusions are getting into the rift zones at all then the chance of one going into koae is pretty small. I guess over the centuries it added up though, and when in around 1500 the summit collapsed on a massive scale, probably through an eruption on the LERZ, the magma within the faults, as well as the summit and mauna ulu/makaopuhi/napau areas drained out, and wide (but probably still fairly passive) subsidence of the faults occurred, and has been occasionally continued since then.
The fact magma is able to go into the faults means an eruption will happen there eventually, and even as recently as 2015 there was magma that went into the area south of the caldera, so if things keep going in the east rift it seems plausible that a direct magma pathway to the koae faults could form and eruptions begin there, which would be very interesting and a very big change to the volcano as southward growth could suddenly become much more pronounced.
Changing the topic slightly, I managed to trace out the extent of the lava that probably erupted from heiheiahulu, as well as the 1790 lava that likely erupted very soon after. However looking at this I have doubts the 1790 eruption was actually one event in continuous eruption, but rather two eruptions separated by some time gap of months to years. This could be analogous to right now, where the recent vents were on a very similar line to southern vents of 1790, which probably erupted after heiheiahulu, and the northern vents erupted later maybe a few years afterwards after some build up and inflation in the middle rift like what is happening now. The big difference is that this years eruption was a lot bigger than either of the 1790 fissures was on their own, so if another large eruption happens as a result of the current deformation it would definitely have a big impact. The rift is probably primed to drain out, as it failed to do so this year, and if it didnt drain out after 1 km3 of lava was removed then probably the volume of magma stored in kilauea is significantly underestimated. There might even be several more large ERZ eruptions, including more shields at any point along the rift, as well as fountaining vents/cinder cones, and more fissures of all sizes over the next decade(s) before the true terminator, which might be like this years eruption but even bigger near the ocean at cape kumukahi, or offshore (or both). At even the low end supply rate of 0.05 km3 per year it would take only 20 years to have another eruption as big as this year, and at the high end supply rate of 0.25 km3 per year it would take only 4 years before big things could happen.
The JOKA station is at 14 cm now, 2 cm in only 5 days, which is pretty fast. It has been 91 days since August 5th, and with typical pu’u o’o supply rates of 8 m3/s there would be 63 million m3 of new magma. I dont know what it would actually take to get 14 cm of inflation over the area but this might not be a bad guess.
“Almost on the cusp of the Mariana Trench, before it plunges down into the very bowels of the ocean, scientists have found something rare and wonderful. Sometime in 2015, an underwater volcano experienced a massive eruption, spewing molten magma into the surrounding ocean.”
https://www.sciencealert.com/vast-plain-undersea-volcanic-glass-deepest-known-volcanic-eruption
Video is purportedly of the West Mata volcano.
can You imagine the pressures on this… impressive! Best!motsfo
The incredible is that the pressure is above the critical point of water. No boiling. Vapor and liquid phase are indistinguishable.
Here is a bit on the problem a mud pot/spring is causing Union Pacific in particular down at the Salton Sea.
http://www.latimes.com/local/lanow/la-me-ln-niland-mud-pot-20181101-story.html
Unfortunately, the LATimes site is blocked for UK readers, and I don’t have a VPN to get round it – what is the problem for the UPRR?
A mudpot is migrating towards the railway tracks despite the best efforts to block its progression. Even a 100 foot long metal barrier driven 75 feet deep into the path of it (apparently, sheet piling) has failed to halt it.
Based on the write-up, it seems to be following an estimated fault trace of the San Andreas in the area that is based on historic mudpot locations. This is based on this article; The wister mud pot lineament: Southeastward extension or abandoned strand of the San Andreas fault? Lynch and Hudnut, Bulletin of the Seismological Society of America.
Comparing the graphic provided with Google Earth, I think the affected location is here.
33.284651° -115.577687°
Thanks Lurk. With that mudpot creeping towards the formation it’s a good job the UP gave up on steam haulage – I’d hate to be in the cab of a 500-ton Big Boy going past that patch
According to the article they’ve moved the track at least once to bypass the hazard. Now there is discussion of putting in a bridge. I don’t see how they could easily get reliable footing for the support structure though. The feed for it is at least 75 ft deep since it just popped up on the other side of the sheet piling as if it weren’t there.
Fagurholsmyri station is showing some small, but interesting activity for Oræfajökull. Most of it looks like the bad weather, but buried in there are some faint tornillos and magma noise?
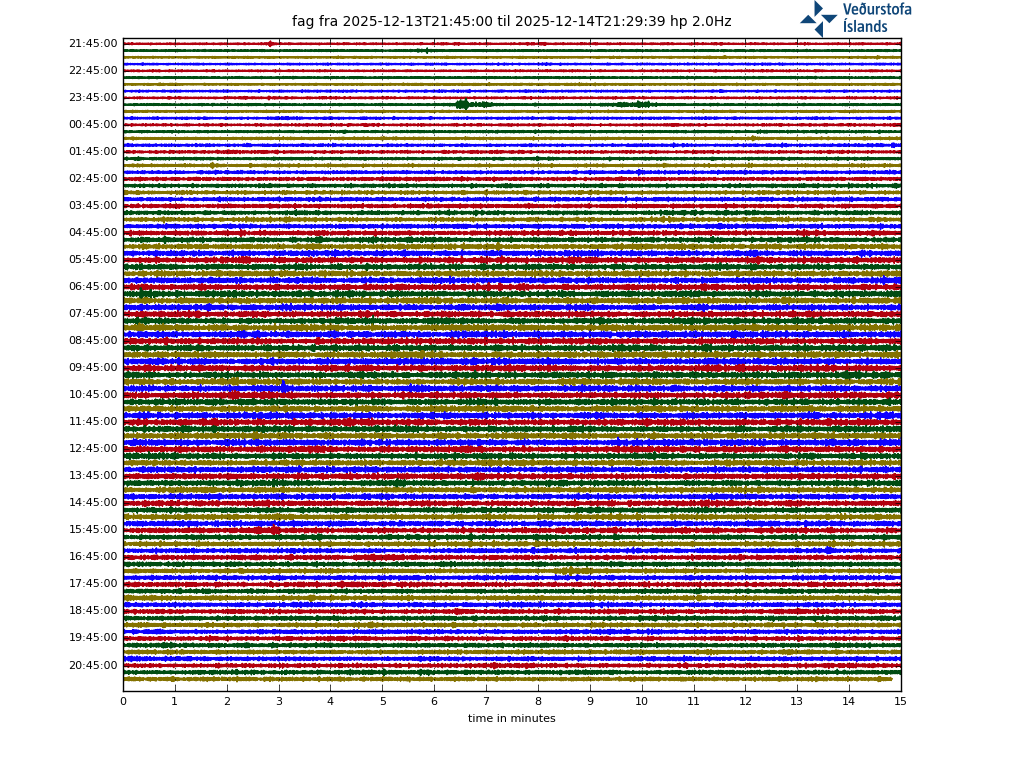
I know I keep squeaking about it, but my gut feeling is ramping up more than the volcano! I think it won’t be long before we see real noise, and a shorter than expected run-up to an eruption.
Discuss (homework to be handed in for marking by tomorrow).
As for mud pits and railway lines, they don’t have the UK perils of rail travel: leaves on the line…. 🙂
I don’t think that’s a passenger route anyway… well, not an intentional passenger route.
Still only small talk. Some strong quakes are needed to open up the dragon gates…
Yes. (Who let the Dragons out? Are they still moderating the Cafe? !! ) I am half expecting the bigger stuff to arrive sooner than expected. In the charts above there looks to be some rock-cracking going on. With the magma chamber reckoned to be at 5km now, inflation happening, I’m placing my bets…
Hope you are right! And there will soon be action. Sure IMO is also watching. There are people living down the slopes who need to move away.
Sure looks somewhat exciting. (and scary since people live down the slope.
http://hraun.vedur.is/ja/vatnajokulsvoktun/oraefaj_qu_trends.html
Those kind of look like my Cacti graphs at work. Hehehe
Can’t help but think that GIF looks like “Dragon attacks Legoland”. The burning items have quit a blocky look to them!
Its actually a scene from “Reign of Fire.” Turned out to be a not horrible movie. Campy, yeah, but watchable. Of course it did go out of it’s way to denigrate Americans in general, and the prominent “American” in the movie lived up to the hype.
The “Blocky” structure? Those are vehicles that were trying to sneak up on the dragon pictured. They failed. Somewhere in that fireball is a guy hiding under a tank… poorly. (Fire will flow, so +1 to the movie for plausible physics there.) The only real detractions I can make for the movie is that some of the circumstances are a bit contrived in order to put the protagonists in trouble. The actual story-line isn’t that bad at all. And the weakness of the dragons isn’t far fetched, it’s drawn from an example in real world biology. Not saying anything more since that would make this a full on spoiler. In my opinion, it’s worth watching just from the entertainment value.
As for the Dragons running the Cafe, I am the only residue from that. In Fact I was partially responsible for helping Carl regain control of the Cafe. That’s the hard part about a mutiny, some people don’t mutiny so easily. Blame the US Navy if you like, that’s where I learned dedication to duty. After Carl formed a cadre of competent admins, it was back under his purview.
Good to know some realiable dragons still around! 😊. So much good science talk and info on the café
Dunno if it’s “reliability” or a sense of “Hey, that’s Bull$#!@.” Ya see, I’ve been in domain fights before, and I don’t like domain squatters or thieves.
One thing you gain in military service is a deep seated hatred of thieves. It’s not tolerated in the barracks and should not be tolerated in the real world. There has been more than one real world “Blanket Party” conducted because of thievery. It’s not quite the same as depicted in the movies, but it is a real thing. No, it is not a form of “Hazing” as noted in the Urban Dictionary, it is retribution. It is for this reason that the military comes down pretty hard on incidents. See, if the command doesn’t fix it, the group will.
And that little factoid is something governments in general should note. Go too soft on criminals or enforcement, the populace will eventually act to remedy the problem… and crowds can be quite brutal and overbearing in distributing justice.
I think I am still around, but I am on and off a bit confused about my existence 😉
Beating up refugee children is not “justice” by any stretch of the imagination. That’s just brownshirt bullies victimizing the weak. Actual mob justice would be a mob of decent citizens intervening and beating the brownshirts up.
And their actions are in part due to increased assaults on fellow citizens on the streets. Typically not perpetrated by “children.” Crowds/mobs are not driven by logic.
Imagine if Iceland was placed on a superfast spreading ridge
Icelands ridge is a slow one 1 centimeters a year.
But the East Pacific Ridge is around 20 centimeters every year.
Thats lightspeed in geological terms. 20 times faster than Icelands spreading.
Imagine if Icelands mar spread that fast
If Iceland was a superfast spreader the landscape woud look diffrent I think and much more eruptions.
There is a huge diffrence is slow and fast ridges in morphology and apparence.
Or imagine Hawaiis hotspot emerged under the EPR ridge
If it was on a ridge that fast it might not erupt at all, with nearly all of the magma passively filling the rifts. There is in fact several hotspots under the east pacific rise but none are anything like a supercharged Iceland, Easter island is infrequently active (its eruptions are small and thousands of years apart with last one about 2000 years ago), Galapagos is much bigger but still not comparable to Hawaii or Iceland. The biggest of the Galapagos volcanoes is sierra negra, according to wikipedia it is half a million years old and has a volume of 600 km3. While that is very likely massively underestimated it is still dwarfed by kilauea and mauna loa, both of which are in the same age range (kilauea might be only half that age) and have a combined volume of 120,000 km3. Kilauea has erupted anywhere from 500 km3 to 3000 km3 of lava in the Holocene, even at a minimum that is twice what Iceland has done and an order of magnitude above most of the rest of the world.
Adding a really fast spreading ridge would decrease the eruption rate, as most magma would never erupt. Iceland theoretically should erupt even more lava than Hawaii, but because most of it never surfaces the actual eruption rate is quite a lot lower. Holuhraun is 1.5 km3, and only 52 eruptions as big or bigger than that have happened in the Holocene, a recurrence time of 200 years (although technically 2 have happened in the past 10 years so it is very variable). Hawaii currently receives about 1 km3 of lava in a decade and erupts at least 50% of it, Iceland erupts only about 10% because of being on a ridge.
None of the local hotspots in EPR rise are as powerful as Iceland hotspot is.
You cannot compare small near axis ridge seamounts to Icelands much larger almost LIP like basalt province
Iceland hotspot would be like Hawaii on steroids if there was no ridge. The ridge does add a lot of potential Magna but it probably takes away more than that overall by creating weak spots and rifts that allow the magma to fill in gaps without erupting. If a hotspot is allowed to collect magma it will go far and beyond anything Iceland has done. Deccan traps occurred when India overrode the reunion hotspot, and the magma supply rate during that could have outdone the worlds entire Holocene output in only a few decades, easily. Reunion is a pipsqueak of a hotspot compared to Hawaii (piton is maybe 1 km3 of lava a century and all alone, kilauea is up to 14 km3 this past century and mauna loa is at about 5 km3 a century), if a continent ever overrides Hawaii then you are looking at a great dying event to dwarf the P/T event…
Basically, quite the opposite of the general idea, Iceland has effectively been crippled by the ridge. A faster ridge would only enhance this.
The one thing that the ridge does do is create space to build up massive volumes of magma, so when eruptions do happen they can be enormous, even if the total output per year is relatively much less than Hawaii. A fast eruption of maybe 3 km3 of lava at once is probably the absolute limit for kilauea right now, mauna loa might be able to do somewhat larger but it will be way less frequent. All the volcanoes in the vatnajokull area have had eruptions far bigger than that before. An eruption as big as eldgja probably can’t happen in Hawaii as there isn’t enough stored magma.
How can Iceland without a ridge… be Hawaii on steroids?
Icelands hotspot.. is not as hot.. or deep or large as Hawaiis one.
MY op= Iceland without the ridge… is an island group similar in size of the Galapagos
“if a continent ever overrides Hawaii then you are looking at a great dying event to dwarf the P/T event…” likley not
my own opinion
If a continent overides hawaiian plume ( todays strongest hotspot ) I think we gets a very very active dacite – ryholite caldera complex, with frequent VEI 6 plinian events and very large dome building events and loots of hot glass flows. And some basaltic events.
Think an oversized version of yellowstone or long valley with medecine lakes and glass mountain and mount hoffmans and tongario complexes thrown in one single system. It also depends how thick the crust is.
This scenario is if Hawaii was near craton like yellowstone is today.
The Deccan Traps at is absolute peak … was a much much more powerful plume than Hawaii ever is.
Major flood basalts are caused by hotspots thats powerful enough to be called suerplumes
Yes I agree with you that hotspot and ridge combination alllows for massive magma resovairs to form and once occanionaly you gets an enormous fissure basalt events
Just imagine the CAMP superplumes biggest flows in the pnagea rift
total armageddon!
Silicic volcanism happens when there is very slow continuous feed of basalt into an area of thick crust which is under slight extension. If a highly productive hotspot ends up under a continent you get a flood basalt, which is probably what happened for Deccan traps. By world standards reunion is impressive, piton could have a VEI 5 several times a century in theory. However reunion is still tiny compared to Hawaii, which could pull off a theoretical VEI 5 about once a decade. Based on energy release, every year of the pu’u o’o eruption could have been considered a large VEI 4. Even back in its heyday in the early cenozoic the reunion hotspot was not as powerful as Hawaii, and now it is barely comparable. Hawaii might actually be on the transition to forming a microcontinent, the big island combined with Maui nui comprises about 2/3 of the entire volume of magma erupted from the hotspot in the cenozoic, all in less than 2.5 million years. Kilauea and mauna loa alone are about 1/5 of the total.
The best guess for how the Deccan traps formed is that the plume was buried and with nowhere to go all that magma built up and eventually broke through the continent anyway. It would seem statistically unlikely for a structure like a mantle plume to form exactly when a continent is overhead after that spot had formerly been occupied by ocean for hundreds of millions of years, and tens of millions of years since, and even if that happened it would also seem likely that a new plume would divert to erupt under the ocean. This didn’t really happen much during the Deccan traps, so the hotspot probably existed already and was overridden.
This is possibly what will happen at yellowstone in the future too although that is far from guaranteed and the laurentian craton is much bigger so it might not do too much. Also to consider that yellowstone is currently a silicic volcano with low feed and in extending continental crust, but when the hotspot first appeared it was a powerful basaltic volcano the size of mauna loa and kilauea combined, the last place a 1000+ km3 lava flow happened on this planet.
At one point I was interested in looking at how the earth might look in the far future, and one plausible extrapolation of plate tectonics is that the Pacific Ocean is consumed by zealandia microcontinent as it rifts from Australia more along a currently extinct rift in the Tasman sea. This is later followed by the Americas surrounding all of this. Australia alternatively might just go right through the island arcs north of it and eventually end up near Alaska, dragging zealandia with it. In either case zealandia overrides the location of the Hawaiian hotspot. That could be a recipe for a monumental flood basalt, as well as raising zealandia back above sea level, providing that Hawaii is still a powerful mantle plume in 40-70 million years time.
It is very hypothetical but if Reunion caused the Deccan traps with much less than Hawaii’s current supply rate, then if the current rate is maintained in the far future you could get something with twice the rate of the Deccan traps, or more. Think Icelands entire Holocene eruption volume in less than a decade, several simultaneous skaftar fires sized events going continuously at any one time, lava lakes the size of actual lakes, if the province stopped erupting at all for more than a few years you get VEI 8 lava flows. The total heat energy release would be enough to heat the atmosphere by over 1 C all on its own, and the CO2 would trap all of that and make it much higher, probably single handedly turning the earth into a superheated greenhouse planet like what happened in the early cenozoic but much more. Hawaii also has the highest sulfur content of any magma on earth, even more than Iceland, and we already know what that is like. Flood basalts make all other kinds of volcanism look like an accident.
Basically this event would be tamu massif #2, or Olympus mons on earth.
How can Iceland without a ridge… be Hawaii on steroids?
Icelands hotspot.. is not as hot.. or deep or large as Hawaiis one.
MY op= Iceland without the ridge… is an island group similar in size of the Galapagos
Hmmmmm…
Thats why Axial Seamounts caldera is so enromously huge! ¨
hotspot and ridge combination allows large resovairs to form.
that caldera is as wide as halemaumau and much longer!
likley was an enromous magma resovair that drained from that volcano
The submarine flood basalt from that event.. is long since buried under smaller younger lava flows and the caldera is slowly filling with pillow lava and lobate lava and faster sheet flow eruptions
At https://www.washingtonpost.com/weather/2018/10/29/anak-krakatau-volcano-explodes-like-fireworks-with-lava-lightning/ “Anak Krakatau volcano explodes like fireworks with lava and lightning”. Is Anak Krakatau still able to do a VEI6 eruption?
No. Not yet. It takes a very long time to refill the reservoirs, plus quite a lot of magma has been erupted in the last 90 years or so.
did You guys catch this you tube on comet trails…. kinda on topic of sun stuff… https://www.youtube.com/watch?v=2WQGyAUUvMs&feature=youtu.be&fbclid=IwAR1C6s26WWtVtWesYcORtufGIibDG23kqd87qscNsBIkcrsp62vV7PPDxyM Best!motsfo
Today is exactly 100 years since the end of the last Katla eruption!
Strong aurora in Sweden right now! Visible to the eye at least as far south as the Stockholm region. Too bad I’m on a train right now missing the show…
New post is up! Spreading the ashes of Iceland
https://www.volcanocafe.org/iceland-in-ashes/
When the big one comes, say goodbye to the power grid.
https://www.amazon.com/dp/B07JZGZ3LN