
The pillars of Pozzuoli: the frontipiece of Charles Lyell Principles of Geology (1831)
In hindsight, continental drift should have been obvious. That the Earth moves up and down had been known for centuries, shown by the layered beaches of Sweden, the seashells of the Himalayas, or the sinking harbours of the Med. The drowned and resurfaced Pillars of Pozzuoli became famous as the frontipiece of Charles Lyell’s opus magnus, Principles of Geology (1833). If up and down is possible, why not sideways? The close relation between the coasts of Africa and South America was obvious to everyone. But science, ruled by conservative geologists, blocked this obvious step.
Don’t judge these senior scientists too harshly. The physics of continental drift is still far from straightforward. There was no known source of sufficient energy within the Earth. Convection in solid rock was unimaginable. The data spoke loudly, but in an unintelligible language. It needed translating and interpreting. Science stuck to things it understood. It kept its feet firmly on solid ground.
Only in the 1960’s did the tide change. The mid-oceanic ridges had been discovered, and the oceanic crust dated. The ages left no doubt that new crust was being created. Even the most conservative geologists could no longer deny the flood of evidence. Continental drift became accepted, 200 years delayed. Let it move.

The 15 major plates. Source: wikipedia
The main mid-oceanic spreading ridges
We now know of 15 major plates, each moving independently from the others. Most of them contain a continent (the North America plate covers more than one) but some are purely oceanic. In between the plates are the spreading ridges and subduction regions. All active spreading ridges are oceanic, even if some (such as the Red Sea spreading ridge) started on land. The answer to how continental drift works lies underneath the sea.
See it move

The increasing distance between telescopes in Germany and the US
The spreading rate of a typical mid-oceanic ridge is 5 cm/yr. As every book on the topic says, it is the rate at which finger nails grow. Nowadays we can measure this directly. Radio telescopes measure the exact direction to distant galaxies. Over the years, this direction changes as the ground underneath them moves. Compare two telescopes, and you can measure how the distance between them changes. This is accurate to millimeters. The figure shows the increasing width of the Atlantic, measured between two telescopes. You can see the slow, smooth movement, with an annual fluctuation. The rate of increase seems slow, but this is because the baseline crosses the spreading ridge at an angle and does not see the full movement.
But what is it that makes the continents move? The main action is clearly in the oceanic plates. But what force can make the surface of the Earth drift? Physics tells us that there are four different processes at work. In increasing order of importance, these are:
Magma injection The magma injected into a spreading ridge can push the two sides apart, and set the plates in motion.
Convection currents The convection currents in the mantle can themselves induce horizontal motion, because upwelling and downwelling occurs in different regions. The flow in the mantle can drag the crust along.
Gravity Spreading ridges are pushed up by several kilometers. Subduction occurs in deep trenches. Gravity causes material to move from high (spreading ridge) to low (the trench). This is called ‘ridge pull’. (It is also called ‘ridge push’ but this is misleading as there is no push from behind.)
Subducting plates As the slab sinks, it pulls the rest of the plate with it. This is called ‘trench pull’ or ‘slab pull’.
Slab pull is now considered the most important effect, followed by ridge pull. Horizontal convection currents in the mantle would affect the continents most, since they have deep keels sticking into the mantle, but this is not observed. Instead the continents seem to respond mainly to the oceanic crust. Ridge pull is important, but magma injection by the rising mantle, which would seem to be the most obvious way to drive plates apart, does not work as a force.
Spreading ridges and plumes
Mantle plumes are different from spreading ridges. They produce ‘hot spots’, seen in places such as Hawaii. They are deep, rising, convective cells, which reach to the surface and by their heat, push it up. Magma forms, and a tall volcano appears. It grows tall not just from the lava deposited on top, but also from the push from below. Once the volcano drifts away from the hot spot (the curse of continental drift: it is hard to stay in one place), the mountain quickly sinks again. This will be the fate of Hawaii. Hot spots do not form spreading ridges: Hawaii did not break the Pacific plate. This shows how ineffective magma injection is in setting plates in motion. However, sometimes a hot spot does break a continent, forming a triple junction which can develop into a new spreading centre. Africa has been susceptible to this. But it is rare, as shown by the fact that neither the Yellowstone hotspot nor the Deccan Traps broke their host continent.
There are cases where a hot spot coincides with an existing spreading ridge. Iceland is one example, the Azores and Amsterdam/St Paul are others. Are these accidental? If so, the hot spot should rather quickly drift away from the spreading ridge. But this is not seen. Iceland is at least 20 million years old, and it is still largely centred on the continental divide. The reason may be gravity pull. The hot spot pushes a region up. Gravity pull begins to act. If there already was a plate break nearby, the plate may now begin to break at this point, letting the old break nearby stop and heal. In this way, a hot spot can pull a spreading ridge along, at least for a while.
Hot spot volcanoes are common on Mars and Venus, as they are on Earth. But spreading ridges and continental drift only occur on Earth. We are unique.
Mantle

From www.zmescience.com/science/physics/magma-peridotite-crust-mantle-10012013/
The mantle extends from 100 km depth to almost 3000 km. It is solid material, not liquid, although it can move around as well as up and down. If this seems strange, think how sand can do the same. The mantle rock changes at a depth of 410 km, and again at 660 km. The higher one corresponds with a change from olivine to spinel, and the lower one a change to perovskite.
Subducting plates are cooler than the surrounding rock, and go through the first phase change a bit earlier. This increases their density while the surrounding rock is still of lower density olivine. This increases the downward pull on the subducting slab. Most of the slab-pull force comes from this phase change. Subducted plates often, but not always, stay above the deeper discontinuity: there is a ‘plate graveyard’ at this depth.
The phase changes can stop convecting cells from rising. Only strong convective cells break through them from below. If a cell gets stopped, it develops a broad plume head, creating a larger region of warmer material. So there may be two layers of convection in the mantle, separated by the discontinuity, with only a few hot, deep plumes being able to rise through both.
Convection
What causes the convection in the mantle? Convection forms when there is a large temperature gradient. The hot material at the bottom has lower density, and the buoyancy causes it to rise. Convection can be triggered either by heat from below, or cooling at the top. Mantle convection probably has both effects. The heat from below can come from the core (from the slow solidification of the inner core), or from radioactive elements in the mantle itself. Cooling at the top can come from subducting plates, or from water cooling of oceanic plates. The convection can be deep, from the core, or be in the upper mantle only, driven from the 410km phase discontinuity. Underneath continents, sideways convection can occur, from hot regions near the centre of the continents (where mantle heat is trapped) to the cooler edges. Perhaps these also happen from the warm mid-oceanic ridges.
Numbers
Let’s try to put some numbers in.
The total length of the spreading ridges on Earth is a staggering 40,000 km. The oceanic crust is about 8 km thick. For an average spreading rate of 5 cm/yr, we need to create 16 billion cubic meter of basalt every year (length times width times thickness). The density of basalt is 2400 kg/m3, so that 38 trillion kg of basalt is added to the oceanic plates each year. Obviously, the same amount must be going down in the subduction zones each year, to keep the Earth in net balance.
The new basalt coming up from the mantle is hot. It cooled down while coming up but it is still hotter than the normal oceanic crust. Because it is warmer, it has lower density. This buoyancy pushes the mid-oceanic ridges up, to 3-4 kilometer above the ocean floor.
Let’s assume that basalt within the spreading ridge in the ocean has a temperature of perhaps 1300 C. As it moves away from the ridge, pulled in by slab-pull and by gravity, it cools and grows denser. Let’s assume that once it reaches 800 C, it begins to subduct. (The numbers are approximate but not far off. Obviously the surface is much cooler and these numbers are for the bottom of the crust.) The heat capacity of basalt is 0.84 kJ/(kg K): in other words, to cool 1 kilogram of rock by 1 degree centigrade releases 840 Joule of energy. Cooling by 500 degree centigrade releases 0.4MJ per kg of basalt, between upwelling and subduction. This is a lot of energy. For 1 square meter of ocean floor, and 8 km of crustal depth, the total energy to be lost is 8 TeraJoule (8 x 10¹² J).
Rock insulates very well and it gives up this heat very reluctantly. The k value of basalt is 1.69 W/ (m K), which means that for each degree of temperature difference, a 1 meter thick rock layer lets out 1.69 W per square meter surface area. A 1 kilometer thick rock reduces the leakage to 1.69 milli-Watt. So how long does it take oceanic crust to cool down from 1300C to 800C? Take the average thickness as 4 km, and the temperature difference with the surface 800 C (the deep ocean being 4C). A quick calculation shows that the ocean floor near the ridge will radiate about 0.34 W per square meter.

At this rate, the cooling will take a million years. This sounds like a lot but in geological terms it is fast. However, although the initial cooling is fast, it slows down a lot later, when the temperature difference is much less. Cooling continues for typically 100 million years.
As the rock cools, it contracts and becomes denser, and the ocean floor begins to sink because of the contracting rock: the sea grows deeper over time. The approximate relation is that the depth of the ocean is 2.5km, plus 0.35 times the square root of the age in million of years. At zero age (i.e. the spreading ridge) the depth is 2.5 km. After 1 million years it is 2.85 km, and after 100 million years, the ocean is about 6km deep. After this it increases only very slowly. Therefore the oceans are least deep at the spreading ridge, and after about 1 million years, when the floor has moved by about 50km, it rapidly becomes deeper. The spreading ridge is therefore typically 100 km across.
From http://oceansjsu.com, copyright San Jose State University
The plate is actually much thicker where it forms, and thins further out as the movement speeds up. Eventually the oceanic crust cools so far that it become denser than the pressured mantle (aestenosphere, to be precise) below. Once this happens, the ocean plate begins to sink, like blobs in an old-fashioned lava lamp. Let subduction begins.
Subduction reheats the sinking plate. It comes in an area where temperatures are much higher and sucks up this heat. The sinking and the higher pressure itself also generate heat. After 100 million years of solitude, the plate can get cozy again in the homely warmth of the upper mantle, returning to its Macondo, and dissolve in the plate graveyard.
Volcanoes
Volcanoes occur in two part of this cycle. The spreading ridge itself is effectively a 40,000 km long volcanic rift, producing gigantic amounts of basalt. Images of the ocean floor clearly show a rift, situated in the centre of the ridge. Most of the basalt is injected far below the surface; only a small fraction is erupted on the surface. Sometimes a ridge becomes overactive and floods the sea floor with thick layers of basalt, as a LIP (or Large Igneous Province). The largest such event known is Ojong Java Nui, which covered as much as 1.2% of the Earth, and was emplaced below the sea 125 million years ago. Ridge volcanic activity is well behaved, with stuff oozing out. The pressure of kilometers of seawater above is too high to allow for explosive ejection. These are the only types of volcanic eruptions which attract rather than destroy life.


Giant tube worms and a scary-looking
spider crab near deep sea hydrothermal vents.
http://www.photolib.noaa.gov/htmls/nur04512.htm, http://www.photolib.noaa.gov/htmls/nur04511.htm
This volcanic activity quickly dies down as the plate cools, and the plate becomes inert apart from the occasional hot spot or warm region it traverses on its journey. Where this happens, a volcanic island may form. All deep sea islands (apart from Australia) are volcanic in origin.
The second phase of volcanic activity occurs during subduction. The oceanic plate is solid. As it subducts, both temperature and pressure rise and a race begins. The melting point increases with pressure. If the temperature increases faster than the pressure, a bit of melting will begin. In practice, this may happen at certain depths, and the plate becomes solid again as it goes deeper still. The subducting plate probably contains water (the upper range of the oceanic plate becomes pretty wet, as you may imagine) and this lowers the melting temperature. Once rock melts, it becomes less dense and buoyancy pushes it upwards. The result is volcanic.
Let the dance commence
Therefore, continental drift begins with a cool surface slab descending into the mantle (‘the enemy’s gate is down’). This pulls oceanic crust with it, and some distance away the crust tears in response. The tear creates a gap, and the underlying mantle floats up to fill the gap, forming a new hot surface. Below, more material comes up from the mantle, carrying its heat with it. All activity happens below the sea. The continents are floating on the oceanic crust, passive and driven by the whim of the oceans.
Spreading ridges thus form by tearing crust asunder. Convective mantle cell are not needed. The mantle does have convective cells, forming hot spot volcanoes. As a rule, hot spot volcanoes have magma that comes from very deep in the mantle, pristine material that has not been to the surface before. Mid oceanic ridges have magma from shallow mantle sources, that has been through several cycles, lacking some elements that ended up in the continents. Subduction takes the plates down to the graveyard, but only rarely to the deeper mantle. The shallow mantle is thoroughly processed, mixed, baked, cooled and wetted. The deeper mantle, source of the hot spots, has had a more sheltered life.
What we see on the surface is the stately dance of the continents. Now we know that this is just a veneer, driven by the far more rousing dance of the oceans which pulls and pushes the continents along. In turn, this is part of a lively upper mantle. Our solid ground is floating on a sea of trouble. There is danger in the dance.
Geolurking, bless him, pointed out the real origin of continental drift


I just read this https://ig.ft.com/sites/japan-tsunami/?ftcamp=published_links/rss/googlenews/feed//product&google_editors_picks=true it sounds like the cascadia scenario all over again – but this time in japan
Excellent article, Albert. And Edward, that link…. Very sobering. As a UK retail business owner though, I’m wondering what I could invest in to mitigate against a hit from the global market….Probably land/real estate.
I’ve not noticed any further comments regarding activity around Bardarbunga. Has it returned to it’s previous fitful slumber?
it does seem to have one typo
it says “quakes hit the two easterly sections in the mid-1940s, but the Tokai section has been quiet for 158 years”
but looking at the graph and map it seems (to me) clear that is should (probably) say ‘westerly sections in the mid-1940s, but the Tokai section…’
Great read – thanks Edward.
your article is really rather good Albert 🙂
Thank you!
36 years ago St. Helens showed the power of a lateral eruption. Here’s a video on YouTube I found of KATU Channel 2 news reports shortly after it happened.
Great read Albert, really liked the numbers!
Etna blew her top a little while ago
http://www.skylinewebcams.com/it/webcam/italia/sicilia/catania/vulcano-etna-sud.html
Very nice overview! I wonder how much distortion the rotation of the earth causes clean convection streams. As matter rise or sink there will be a strong horisontal tugg. The globe shape adds to the complexity. Perhaps it could be modelled on a lokal hot spot such as Iceland or Hawai?
The Earth’ rotation is normally assumed to have no effect on mantle convection, because the convective flows are too slow and always carried along by the surrounding mantle rock. The Coriolis force is also believed to have no effect. There may be some effect in the core, though. The gradual slowing down of the Earth may have an effect in the upper mantle.
What’s going on here?
https://www.pnsn.org/seismogram/current/palm
That’s a weird signal. Artificial?
Construction of some type. Same as yesterday. There is a small swarm going on, though, for the past few days.
I love skiing and have read there is snowcat service to that area in the spring and plenty of deicing of the Palmer lift that happens about this time of year.
Palmer lift was dug out two weeks ago and I thought it has been running since then. I’m skiing there over Memorial Weekend, so I hope I’m not witness to anything interesting.
Here is a link to a news story about the swarm on May 15-16
Albert, thank you for the very informative article. Are tidal forces of any consequence on the plate movements? Seems like a lot of potential force, but does its rapid periodicity average to a net zero force? What about the change in forces due to the annual tilted trip around the sun? Maybe those forces act as liquification vibration factors?? Are there any effect of the earth’s centrifugal forces on plate movement?
A good question but the answer seems to be no. The tidal force inside the earth is of order 10^-8 of the earth’s own gravitational force. It is really very small, because the Moon is much smaller than the Earth. Tidal forces from the Sun are about half of that from the Moon. There may be a small effect from tidal friction, which slows down the rotation of the Earth, but that is over very long time scales. The centrifugal forces, although not negligible, act as a very small negative gravity but have no real effect on convection or continental drift. If they had been important, you could have expected that they show up in earthquake statistics, which they don’t.
“Underneath continents, sideways convection can occur, from hot regions near the centre of the continents (where mantle heat is trapped) to the cooler edges.”
Does this trapped mantle heat under the centre of continents cause rifting and the break-up of the continent, aided by the sideways convection from the hot regions to the cooler edges?
It is possible that this contributes to the break-up of the super-continents. There is probably more than one cause, but it is notable that supercontinents do not survive. They also tend to break up near their centre, rather than splitting off fragments from the edge. You have to wonder how a mantle plume would know where the centre of the continent is! The insulating effect may cause a warm region which convects to the cold edges and sets a (shallow) convective cell – this seems the most likely mechanism to me. People have also proposed that a supercontinent will be surrounded by subduction zones, and that the cold descending slabs set up a deeper convection cell (although the proposal that this cell will rise from the core-mantle boundary seems a bit much of a good thing). Neither the formation nor the destruction of supercontinents is well understood.
Hi! It’s just me or this low frequencie spikes are suspicious? Magmatic origin? Thank’s!
Are you referring to the red spikes today at around 0800 and 1645 hours? If so, those are from the quakes in Equador
Ha ok… yes i was refering to this spikes. I didn’t tought it could be those quakes. Thank you very much!
Another excellent article Albert! Thanks very much!
Interesting about the mineral phase change being the main cause of ‘slab pull’. Is that due to volume shrinkage of the mineral or could it be due to enthalpy change (endothermic?) of the minerals, cooling and increasing the density of the slab?
Mike
Good question Mike. The 410 km and 660km transition have opposite effects. The 410 km one is exothermic, so the material heats up (by about 50C) . It also gets denser by about 100 kg/m3. The main reason for the slab pull is this shrinkage, and the fact that at lower temperatures (e.g. the cold descending slab) it happens earlier. The 660km boundary is endothermic, so the slab cools by about 80C, and it also becomes denser by about 300 kg/m3. But here, the transition happens later for cooler material. So the slab is still at the lower density while the mantle around it already has gone through the phase change. The result is that the slab suddenly becomes more buoyant. This is why plates have difficulty getting through this boundary.
What would be the observed effect of this difficulty?
Would this be a stop and start sort of thing that would show up as a cyclical pattern?
It will slow down the slab: they will hang around at this level for some 10s of millions of years. What happens afterwards it disputed, but if they do sink through the layer, they are likely to go all the way to the bottom of the mantle. Some people argue that the slab separates, with denser material (basalt) sinking and the rest staying behind. Other people argue that it depends on dipping angle: if more than 40 degree, it eventually goes down, otherwise it stagnates above the layer. You can see the slabs in seismographical data, as regions of fast P waves. There are some very deep slabs, well below the 660km layer, seen below North and Central America and the Himalayas, but most subduction zones show that the slabs flatten out at (Kuriles) or just below (Java) the transition zone. The deeper slabs may not be connected to current plates but date from a previous era.
The picture (Fukao et al. 2001) shows an example from Japan, showing the stagnation, and eventually, a hint of a deeper descend.
Thanks Albert,
I wonder how this relates to quakes along the subduction zones, if the composition and structure could give insight into quake frequency and magnitude?
A software model by NASA of the remnants of the Farallon Plate, deep in Earth’s mantle.
Nice one Bill! This is one of the two plates known to have gone down into the deeper deep. Although there was some discussion whether the deep bit was actually the same plate or one from a previous cycle.
I noted these EQ’s on a rough line from the ocean spread and subsequential subduction off Peru. Talk about a sinking slab! I think Albert commented months ago about these very deep events having to do with phase changes. Now it’s a little more understandable. and why the mountains there are so high???
Good explanation Albert, thanks for that 🙂
Water – water – I was reading through the article thinking where is the water? And there it was – ‘the subducting plate probably contains water’. The deep aquifers under the continents, the springs which come out of the earth on top of hills, the crystals growing from the minerals in deep caverns: I would have thought that it is the expansion of water caused by heat – surely this is the root lubricant of the earth’s dynamism?
Aquifer water is much much shallower than the crust/mantle boudary. Much of the water involved is in the crystal lattice of the minerals and not free to flow. Serpintization is a related process.
No, not the root cause, but it does oil the wheels. The fact that the subducting plates are wet reduces the friction, and this helps the slab-pull. Without water it is harder to get the process started. The aquifers and spring your refer to are all in the upper crust and are not fed from the mantle. But there is a fair amount of water incorporated in the upper mantle, perhaps twice as much as there is in the oceans.
I think it is the water in the upper mantle that you refer to, Albert, that supports my assumption that the continental plates float. This also leaves me to think that global warming won’t raise sea levels and that isostatic rebound is also a factor linked to the subduction of water. This is merely speculation of course on my part but if there is any science that supports or refutes this idea I would be interested.
You should try doing some research on it 🙂 .
Out of curiosity, what makes you think global warming won’t raise sea levels? Just as a quick note – it’s fairly well established that warmer climates lead to higher sea levels. There is past evidence of this in our own oceans, as well as ancient oceans. If it weren’t for past global warming, we would still be able to walk from Alaska to Russia.
Okay – granted – and I have just contradicted my comment on the last topic where I advised that there is evidence on the seabed off Nova Scotia to show that ice walls lifted allowing an inland sea or lakes over Canada and North America to drain into the North Atlantic, drowning lands around the UK such as Dogger, where Dogger Bank is now, and the legendary Lyonesse off the Southwest coast…. Possibly even Atlantis along with the Black Sea and coastal areas around the Mediterranean
An excellent read, Albert. A lot of work went into this, I can see. Many thanks!
http://www.sciencedirect.com/science/article/pii/S0012821X16301418
“Focused fluid flow through the Alpine Fault zone may promote fault weakening by facilitating the formation of weak secondary minerals and promoting the generation of high pore fluid pressures or pressure compartmentalisation.”
I suppose I should offer an opinion on that, but I don’t have the expertise. My (limited) understanding suggests to me that there’s a hypothesis based on some evidence, that rupture may be triggered by water induced geochemical changes at depth building up over time and “lubricating” the fault, rather than (just) a mechanical locking and eventual rupture due to build-up of stress on the locked section.
Something to ponder… talc is one of the end products of Serpintization.
Outstanding article. Thank you.
Etnabunga yesterday
https://www.youtube.com/watch?v=rCce55waR3w
Today tremors dance up and down. Yellow allert.
Off topic, apologies if already posted
https://www.theguardian.com/science/2016/may/19/mega-tsunamis-in-mars-ancient-ocean-shaped-planets-landscape
There was some discussion a few weeks back about the daily increase on the tremor plots that seemed cyclical. The suggestion was this was related to water flowing. These are drumplots (last 3 days) and the tremor plot for the SIG station located close to Kverkfjöll that shows the diurnal cycle of melting during the day which starts the water flowing and how it shows on the plots
Careful. Incorrect stations.
Town of Siglufjörður is (sig). Daytime Traffic on drumplots.
* Three day holidays just passed, three days ago.
* Nothing to see here.
* Move along.
FYI, no Barda is in the making. Period.
Activity slowly shifting … to normal.
Thanks Islander,
And they matched up so well lol
It’s those Pirates doing it! 🙂
Picture doesn’t load for me.
Turriabla, Costa Rica video:
https://youtu.be/Om3MaleQ_E4
And my dogs are on what appears to be death watch. Yeah, I feel like crap but i aint that bad.
Hey! Get well soon – hope you and the dogs are all feeling better now
Dogs are fine. Me, not so much. I think that rather than sitting death watch, they are staying close to provide protection. That would fit with the idea of a pack looking after its own.
Keep safe Lurking, all your pack is looking out for you – namaste
My Springer’s reaction is:
“who is going to open the can..”
Technically, that’s probably why the two smaller dogs were sticking close. To the tooth monster, they are bite sized.
I posted this quite some time ago on the old VC site (in 2012) – Bill brought up a graphic higher up here that made me want to dig it back up for repost.
The main point of interest here that I found, is that there is a finger, one that is quite shallow that looks to line up directly with Yellowstone. I wish I knew how shallow that finger was. It’s slightly more “out there” as a theory, but I have a pet theory that Yellowstone is actually a trailing remnant of the Ignimbrite flareup that occurred starting 30 million years back, caused by the slab gap of the sinking Farallon plate.
Another possible point of interest, is that the western edge further south seems to be sitting right over the New Madrid Fault zone.
Neither of these are anything even close to conclusive, but it’s something interesting to keep in mind. The end of subduction of the Farrallon made for some incredibly impactful geological events in North America, it wouldn’t be that far fetched to think that there could still be some remnant effects of that event.
I find the New Madrid area fascinating. Does anyone know anything about the various hot springs in the general vicinity (Hot Springs, NC, etc)?
Big quake on Bardy just,
One even bigger now
Hot Springs, AR is an area where water percolates up quicker than normal, thereby keeping its heat. Nothing volcanic. Although, there was an earthquake swarm in north central Arkansas about thirty years ago that some attributed to a magma intrusion. http://www.nytimes.com/1983/01/18/science/thousands-of-quakes-what-do-they-mean.html?pagewanted=all
Jenny’s one has been upgraded to M4.4 I think Bardabunga took Islander’s comment that is was returning to ‘normal’ to heart. M4’s used to be normal..
Two strong quakes in Bardarbunga volcano
Friday
20.05.2016 07:17:53 64.665 -17.450 8.9 km 3.3 99.0 4.6 km NE of Bárðarbunga
Friday
20.05.2016 07:11:45 64.666 -17.407 6.1 km 4.4 99.0 6.4 km ENE of Bárðarbunga
http://en.vedur.is/earthquakes-and-volcanism/earthquakes/vatnajokull/
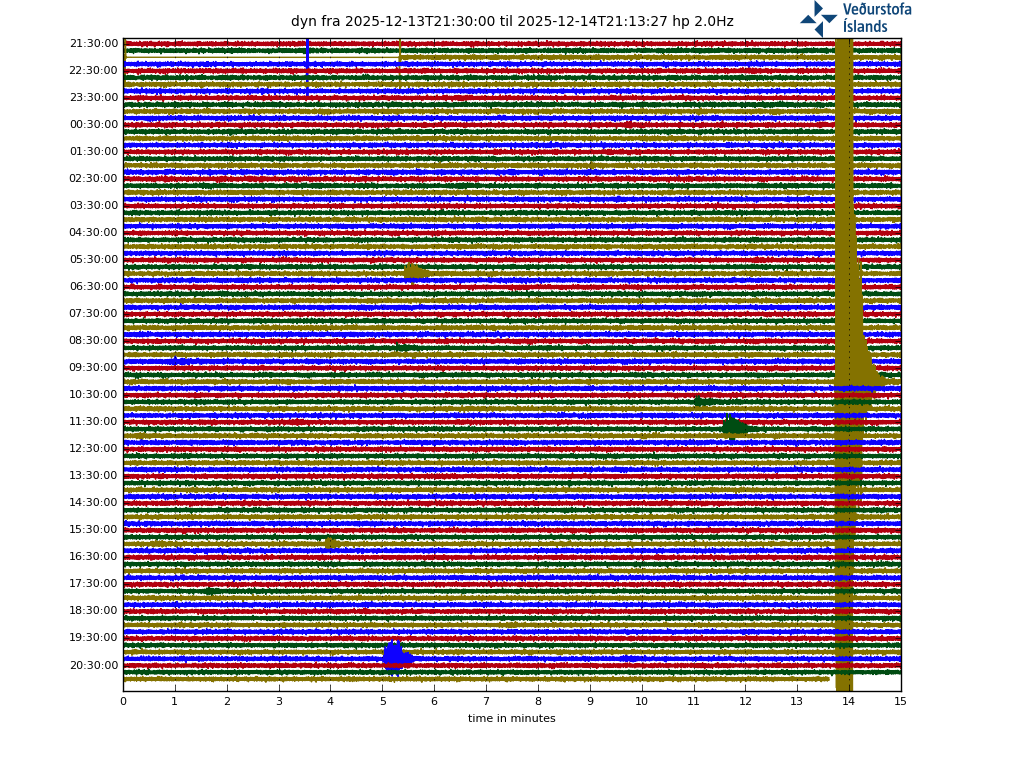
http://hraun.vedur.is/ja/drumplot/drumplot/dyn_highpass_2.0
another one: Friday
20.05.2016 07:11:40 64.667 -17.490 2.3 km 3.3 99.0 3.5 km NNE of Bárðarbunga
Guatemala’s Santiaguito Volcano Has Strong Eruptions
GUATEMALA CITY – The Santiaguito volcano, located in the western Guatemalan province of Quetzaltenango, erupted on Thursday, sending an ash plume into the sky.
The ash plume rose 4,500 meters (14,754 feet) above sea level and is moving south-southwest, the National Institute of Seismology, Volcanology, Meteorology and Hydrology reported.
The explosion caused major lava flows and dropped ash on nearby villages.
The forecast is that the volcano will generate new explosions in coming days.
Santiaguito is one of the 33 volcanoes in Guatemala and, along with the Pacaya and Fuego volcanoes, is in constant activity.
In recent days, the Fuego volcano has experienced strong eruptive activity.
http://www.laht.com/article.asp?ArticleId=2412584&CategoryId=23558
Given Santiaguito’s record, I would suspect that ‘lava flows’ meant pyroclastic flows and/or lahars
Santiaguito has produced short blocky lava flows in the past during larger eruptive episodes. And currently there is a medium sized eruptive episode so I would not rule out a short lava flow.
In context, Carl: “the explosion caused major lava flows”. Now, I know that ‘Guito has produced lava flows -and in fact has produced them more frequently as the years go on – but surely we’re talking about exceptionally thick, slow moving dacite flows, not the sort of thing that would be apparently ’caused’ by a single explosion – or would be a cause for alarm in any case (apart from the possibility of block-and-ash avalanches from the flow front)
Rudiger posted a sat image of the apparant flow.
But, you are right, the text was unclear. Often you get several pyroclastic surges during a phase of lava extrusion.
The Bardy quake this morning was the strongest since the eruption, I believe, and by far the strongest deeper than 5km. There was a similar sequence on 8 April, a series in quick succession between 8km and 2km depth, starting with an M4.2, much like today. Today’s M4.4 was a few km deeper than the M4.2 of last month.
It makes you wonder…
We have seen eruptions in iceland that start with a distant fissure eruption which then stops. Some time later (period unspecified) the main volcano then goes up. Given the rifting its not improbable that the initial opening (most;y due rifting) of a narrow dike is the easy way for magma to get to the surface. This then stops and solidifies and that takes out the rift strain. However as its long, narrow and now stress-free it is hard to reopen. That then puts the incoming magma back to its historic weak point, the original volcano. There can be little doubt that bardy, having had its rocky cap ground up and down the caldera sides, is relatively free to move, constrined only by its mass.
One day, perhaps….
Interesting line of reasoning. A lot will depend on whether there is another rifting episode in the Holuhraun area, won’t it? If we get more rifting, then that could provide a channel for the magma to form a dike and relieve pressure in the caldera. And the amount of pressure there obviously depends on how much magma is being emplaced.
I would not bet on an eruption at Holuhraun area.
The pent up strain there was all released during the eruption and it will not erupt for another 130 to 250 years.
No, it will either be an intra-caldera eruption, or a rift eruption down towards the SSW. My bet right now is an intra-caldera eruption.
OK – I’ll give my bookmaker a ring and tell him to withdraw my wager on Holuhraun. Thanks for the tip 😉
SSW – Intriguing…
It is closing in on rifting time down there.
Only question is if this time there will be a skip in the rifting cycle or not.
And of course which volcanic fissure swarm it will be that does the rifting. Eldjá, Veidivötn, Raudhólar or Laki.
“Eldgjá, Veidivötn, Raudhólar or Laki” – now there are some names to conjure with… Very interesting…
What is also interesting is that the quakes went deeper in succession.
Friday
20.05.2016 07:21:06 7.2 km M2.3 1.0 km SSE of Bárðarbunga
Friday
20.05.2016 07:20:00 9.3 km M2.8 6.7 km ENE of Bárðarbunga
Friday
20.05.2016 07:17:53 8.9 km M3.3 4.6 km NE of Bárðarbunga
Friday
20.05.2016 07:11:45 6.1 km M4.4 6.4 km ENE of Bárðarbunga
Friday
20.05.2016 07:11:40 2.3 km M3.3 3.5 km NNE of Bárðarbunga
And there was perhaps a brief tremor episode given the tremor plots, since the signal was longer than the amount of actual quakes and the time span they were in. but it could be due to the depth of the quakes that the signal was “prolonged”.
It also looks a mess on the drums. 😀
Forgot to add, KISA station. As Carl once said, a few days to a week worth of data on the GPS plots can show a (new) trend. So given that, KISA looks to be “inflating” again, both in the short term, and in the longer term average.
I updated the plot of the current series of earthquakes (M2+ since December 2015). Top left is the location, top right latitude versus depth and bottom is longitude versus depth. You can see that the deepest quakes are towards the west, perhaps where the magma is coming from. At depth, the new earthquakes cluster around the region where the earthquakes occured during the eruption (cloud of black dots in the background), but they don’t go into this region. Speculation: the smashed up rock from the previous quakes now lets in magma and acts as a mini-magma chamber/conduit.
And something else I noticed about the current quakes: if you plot magnitude (or rather energy) against depth, the strongest quakes fall on a straight line. The drawn line is the energy needed to lift a column of rock with that depth and area about 0.1 square kilometre by 10cm. Of course the precise numbers were chosen carefully. The plot shows all M3+ quakes in the northern half of Bardarbunga.
I think this is consistent with increasing pressure at depth. The reason that the quakes started shallow and have grown deeper is that it took time for sufficient pressure to build up. At lower depth, less pressure was needed to counter the weight of the rock. The reason it goes quiet after a bigger quake is that pressure has been released and it takes a while for it to build up again
Great plots Albert! Thanks.
So then I guess the question is what causes the pressure? Falling plug, or influx of magma at depth, or both? The GPS inflation is kinda confusing for the plug-only theory, and we would need the central caldera GPS working again, because that would shed a light on many things.
Not a falling plug: that would not have shown the increasing depth with time. Pressure can be dominated by gas. I would guess a bit of degassing new magma.
Here are also two interesting plots from IMO for Bardarbunga caldera. We can see the increasing energy release trend since late last year, around the time the inflation re-appeared on GPS stations around Bardy. We can also see that the M4.4 from today really is the strongest one in a while. And we can see that the stronger quakes are increasing with depth over time. This really is an interesting trend developing.
We can slso see as the quakes in the dike reduced, the quakes in the caldera increased at the same time.
Interesting pair of graphics to think about.
Here is what the IMO had to say about the quakes at Bardy: http://en.vedur.is/about-imo/news/on-the-bardarbunga-earthquakes apparently there is some inflation going on there.
very nice. its kinda in line with what was previously discussed a month or two ago in the comments down under (no pun intended) in an older article. I have posted the GPS plots, mentioning an obvious change around September last year, complimenting the previous discussions about a change in seismic patterns in Bardy around the same time, starting a “seismo-inflating” trend, consisting of specific EQ and GPS patterns, that is still ongoing.
http://www.volcanocafe.org/grimsvotn-the-saksunarvatn-tephras/
It agrees with what has been said on this blog: the opposite movement to that before, signs of inflation and increasing pressure. But no rising magma as of yet.
Magnitude 6.2 quake hits central Australia at 10km depth – USGS
I wonder if anybody felt it.
Two people filled out a “felt report” with USGS – but in a country which has few quakes then few people would even be aware of the USGS Earthquake site. Those reports are MMI V at a distance of about 130km.
Good Lord that was funny! I need that. Thanks!
Uninhabited area west of Uluru. It is not in a high risk area for earthquakes but they do occur here. There could be a lot of small aftershocks over the years, as happened in Tenant Creek, further north
The link is a hazard map of australia
http://www.smh.com.au/pdf/geoscience-australia-earthquake-hazard-map-1991.pdf
Probably related to this 😉 https://en.wikipedia.org/wiki/Banjawarn_Station#Seismic_event
Most of which should be given a close shave with Occam’s razor. When geologists are saying it looks like an earthquake, smells like and earthquake, tastes like an earthquake, and wasn’t very unusual anyway if it was an earthquake – it’s a very long shot to say it wasn’t.
You are absolutely correct.
It was an earthquake.
The same shit happens here in Sweden when we have an earthquake that is big enough to be felt. People just refuse to believe that stable bedrock can have earthquakes and instead they invent other crazy crap.
Agreed. Port St Joe fault goes off, people start depositing bricks and picking their favorite villan industry to blame. Most don’t event know the fault exists… yet only through the activities of the villain industry do we know it’s there. BTW, it’s an ancient transform fault (along with the other 14 or so) that are left over from the opening of the Gulf of Mexico. At one time, the crust under Tampa used to be just south of New Orleans.
After such an energy release, Bardy will probably take a small break, until the pressure/strain increases again, and again and again, for whatever the reason might be. The bigger question is if it will end just like it began, or something somewhere will give…
Something will definitely give in the near future, the strain is increasing rapidly now.
Question is probably more about when Bárdarbunga will erupt again and not if.
Hello, I am going to erupt within the next couple of weeks. Just teasing you a bit.
Aksimet was not convinced by this and put it in the dungeon on suspicion of identity theft
Meanwhile back in Sicily, Etna still looks busy too…

New study on periods of “unrest” in the Fire Volcano
http://meetingorganizer.copernicus.org/EGU2016/EGU2016-17738-1.pdf
They are identified 3 periods of episodes of disorder (unrest) in the Fire Volcano in the last 30 years, 1989, 2003-2006, 2011-2012, but the fact that they have not been verified geochemical and hydrothermal alteration, does not encourage discussion of a reaactivamento the fire volcano, but based on the GPS data was found to inflation in the last two episodes volcano, indicating that these events have igneous origin. …
Australia seems to be having a little swarm 11 earthquakes so far today in the Northern Territory.
http://www.emsc-csem.org/#2w
Turrialba is playing up
http://www.bbc.co.uk/news/world-latin-america-36348904
Turrialba must be at the opposite end of the spectrum from Hekla. 1996 -first reports of increasing seismicity above background level since the start of regular monitoring. . 2007 – first report of fumarole temperatures going up signficantly (from 88-93 degrees to 138). 2010 – first phreatic explosion; 2015 – first magmatic event of the cycle. Talk about a long fuse!
One would remember well that the first seismic swarm recorded at Eyjafjallajökull was in 1991, 19 years prior to the eruption. And that is the closest active volcano to Hekla.
And then you have Grimsvötn who just putters along semi-quietly with small earthquakes every now and then for 2 to 10 years and then go boom.
It is amazing how differently volcanoes can behave, even if they are close to each other.
Two killed after Mount Sinabung erupts in Indonesia triggering ash fall on nearby village (via @resppb)
The images are terrible!
You don’t happen to have a link?
German news has it at 3 fatalities.
I try to post but sistem didn’t let me… https://twitter.com/L0gg0l
[b]Deadly Mount Sinabung volcano in Indonesia erupts[/b]
THREE people have died and four others were critically injured after a highly active volcano in western Indonesia erupted violently, shooting hot ash and gases into the atmosphere, an official said.
“Seven people were exposed to the hot clouds, killing three and leaving four others in a critical condition,” he said in a statement, adding the injured had been taken to hospital.
Several houses were also destroyed during the eruptions, which sent hot gases and columns of ash three kilometres into the sky, he added.
The victims were farming within the “red zone”, an area four kilometres from the volcano declared off limits by government authorities for safety reasons.
http://www.townsvillebulletin.com.au/deadly-mount-sinabung-volcano-in-indonesia-erupts/news-story/9d3f896c8ebd6d2348ece582bdcf30ce
Poor sods.
Judging from the pictures it is monsoon season to boot.
Sinabung has for quite some time been a disaster in the waiting, and since the farmers really need to farm their land it was a given that sooner or later someone would get hit by a pyroclastic flow.
One of the sad things in poorer countries is that people will have to farm even in red zones to be able to eat. After all, the soil is most fertile near volcanoes, so there you have the best fields.
Yes it’s really sad and heart breaking… but it seams it was a big eruption and without warning… it is right?
It seems like it was one of the bigger pyroclastic flows. But it was expected to happen and there will be more of them. The exclusion zone is there for a reason, and anyone entering them is in mortal danger.
Ok, thank you very much!
I’d guess a major dome collapse?
Ditto on the exclusion zone being there for a reason. It falls directly in line with the only way to 100% survive such an event. “Don’t be there”
They have lost quite a few animals and cattle too… Nasty pyroclastic flows Sinabung that throws out each time. This one ran straight through a village. Perhaps it was just outside the exclusion zone? Are the pyro’s just throat clearing? If this one really goes, 4 km may not be enough.
No, the village is outside the exclusion zone, but the fields are within, they where brought to the village. It is the same that we see in the cam-view.
The pyroclastic flow did not hit the village.
This volcano produces really thick lava that can’t flow so it forms a tongue that will break apart into a pyroclastic flow. It is not expected that volcano will become more explosive.
The death toll is now reported at 7, possibly more, all from within the exclusion zone. Terrible news. It also shows that the Indonesian authorities are very good. They put the zone at the right distance, but it is obviously very hard to strictly enforce it. If they had not been as accurate, the casualties could have been far higher.
I have said it many times. The Indonesians are quite simply the best at practical volcanism. The rest of the planet could do well to study how they work.
The Italians and the Icelandic are also very good, but the Indonesians are a bit better and have to be since they have so many people living so close to such monster volcanoes.
And fully OT, and a bit spooky…
DNA testing confirms 3 gators captured in S Florida were actually Nile Crocodiles.
http://www.usatoday.com/story/news/nation-now/2016/05/20/nile-crocodiles-aggressive-invasive-species-found-florida/84643472/
Sombeone has had fun and released their tame ‘gators into the bayou. Same as they did with the burmese pythons.
Problem is that the nile crocs will take over and annihilate the gators over time. But, deep fried croc tastes like deep fried gator so no big loss. Nature wins every time we humans move animals about.
And in this case it is that a nile croc is far more likely to eat you when you hunt it than a gator is.
To be specific, a gator can munch up your kid, the nile croc will munch up a fully grown human and the donkey you sit on in one gulp. They do grow to 7meters in length after all.
http://www.miamiherald.com/news/nation-world/national/article75769292.html
Hard to say if such a small population of crocs could establish a breeding population. Small crocs make tasty gator food i imagine. Infant predation makes it hard for a similar species to establish itself.
The year without summer, it’s often mentioned how bad the year was etc, but rarely do we see actual numbers. These numbers are from the Faroes “Fellisárið mikla”=”the great sheep death year”.
Here follow some stats for the winter of 1815/16 which was unusually harsh, the summer however was average/good with only aprocs 15% of crops(mostly hay) failing, which isn’t anything abnormal. In one of the main regions of the of the country with 8.804 sheep registered in the fall 1815, only 5.184 survived until 8th of june 1816(for shearing), which gives us a mortality rate of 41% among the sheep. Way beyond abnormal numbers, these days 5 dead out of 300 living, is considered bad for a winter.
The names of villages are to the left. Number of sheep in fall 1815. Number of deaths. Number of carcasses that were managed to be salvaged and used. (it’s all in Danish as Faroese didn’t become a written language until 1854)

Interesting data. Where did you find it? To draw conclusions, you would need to look at the numbers over a large number of years, and see to what degree this winter stood out.
Mostly from a paper the university here in the Faroes published some years ago on the subject of “Year without Summer”, and some some stuff from old newspapers. The numbers mostly came from diaries/almanacs by local farmers, who were wont to write weather conditions down daily or weekly, the numbers span the period 1813-1892. There were other bad winters in the period 1827, 1879 and 1881, though non bad enough to warrant a “name” as the winter 1815/16 did.
*In the period 1813-1892. The winters 1827, 1978 and 1881 stood out beside 1815/16
‘1978’ = 1879 ?
yeah that was a typo
The winter of 1827 was exceptionally warm in the eastern US, so there may have been a high pressure block on the Atlantic. I found a note on food shortages in France in 1827-1830 but no clear link to the weather.
http://www.uark.edu/misc/dendro/PUBS/2007_Mock_etal.pdf
1879 followed a very strong El Nino. I don’t know what that normally means to the Faroes; in the UK it tends to give very wet but mild weather.
El Nino’s tend to give us cold, crisp and generally dry weather. This winter has had some of the best weather of any winter that I can remember, hardly any snow though.
Last years winter/spring was horrible though, loads of snow far into May, with massive die off among the sheep, specially newborn lambs.
In itself this shows little. Given that stock numbers depend on the carrying capacity of the land stock numbers tend to remain stable over a number of years. So if each ewe produces one lamb then the peak numbers (typically end of summer) ought to be about twice the minimum numbers (about breeding time late spring). That is, a 50% reduction is normal. Generally its less effort to keep animals alive and kill as required than to kill and preserve. Herbivores are great for this sort of system (pigs and poultry are poor). This is not to say that these figures are not abnormal, but in themselves they are not interesting. A 20year sequence, and particularly the numbers the following year (indicating a high mortality the winter before) is interesting.
Also please note that average lifetime for organisms depends on the breeding rate. So two cows (m+f, obviously) produce one calf a year and the average lifetime is 6 months. For rabbits producing 24/year its only a few of weeks. Its just maths.
I agree with the need to compare with a long sequence of data. It seems to me that the numbers are only for ‘unscheduled’ death, and are only for sheep of one year old or older (not newborn lambs) over the winter. If a sheep that makes it to year 2 lives on average naturally for 10 years, the normal death rate would be roughly 10%.
The image posted above is actually from a newspaper article describing the year, so obviously in itself it shows very little of the whole picture, beside the fact that there died enough that winter to warrant a newspaper article with numbers. Something I should have thought of before I wrote the first post, thus making it more “credible?”.
I don’t have access to the full paper from the university atm, where graphs and stats are lined up over a 79 year period(with occasional gaps), and showing the strong dips in years 1816, 1827, 1879 and 1881(the two latest actually I think being the worst years). Will try to get my grubby mits on it in the near future.
But you are right that the numbers are only for “unscheduled” deaths for ages 1 year+. Slaugther is usually in october, where the sheep deemed strong enough to survive the winter and to reproduce are let out again in the wild, ensuring a overal low natural mortality rate in a standard winter. Where a 5-10% mortality rate sucks, but is still somewhat acceptable. Unlike what the numbers above show for example in Kunøe wich has a near 60% mortality rate and Deble with 71%. Gierðum on the other hand is only down at 12%, but knowing the geography of the area, that is right next to a village where someone would be able to keep an eye out most of the time.
As a sidenote, if memory serves, the summer was actually quite nice, just really short, with frost and snow nearly weekly from new years until may and starting again in october and onwards. Which by any standard, is out of line here in the country.
“Slaughter is normally in october”. Maybe now but I doubt in a nearly 100% agricultural setting with limited sale of meat as a cash crop that would have been so then. The cash crop would most likely be wool (probably finished or semi-finished), the sheep eaten as required. Its dangerous to use modern techniques, management and regulations to view ancient times. Note that I am NOT saying this mortality was not unusual, it just may have been not SO unusual. Today people struggle to understand just how variable food supplies used to be. Round here its quite common to fine farms on the downs called ‘starveall’ (starve all) for good reason.
And england is by comparison a warm and benign climate.
Slaughter has been performed during fall, (october-ish) as far back as people know and written sources go, the various “herding” times are named for their specific intention, like shearing in may-june, or slaughter in fall. Wool products has in the olden days been the main cash crop(until fish took over). Meat from sheep would be and still is, hung up to dry/ferment, in some cases up to a year, and eaten as required(with fish, sea-fowl and whale meat being used for variation).The rest of the time the sheep will wander the mountains on their own and stay away from people.
The management and regulations are still pretty much the same as back in the day, though they did without a doubt pay more attention as a whole to the sheep back in the day. Supplementing feed and such however are quite common during winters today for those who have easy access to their pastures.
There are still people alive who remember a time with earthen floors and peat heated houses, electricity didn’t come to my village until the early 1960’s, ancient times aren’t so far back here as in the rest of the western world.
Years with high mortality rates have not been uncommon at all, I totally agree with you on that, there are plenty of records of bad years, last year was one such. But stand out years so bad that they are named are really uncommon, 1816 was one such year. Also one year in late 1700 “Svartafelli” “The black mortality year”(the exact year isn’t mentioned, but I suspect it was during the Laki eruption) was so bad that only 1 in 10 sheep survived on some islands, which makes it worse than 1816 by a considerable margin.
England may be a warm and benign climate in comparison, you guys are however by far much more likely to experience staying snow, and frost in winter than we are, even if your winters are generally much shorter than ours.
Define ‘normal’. I specified average, I suspect you are talking ‘maximum’ many might use median (although that;s very similar in these examples). Very few sheep born would ever live to 10 years old.
Probably different regarding the circumstances. The infallible source of wikipedia specifies 10-12 years as an average sheep life expectancy, presumably corrected for those removed from the living as lambs. That is why I excluded the lambs from the average: their life expectancy may be quite short.
Wiki is wrong, period. I can prove this and so can you. In the wild if the average ewe lived 12 years and produced 10 lambs then the popul;ation from JUST THAT EWE would have increased from 2 (M+F) to 12 , this is NOT compatible with a stable population. Period. Maths never lies.
They mean some sort of maximum, its certainly not true of managed flocks as all the animals produced are slaughtered within 12 months.
As one who knows a bit about sheep an adult probably averages about 5-7 years. They do die of an inordinate number of things. Typically starvation+disease when a run of good years is followed by a very bad one in the wild. Predation is also important. Culling for food in our society fixes that (ie predation).
In a rural society where wealth is measured in head of stock its even more extreme as the result is to maintain numbers at the critical edge of its carrying capacity. This particularly evident in sub-saharan pastoral societies.
Isn’t that just begging for disaster? Staying right at the critical edge of carrying capacity will result in self-organized criticality, like sandpile avalanches (or earthquakes!), and sooner or later you’ll get a BIG avalanche.
I’ll happily accept your knowledge on the lower life expectancy of sheep! I know that in the Kruger, predators take around a quarter of antilopes each year, so that is the main limiting factor there. Predators are kept away from farmed animals, for obvious reasons. The problems of breeding rates holds for every animal: the large majority dies very quickly. The life expectancy of a 1-year old animal is typically dramatically longer than that of a new born. The stats quoted above corrected for that. The sheep catastrophe, in my understanding, is that so many sheep died in winter and spring, which was a dead loss (if you excuse the pun) as neither the meat nor the wool would be recoverable. 50% loss would be very bad for business. I would guess that in the high north, farmed animals are a major part of the food supply, agriculture being marginal both because of climate and soil fragility.
To fluid dynamics.
You are of course completely correct. This is why in many animal systems serious crashes occur regularly (and in some poorly managed human ones). Lemmings and locusts are not alone!
Predators tend to even things out (usually) somewhat but consider things like this:
http://www.worldometers.info/world-population/ethiopia-population/
I don’t think food production has increased hugely in the last 20 years.
The logistics equation, a hugely simple model, was one of the first systems to clearly show chaos. Worth a look. Lots of examples but try this simple starter.
http://hephaestusaudio.com/delphi/2009/02/16/chaos-and-the-logistic-map/
and more complete
http://geoffboeing.com/2015/03/chaos-theory-logistic-map/
Enjoy!
Making use of lead contamination in municipal water supplies… to learn more about the Vesuvius impact.
http://m.phys.org/news/2016-05-sediments-gulf-naples-reveal-impact.html
There was an M2.6 at Bardarbunga, at 16 km depth. Someone call Carl..
Interesting read, haven’t seen it posted here before.
https://www.cam.ac.uk/research/news/increase-in-volcanic-eruptions-at-the-end-of-the-ice-age-caused-by-melting-ice-caps-and-glacial
I had not seen that paper before. At the end of the release, they talk about needing to explain the asymmetry between ice age glaciers taking a long time to grow but a short time to melt. But that is well understood: it is easy to see why it takes 100,000 years to grow a 3km icecap (limited by precipitation) and why it melt so much faster (once melting at the top begins, temperature increase as melting lowers the glacier, by the standard 1C per 100 meter). We also know why ice ages continue until the peak of the Milankovitch cycle. So on this point the release is trying to solve something tat has been solved already. Of course, I may be misunderstanding something. Otherwise, it seems likely that the glacial melting did increase eruption rates, although it is not so easy to proof it statistically.
Etna seems to be working up to her next ‘parossismo’:

Hi
I have been watching the earthquake plots of vatnajokull for a long time and was wondering if there was an explanation for the line of quakes that appear (intermittently) from Grimsvotn towards the south tip of Vatnajokull trending in a roughly south-south easterly direction (I think towards oraefajokull)
That’s an intriguing question. We don’t know a hell of a lot about Oraefajokull. For starters it’s quite a long way from the main volcanic belts; where does it get its magma?
You could say that for a LOT of the Ielandic volcanoes if we’re being realistic.
Good observation – this has been brought up a bti in the last 1-2 months. It seems to be a feature that we had not previously seen prior to the last 1-2 years, and there is some speculation that there is a fracture zone or a fault that runs along this area.
Big quake just now
Not 100% cheked yet:
Monday
23.05.2016 17:37:48 64.610 -17.349 1.1 km 3.0 90.07 9.2 km ESE of Bárðarbunga
Monday
23.05.2016 17:37:47 64.619 -17.413 0.3 km 3.4 99.0 6.0 km ESE of Bárðarbunga
Nothing is going to happen at Bardy…
Shhhh..because I said that above it will.
Very shallow. How to interpret that and the drum signal. Looks like it was going on for a while…