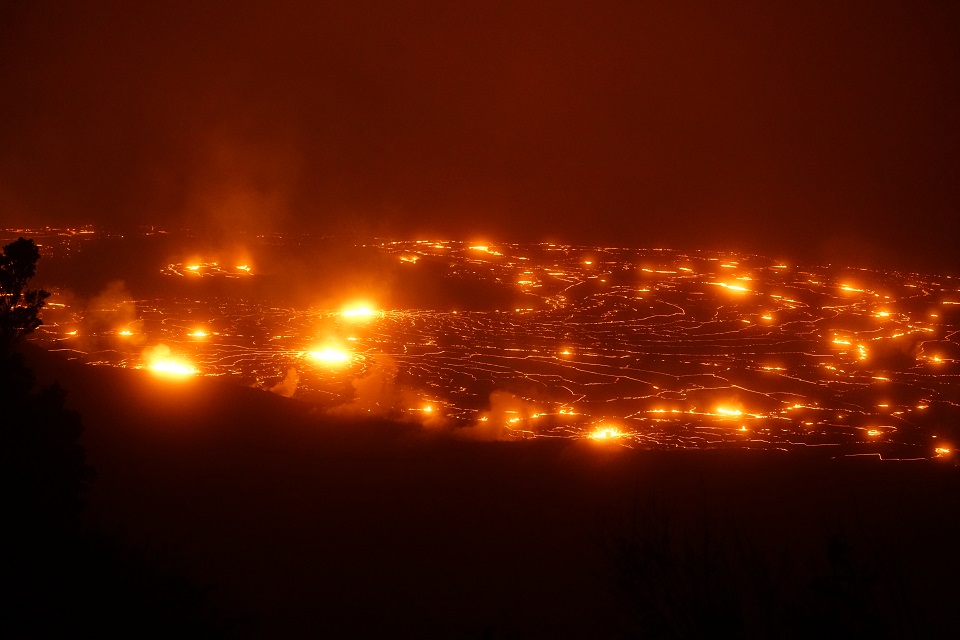
NPS Photo/M.Newman. Source https://www.nps.gov/havo/learn/news/2023-01-06-2023-kilauea-erupts.htm
Tyger Tyger, burning bright,
In the forests of the night
(William Blake, The Tyger)
Lava is lovely. The warm (or hot) red colour gives it beauty, and the intricate movement of a lava flow makes it mesmerizing. But it is at night that the lava really comes to life. What appeared shiny black in the light of day, becomes incandescent in the dark of night. The solid crust is still black. But wherever this crust breaks and the liquid lava below comes through, it shines with a bright red or orange light. If you have the chance, go and have a look at lava at night. It is an experience for life.
The light is a matter of temperature. Lava at 800C appears red. If it looks more orange (and much brighter), then it is probably 1000C or more. The solid crust is 500C or less and this produces little light that our eye can see – in any case, the brighter lava drowns it out.
Our eyes, of course, are not optimized for seeing lava. Our skin is rather better at it. Lava, like one of our old incandescent light bulbs, emits far more heat than it does light. (LED lava has yet to be invented.) Almost all the energy comes out in the infrared which we can’t see but can feel. In fact, that shiny black lava may not look that dangerous in daylight, but our skin tells us to stay well away. The radiant heat feels burning hot even a few meters away. If we had infrared eyes, that lava flow would look like Dante’s infernal hell.
Lava-fires
In what distant deeps or skies
Burnt the fire of thine eyes?
On what wings dare he aspire?
What the hand, dare seize the fire?
But we don’t need to change our eyes. Nowadays we have cameras that can ‘see’ infrared light. Some see ‘thermal infrared’, sensitive to body warmth. These cameras reveal wildlife (or people in hiding) at night. Some see much hotter things: point them at a train and the wheels show up brightly while the rest of the train is dark. And some look for even hotter stuff, such as fires – or lava. And best of all, we can put those instruments on satellites, allowing us to see places we cannot get to.
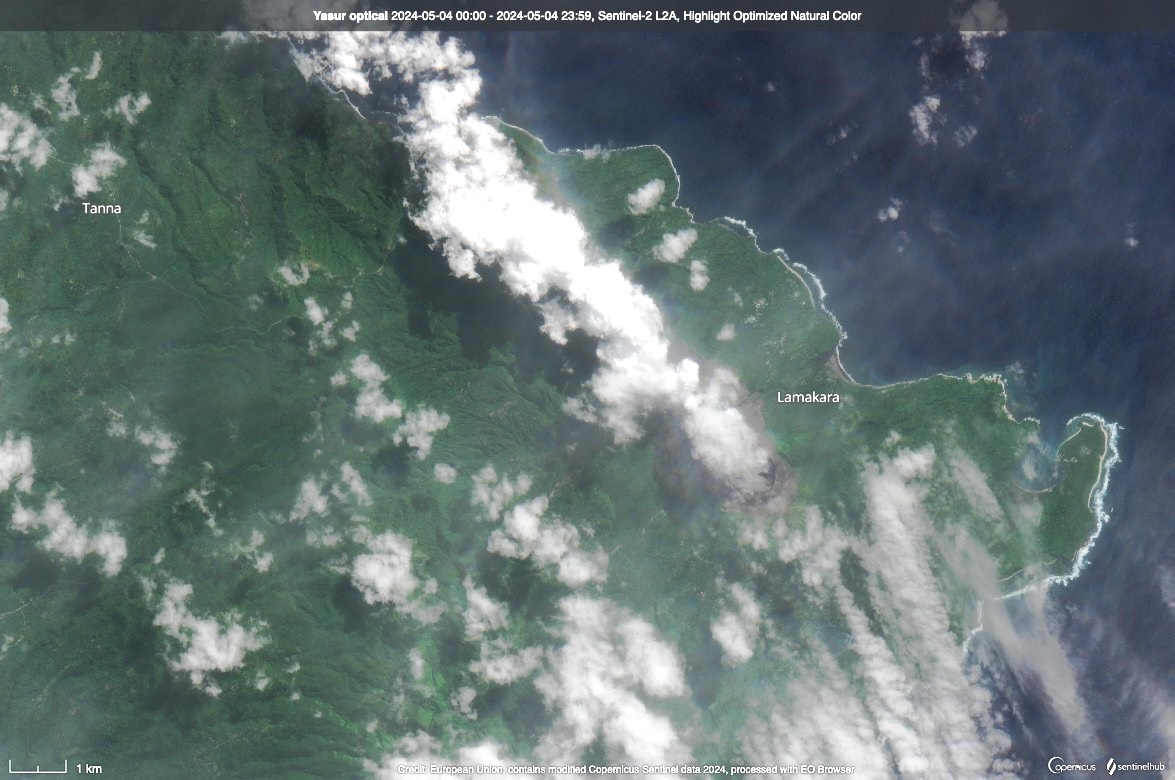
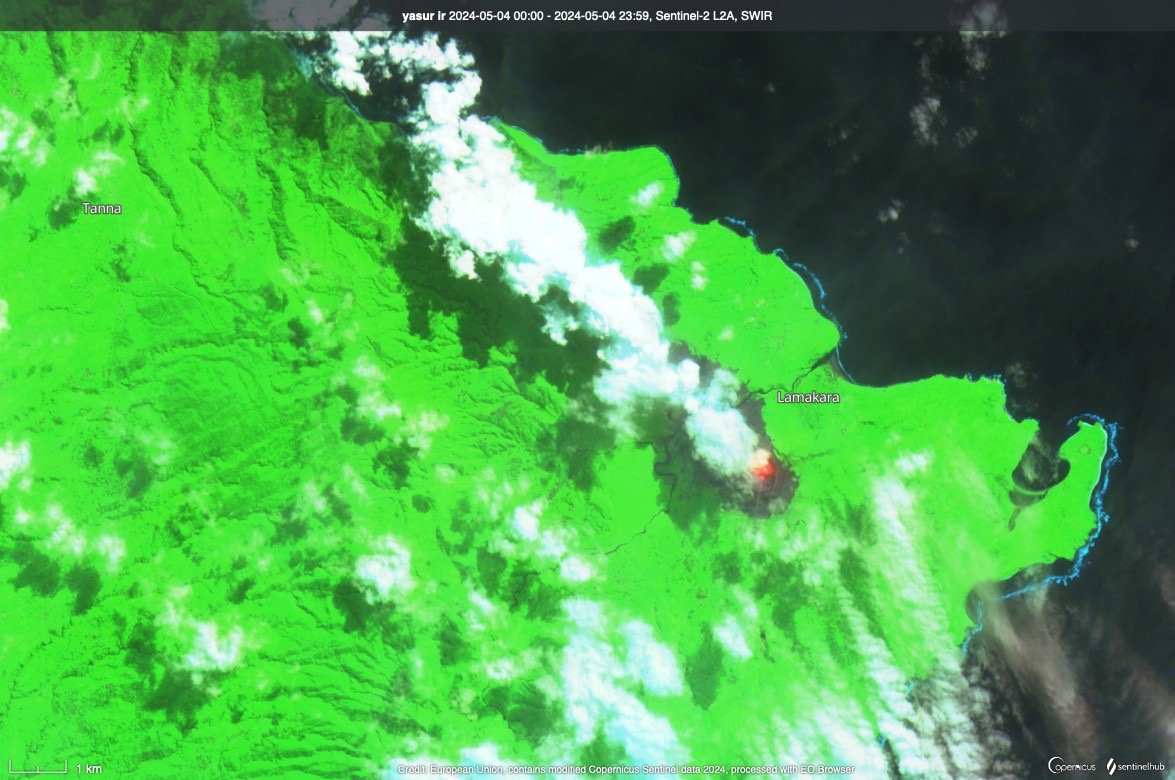
Here is an example from the European Sentinel satellites, with an image of the region around Mount Yasur on Vanuatu. The first image is taken in visible light. The second one combines this with an infrared image. And suddenly, the lava lake at Yasur comes to light.
The infrared filter used for this detects light at a wavelength of 2.1 micron, about three times longer than our eyes can see. This is ‘short-wave infrared’ and is sensitive to hot lava. These filters were not designed specifically for lava. The filters were devised for reflected sunlight: this filter is good at picking up reflections from burned vegetation. But hot lava emits infrared (heat) radiation and that is also picked up. The lava needs to be hot, and therefore the filters mainly see the on-going effusive eruptions. Hunga Tonga may have been missed. If you want to try it out (https://apps.sentinel-hub.com/eo-browser), pick the ‘False colour urban’ or the ‘SWIR’ visualization.
The MODIS instrument operates on two NASA satellites: TERRA and AQUA. It sees a very large area (at lowish resolution of around 1 kilometer) over a very wide range of wavelengths. They go to much longer wavelengths than the Sentinel. The main infrared bands rage from 3 to 14 micron. Therefore, they are in principle sensitive to cooler magma. (Be aware that for some of the bands, the atmosphere is opaque so the satellite will only see the upper atmosphere.) The main bands to use are those around 4 micron.
Both satellites are now quite old. A newer satellite doing this work is Suomi, which is ‘only’ 13 years old (the usual expected life of such a satellite is 5-10 years). (These satellites were designed for climate monitoring and perhaps the delay in replacement is related to the ‘don’t look’ attitude towards global warming that is held by some of the people in charge of the funding.) The relevant instrument on board Suomi is VIIRS. It is not quite as versatile as MODIS but covers a similar range of wavelengths. The band that is labeled ‘fires’ is at 4 micron and should easily see lava at 500C. (It is currently out of operation due to an issue with the GPS.) Of course, not everything that is hot is volcanic! Ukraine also showed up well, under explosive attack from Russia.
The MODIS and VIIRS data are used in a system called ‘FIRMS’, which aims at detecting fires anywhere in the world. It can be accessed at https://wvs.earthdata.nasa.gov: just set the country name and resolution and off you go. Below is an example for Rwanda, where the cut-out shows two small hot spots, corresponding to Nyiragongo and Nyamuragiri in the Virunga mountains (neither are in Rwanda, but countries don’t fit well into square boxes). There are 6 peaks taller than these two in the Virunga mountains, but none of the others currently show this heat signature. Their fires are extinct. Note that this system by default shows data from today: buttons on the preview can be used to show recent days.
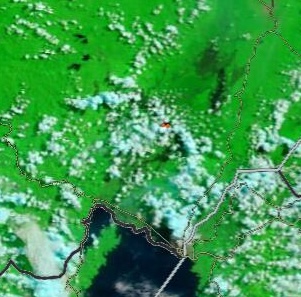
Virunga
Again, not everything that shows up is truly volcanic!
MIROVA
Did he smile his work to see?
Did he who made the Lamb make thee?
The VEI scale (volcano explosive intensity) is, as the name says, suited for explosive volcanoes, the flares in the night that are gone by morning. This scale is now widely used, and it works well for those volcanic tigers, albeit nowadays focussing on only one aspect, the volume ejected by the explosion. The VEI scale does not work well for volcanoes that produce copious lava but eject it at leisure, with a whisper not a bang. We need a scale for the volcanic sheep, one that properly puts them in their place and allows comparison with the big beasts. Their heat may be just what is needed.
The satellites can do this. The do more than just detect a glow of lava. They can measure the heat coming from those volcanoes. It may not always work well for explosive events where it is a matter of luck whether the satellite looked in the right direction at just the right time. Raung’s explosion was seen, but was it seen at its peak? But for effusive volcanoes, the eruptions last long enough to be captured in full. The heat gives us the energy, and the energy gives us the power of the volcano. It turns out that volcanic sheep are more powerful than they may seem.
The actual number to use is the ‘volcanic radiative power’. It is measured in Watts. By measuring this over a long period, the total ‘volcanic radiative energy’ can be calculated. This is the ‘VRE’, and yes, this is proposed to be used instead of the VEI.
The radiation comes, of course, from the heat, mostly from the lava but part is from hot gas escaping from the volcano. The lava reaches the surface at magma temperatures and then begins to cool. About a third of the heat is emitted while the lava is still liquid. Once the temperature has cooled to some 750C, the lava solidifies by continues to cool. The remainder two-third of the heat energy is emitted by the lava after it solidifies but before it has cooled to room temperature. It can be a slow process. The radiative power initially comes from the liquid lava and later from the solidified, cooler stuff. The power goes down over time, of course, but the total energy still ads up because this lasts a long time. The heat from the lava may also heat the ground and this stored heat can be radiated at a later time. Ground water takes up some of the heat. The volcanic plume carries heat upward in the atmosphere. To a satellite, that does not matter. It observes the site four times a day, 6 hours apart, and detects all the heat that is radiated there, whether directly from the volcano or indirectly from the air or the ground. Don’t expect detail, though: each measurement covers 1 square kilometer.
Robert Wright and collaborators did this for the period between 2000 and 2013, using the MODIS data from the two volcanoes. The results were eye opening. Of the volcanoes that stood out, Bardarbunga, through its 2014 eruption, accounted for 6% of the total volcanic heat production over that time. Tolbachik in Kamchatka produced almost as much: it had a large effusive eruption in December 2012, with some activity lasting until September 2013. But Kilauea and Nyiragongo were the dominant beasts, each accounting for 20% of the total heat! The latter did so without actually erupting: the energy came purely from its lava lake. The most intense eruptions of the period were in Afar.
Wright et al, 2014: Volcanic heat energy for the period 2000-2013
Diego Coppola and collaborators set out to improve further on this, again using the MODIS data. They combined the 4 micron and 12 micron measurements, to be more sensitive to cooler volcanoes. They included 111 volcanoes, for the period 2000-2019. This became the Mirova database. It is available on-line, and has been updated since: https://www.mirovaweb.it As I write this, Kilauea has shot to the top of today’s list, after it started to erupt, with a power output of just over 1 GW. The Grindavik eruption is doing less than 20% of that – at least at that moment.
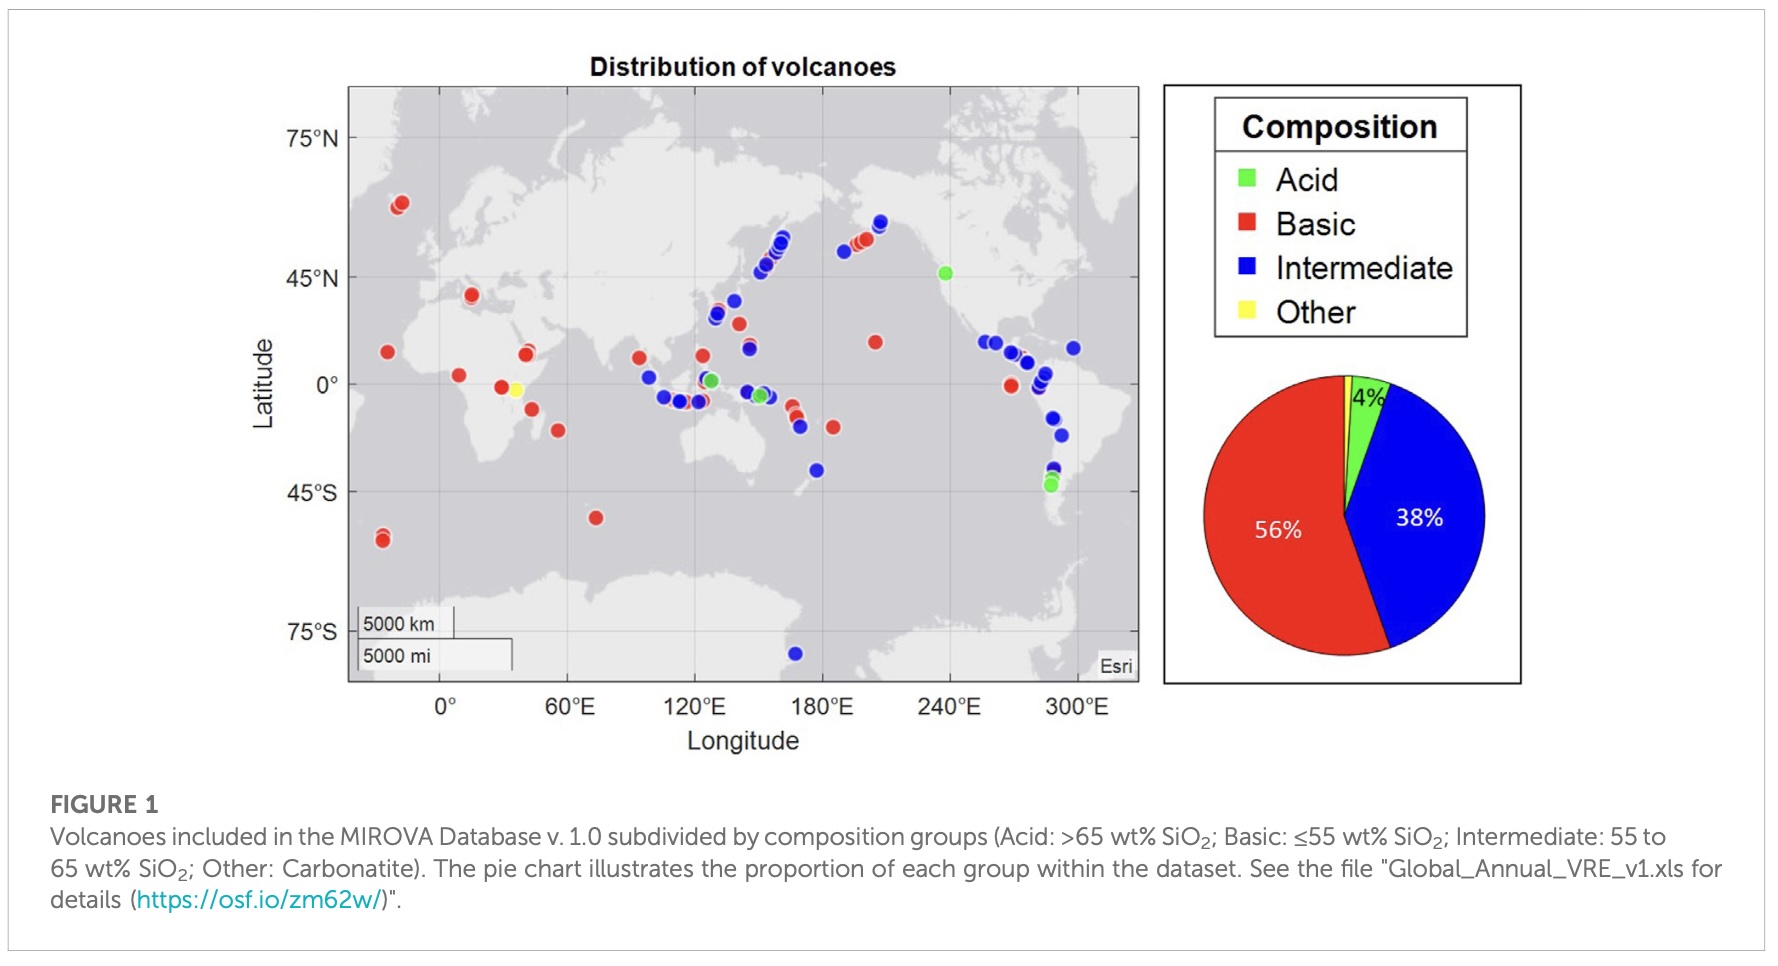
Volcanoes in the Mirova database
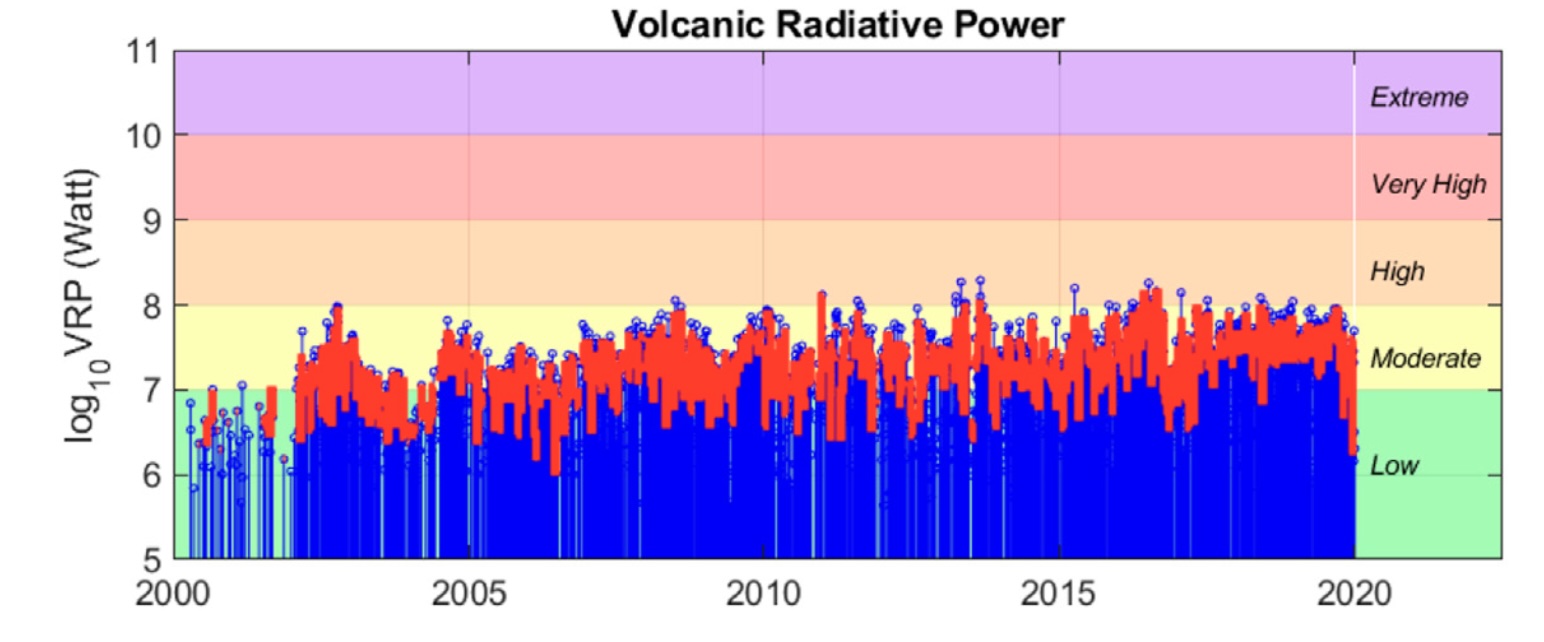
Yasur volcano has already been mentioned. It is in the Mirova database. The data for Yasur is shown below. The power of the volcano has increased over time by a factor of 2 or 3. Before 2003 the data is patchy and this is perhaps best ignored. And for comparison, the power output is about ten times less than that of today’s Kilauea eruption. Not bad for a volcano that isn’t actually erupting!
The most intense eruption (regarding heat output) of the period was Kilauea in 2018. Looking at the plot below, it is clear that the peak output of the 2018 eruption occurred not at the start but sometime later. Bardarbunga in 2014 was different: it peaked at the start and declined after that. There were a number of fast eruptions during the period of the plot but they did not reach the same peak, and of course did not last long.
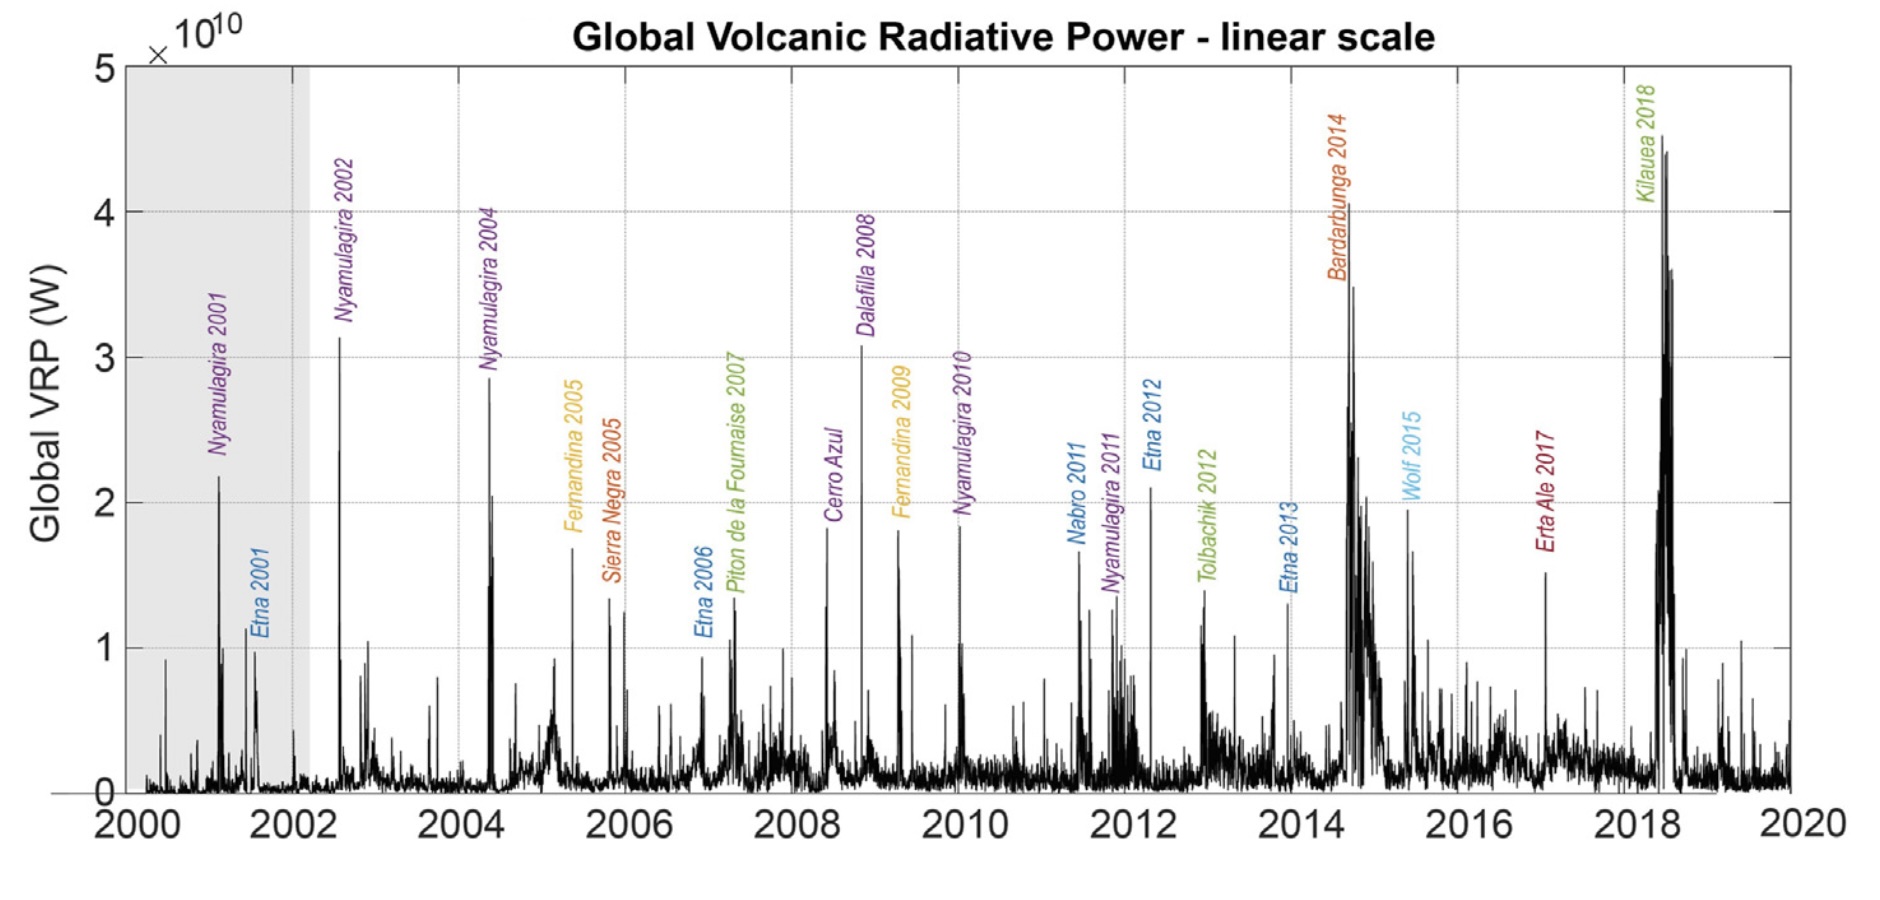
What does it look like when adding up all the volcanoes together? That gives the plot below. (Note that it is now on a logarithmic scale while the previous graph is linear.) The two big eruptions of the time still stand out. The red line gives a weekly average and the black line a daily one. The orange line is different: it is the contribution of Nyiragongo alone, a volcano that is not mentioned in the first plot. Its contribution has been continuous after 2002, due to its long-lasting lava lake which was growing during this time.

How many volcanoes are active at anyone time? This is not the same as how many are erupting: it is about how many are producing heat. The answer is, a lot. The study found 60-80 per year, and 25-40 each week. Many are remarkably persistent. Defining this as the fraction of weeks that a volcano produces heat, 13 volcanoes have a persistence of more than 80%. Erta Ale has the top persistence and Yasur is the final one of the 13 above 80%.
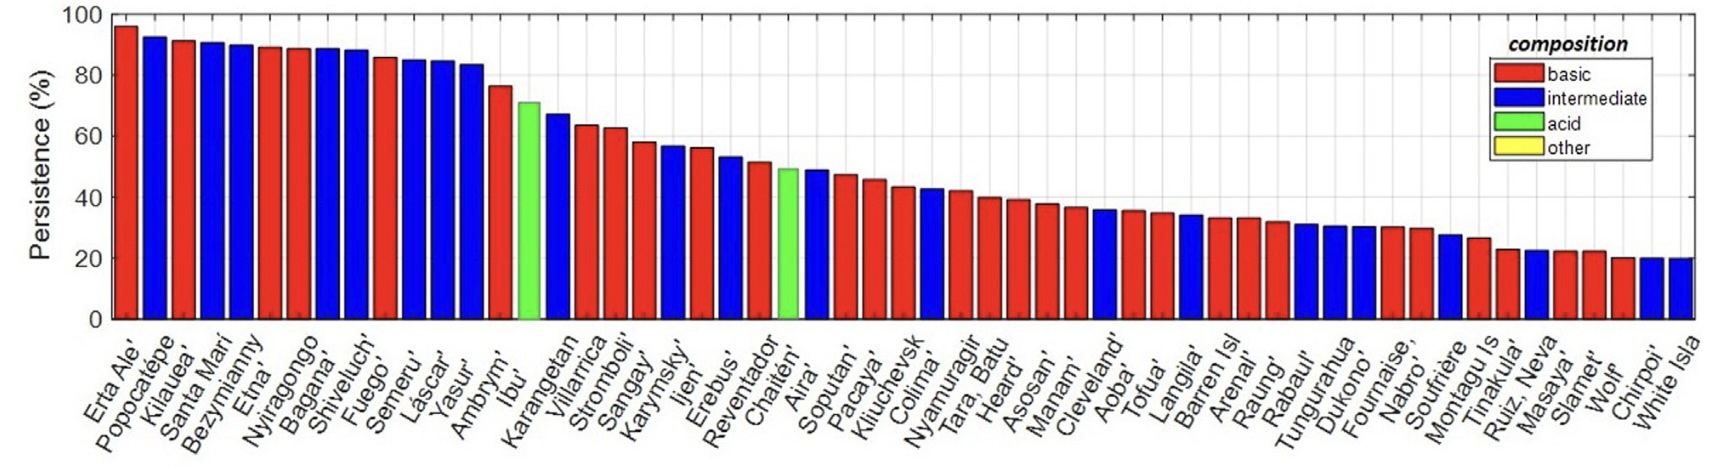
The persistence can come in different ways. A lava lake is a big help. An open conduit can act as well (Yasur). Finally, a lava dome also creates persistence, as seen for Popocatépetl.
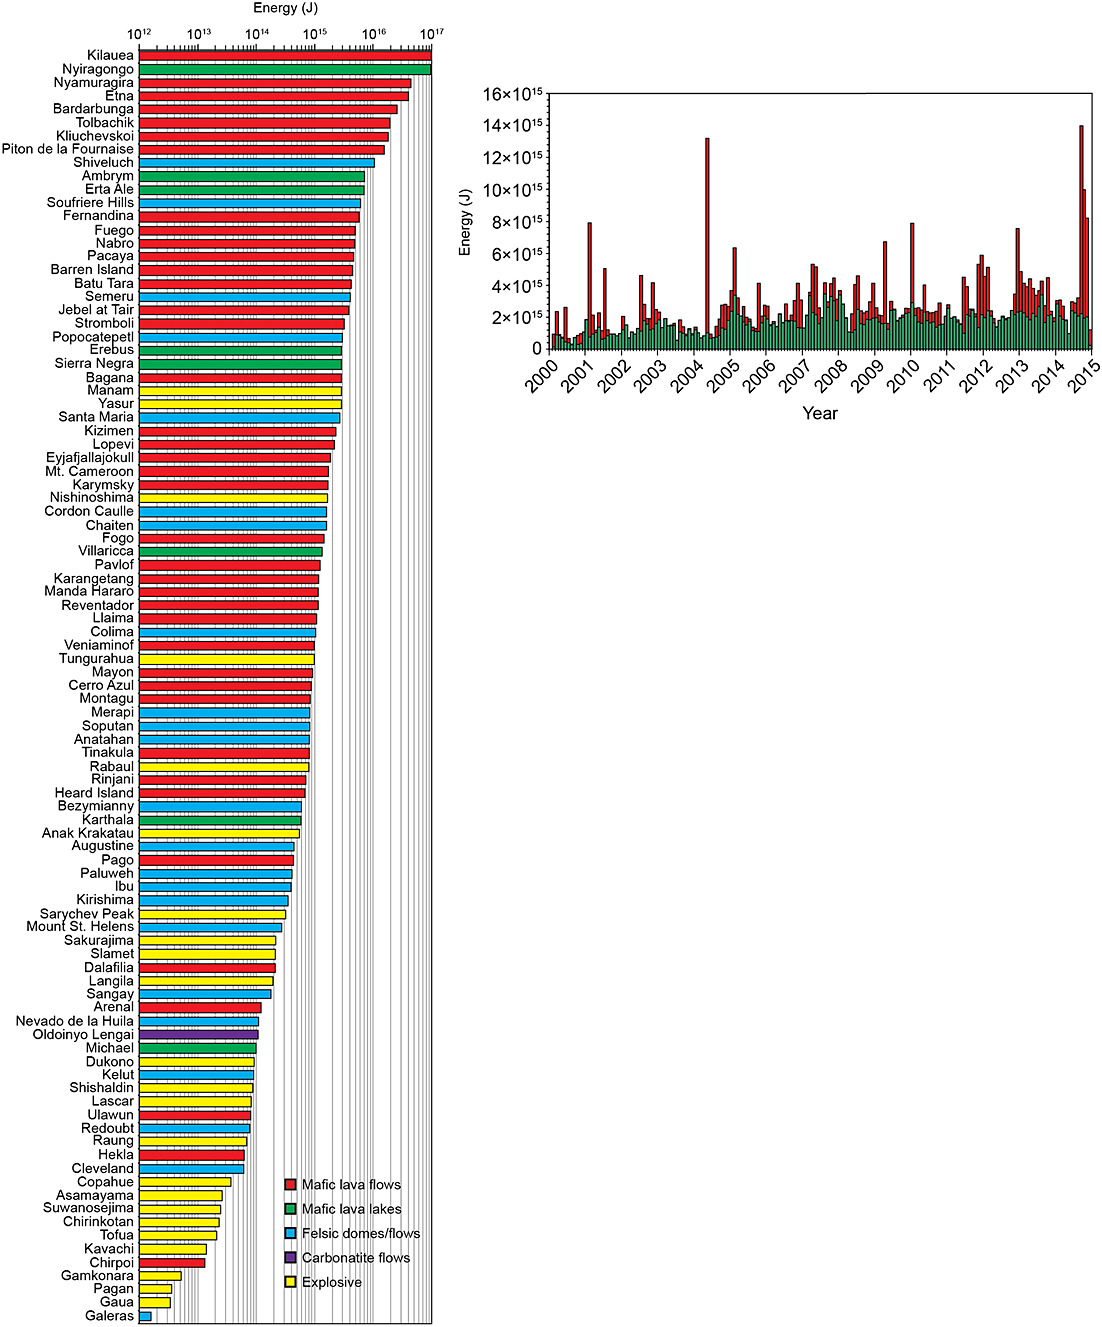
Ranking the volcanoes on total energy output over the time gives the ranking below. Kilauea wins, and Bardarbunga does well even though it erupted only once (it is likely to drop out of the top 100 next time). But two of the top four are in the Virunga mountains! Hot spot volcanoes do very well – not surprising as they have a reliably source of heat, something subduction volcanoes don’t have.
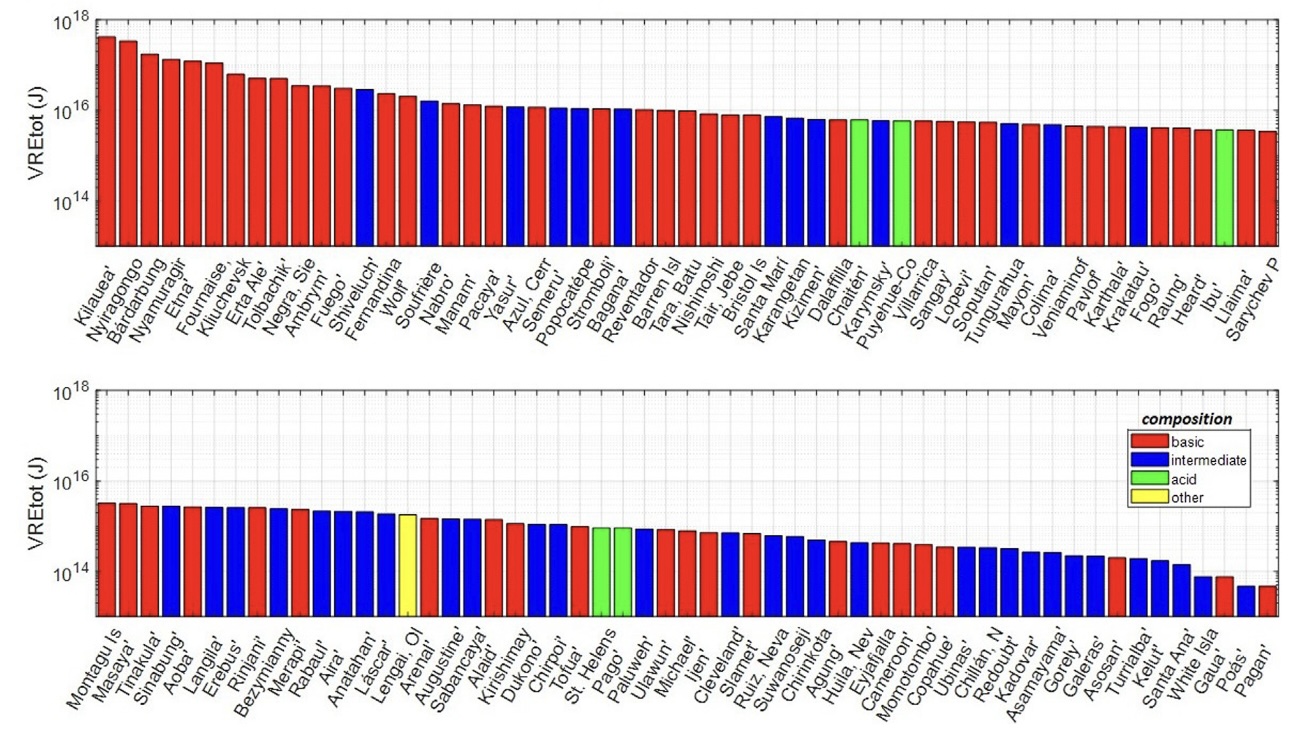
This should however be seen in the context of the short time span of only 20 years. There were no large explosive eruptions in that time. Tambora’s energy output is estimated at 10^20 J. That is more than 200 times larger than Kilauea’s over 20 years. Over the 200 years, Tambora still outperforms Kilauea by a factor of 10. Laki is another comparison: it may have emitted ten times as much energy as Bardarbunga did in the past 20 years, so over 200 years it would be similar to Kilauea but ten times smaller than Tambora. Tambora would still be off the scale.
An eruption of Tambora’s size may happen perhaps once every 500 years. Over that kind of period, the top volcanoes in the list would generate a few times less energy than Tambora. So the ranking of that time would still have the big VEI-7 at the top. But Tambora may take tens of thousands of years to be ready for another event like this. Over such a long time, the numbers are very different. 20 or 30 of the listed volcanoes could outperform Tambora over that time.
The bottom line is that over very long periods of time, the slow burners such as Kilauea and the Virunga volcanoes win out over the big explosive volcanoes. Sheep versus tigers: the tiger explodes into action but only briefly. Sheep have the same (limited) activity all the time. In the end, they produce or use very similar amounts of energy.
The energy that a volcano produces is not directly related to erupted lava. Lava carries the large part of the heat, but a bubbling lava lake or even a lava dome can emit a lot of heat without actually having to erupt the lava.
The VRE scale is not easy to measure or use. But it is a good way to honour the non-explosive but very active volcanoes. Honour the sheep.
Albert, June 2024

This post is based on the following two (open access) papers
Robert Wright, Matthew Blackett, Charley Hill-Butler :Some observations regarding the thermal flux from Earth’s erupting volcanoes for the period of 2000 to 2014. Geophysical Research Letters, 42, 282-289 (2014). https://agupubs.onlinelibrary.wiley.com/doi/10.1002/2014GL061997
Coppola D, Cardone D, Laiolo M, Aveni S, Campus A and Massimetti F (2023), Global radiant flux from active volcanoes: the 2000–2019 MIROVA database. Front. Earth Sci. 11:1240107. https://www.frontiersin.org/articles/10.3389/feart.2023.1240107/full
William Blake
Tyger! Tyger! burning bright
In the forests of the night,
What immortal hand or eye
Could frame thy fearful symmetry?
In what distant deeps or skies
Burnt the fire of thine eyes?
On what wings dare he aspire?
What the hand, dare seize the fire?
And what shoulder, & what art,
Could twist the sinews of thy heart?
And when thy heart began to beat,
What dread hand? & what dread feet?
What the hammer? what the chain?
In what furnace was thy brain?
What the anvil? what dread grasp
Dare its deadly terrors clasp?
When the stars threw down their spears,
And water’d heaven with their tears,
Did he smile his work to see?
Did he who made the Lamb make thee?
Tyger! Tyger! burning bright
In the forests of the night,
What immortal hand or eye
Dare frame thy fearful symmetry?


Splendid article, Albert.
I will repost what I commented on the last article. The eruption is on the graben of the last swrz intrusion.
Looks like there is another proper SWRZ dike now, the eruption was north of Pu’u Koa’e but now there is a line of quakes going from there to south of Mauna Iki near where the Great Crack starts. There is weirdly no deflation with this on the tiltmeters at the summit but maybe they havent updated.
Seems this is indeed a rifting event like we see at Sundhnjukur, with many dikes in the same place. Only thing is Kilauea creates its own tectonics locally so this rift can stay open until a lower elevation does likewise. Again this is probably going to be like the middle ERZ in the 1960s. Might not be much sand left in the Kau desert in 2035…
I was just gonna post about that.
Not sure but looks like the gas plume has moved a bit downrift, hopefully the new temporary camera will be made public soon.
Im also not sure if it is a coincidence or not but the approximate location of the fissures is about the same elevation as the floor of Halemaumau.
Exact location of the fissures (worth bookmarking this page): https://usgs.maps.arcgis.com/apps/mapviewer/index.html?webmap=fa26da74f1f34a70b67cb9816356134f
Wow very close to the 1974 fissures. The dike seems to be in the same place too although maybe that is not surprising.
The deflation seems to be slowing so the flow of magma might be too, technically it is over. But the drop is only around 15 microradians which is about 2 weeks of inflation at recent values. So chances are that this either keeps getting fed slowly and we get more fissures opening with low flow rate or it goes for a round 2 in a few weeks. Or some combination of both.
The lava is though different from Mauna Iki in being very gas rich based on the pictures HVO has released (not enough of them imo). So it is not magma that has been near the surface before like was the case in 1919 or most of the 1810s-20s eruptions. Doesnt inherently mean we should expect something big but an eruption isnt likely to be just an effusive shield but something with some more fireworks.
I sound like a broken record repeating this but chances are this is just the second event of many in a rift. I think the quakes on the ERZ connector are mostly reflexive from the SWRZ rifting, if you trace the Pu’u Koa’e fissure swarm through the Koa’e faults to the chain of craters it lines up pretty well with the most seismic part of the ERZ connector. Which might make things interesting if we get magma from both connectors involved.
Very exiting really, two parts of Kilauea that have been basically inactive for centuries now being the focus of everything. I expect Halemaumau will keep filling up too but maybe only in equilibrium with magma pressure in the SWRZ now and not as refilling.
Will be interesting if the rest of the SWRZ erupts soon too, like at Kamakaia, or if the pressure will open the ERZ instead. Most likely Kilauea will sleep for a while filling in the deep rift before erupting vigorously somewhere east of Pu’u O’o making another shield. But thats probably a few years away at least now we know the January intrusion wasnt a solo act.
It erupted at higher elevation than the bottom of Halema’uma’u; I did not expect that; I guess eruptions can now happen nearly anywhere in the volcano. While another summit eruption might very well happen this year, it’s also possible that we will see an eruption or eruptions in the rift zones.
Can a https://en.wikipedia.org/wiki/Capillary_action Capillary effect facilitate the rise of magma above the natural gravity limit? Maybe the dike was narrow enough to support this force.
Last 2 hours… seems the dike is still going.
HVO has finally released photos of the after 12 hours terminated eruption: https://www.usgs.gov/volcanoes/kilauea/multimedia/images
Funny, that lava has the shape of a three-legged animal. 😀
Thank you, Albert!
I rather like the VRE idea; measuring energy output just seems to make sense. I don’t mind the VEI, because it’s good at measuring explosivity, but I like the VRE too. Perhaps using both would be good?
As for the Kilauea eruption, all I can say is I’m delighted to see it’s on the SWRZ, not the ERZ, and thus hopefully isn’t a threat to people or homes.
Me too, especially as I think the next ERZ eruption has a good chance of being another LERZ eruption.
Thanks for this interesting article, keep them coming!
According to the HVO, the eruption has stopped.
After 12 hours the eruption was over. It’s still possible that it returns. HVO still observes volcanic tremor. They say “activity in this region remains dynamic and could change quickly”. We’re still in the “fog of war”, but if the eruption doesn’t resume, it will have been a short one.
If it stops now then Kilauea will recover in a few weeks, the deflation with this intrusion was quite miniscule compared to the drop in February and even that only put things off a few months.
That does make me think it will erupt again in the next days, the dike is being fed slowly and is still going. Would not be surprising to me if we see some spatter cones appear south of Mauna Iki before this weekend. The dike seems to start directly at the point the SWRZ connector and summit complex merge so there should be a strong connection between the active rift and the magma source.
Yes, Kilauea will recover in just half a month or at most two months. Deflation was very small this time, just 14-15 microradians, while the February non-eruptive dike produced a deflation of nearly 65 microradians. The February dike was over four times more voluminous than this last event.
I’ve missed a well map about the fissure/cone and lava flows. Usually they’re quick with this, but this time they appear a bit slow to cover the event.
Interesting the earthquakes all the way from Mauna Iki to Mauna Ulu. I have a feeling that this whole “upper” area might get interesting times. Compared to Pu’u O’o Mauna Ulu sits relatively high on Kilauea, I’d view it as the link between middle and upper ERZ. The 1970s show that there can be periods when there appears a big variety of eruptions all the way from upper SWRZ over the Summit to upper ERZ and Mauna Ulu.
Yes when Mauna Ulu was active there were also dikes and eruptions from fissure swarms further west of it as well as from Halemaumau and Keanakako’i, 1971 SWRZ eruption started from Halemaumau. I would include the December 1974 eruption and rifting as part of the Mauna Ulu sequence even if it was after Mauna Ulu itself stopped.
The key thing was that it was all very high up mostly around 1 km elevation. Mauna Ulu started at about 900 meters and ended up over 100 meters tall and above the elevation of a lot of the caldera floor even. Mauna Ulu was the preferred vent because it was open but pressure didnt necessarily favor lava erupting there only.
Then in 1975 it all broke as the south flank slid with the big earthquake. Magma pressure dropped as it all rushed into the middle ERZ. It took nearly 8 years to be able to erupt again properly but then Pu’u O’o started. Pu’u O’o also spawned flank vents and had nearby fissure swarms see intrusions but nearly all of the successful eruptions were down in the middle ERZ. Even when the 2008 vent opened it was a collapse not a dike intrusion. It wasnt until 2015 that lava was able to sustain a level above 1000 meters again, 50 years after 1975.
Pu’u O’o died the same way it was ultimately created, by a big quake opening the ERZ low down, only this time there was enough magma to run away with it. The 2018 eruption started before the earthquake but I dont think it would have been as big as it was if the quake didnt happen. Pu’u O’o could well have even reactivated eventually.
Seems now we are in the same situation as the early 70s with the rift connectors flaring and the ERZ itself quiet. That might last another few months or it might last for a few decades.
Its also entirely possible that LERZ eruptions only happen if a summit vent can fill over 1000 meters elevation. 1955 happened a few years after a long eruption that high up in Halemaumau in 1952. 1960 happened after Kilauea Iki in 1959 at around 1050 meters elevation. Eruptions after 1960 started at the summit but immediately went to the ERZ again within 2 years and only one more happened in Halemaumau that decade, a long eruption ending less than a year before Mauna Ulu.
1969-1974 was a period of “Summit and Upper Rift Zone eruptions”. Three summit eruptions, Mauna Ulu, two upper SWRZ eruptions, three upper ERZ eruptions. It’s possible that we get a similar period, but with weaker magmatic pressure, so on a smaller level.
Not sure about weaker pressure, I think it is probably high now and the supply rate is about twice as high as in 1969. Kilauea looks crippled but this could be the strongest it has been in centuries, the same magma supply as all of Iceland combined going to the same place… So far that has been offset by filling the 2018 collapse but the strong rift seismicity since last October and now an actual eruption probably means that is not the case now. We are about to see why Kilauea has its name, which basically means ‘eruption’ in Hawaiian.
Thanks for very interesting post! Puting things in perspective.
I wonder about Grimsvotn 2011 eruption. Not in the list in the Wright et al figures. That was a very poweful eruption ass I understand it. Instantly blowing away a thick icecap and boiling away a huge water volume!
It loomed more like it blasted through the lake without actually boiling it too much when I looked back at it.
Clouds also do block a lot of infrared. I remember seeing something that the radiant heat of Kilauea actually dropped off to basically nothing in 2018 because of the immense stormcloud above it. Although the data in the article is contrary to that.
Im curious what Kilauea looked like in 2016-2018 on that heat graph. The lava lake at the summit then was even bigger and probably hotter than that of Nyiragongo and there were also abundant surface flows at the same time. Wouldnt surprise me if the average radiance was over 1 GW continuous for most of those few years. Lava lakes are immensely powerful IR sources it seems, they are the deep source exposed at the surface and unable to cool down like a lava flow. Kilaueas lava lake was apparently over 1200 C all the time, which is very close to the total melting point of basalt.
I had wondered too. The volcano is not mentioned in either paper, but Grimsvotn is in the Mirova database. The eruption was brief, so it may have been missed by the 6-hour cadence. The ice may have cooled the eruption cloud. So may the lake. The heat signature requires temperatures of 600C or higher. The eruption cloud itself will not be in this database as it is very much colder. It shows that the measurements are not perfect, and an eruption in water or ice may be underestimated.
I would say the VEI scale is not too bad since it is based on volumetric data. So a big basaltic eruption can be directly compared volumetrically with a Plinian. About the only issue with that is that VEI is a misnaming, since basaltic eruptions don’t do the E thing, and the rate of eruption is obviously slower for the former rather than the latter.
On the other hand if you compare the impact of say Laki in 1783 (VEI 4) with Grímsvötn in 2011 (also VEI 4) it says how undervalued basaltic eruptions are, since Laki cause the deaths of 20% of the Icelandic population and Grímsvötn did very little except disrupt air travel a bit.
They do a different E thing 🙂
Some effusive eruptions are also directly comparable to high VEI eruptions in intensity. Like Mauna Loas 0.2+ km3 of lava in 12 hours in 1950 🙂 higher bulk eruption rate than Grimsvotn 2011.
Maybe they should try a MEI: Mass Explosivity Index. The volume of 1 cubic meter liquid lava has more mass than 1 cubic meter tephra. DRE tries this, but can it equalize tephra to lava?
A Mass Explosivity Index would weigh the erupted material. 1 km³ liquic water would be 1 gigatonne. If this is turned into steam (f.e. by a phreatomagmatic eruption), the volume would under ordinary conditions rise by a factor of 1673. Then you would have a theoretical steam plume of 1673 km³. This would be a VEI8 white steam eruption.
Did the nothernmost vent at Svartsengi Iceland die out, or did it get flooded? The last wisp of lava spatter was at 2:33 am in the morning on this camera https://www.youtube.com/live/AlT9bF4fxn0 I noticed that the Live-from-Iceland camera only shows one vent now (4 am)
The non-April cones near Svartsengi just shut down: the southern around 02:24 and the northern a few minutes later.
This is surprising, as for the last while the southern of those two vents was easily the most active one.
The April cone remains active. It seems to be feeding both the April-May perched pond/south lava channel and the torrent of lava heading west near the vents that just shut down. I don’t know how this is possible — I’d figured the northern vents (or the southern one of those two) were feeding that latter river. But it’s still moving at a good clip with only the April vent having been active during the past hour and a half or so …
https://livefromiceland.is/webcams/langihryggur/ Still shows 2 active vents as of 6:28 am Iceland time Tues
Yes, I believe this is going to be the temporary “central volcano” for the 30(?) years of Svartsengi Fires. So it will receive the majority of eruptions like the big central volcanoes of EVZ. The ordinary eruptions of Bardarbunga, Grimsvötn, Askja happen on the central volcano. Only exeptional eruptions on the fissure swarm.
Maybe during the 30 years the Svartsengi Fires do in short time, what the big volcanoes do in millenia. With the whole variety of possible eruptions, but also the concentration of a main location and eruption type.
In what was already a very volcanically-active week, now there’s another one:
https://www.theguardian.com/world/article/2024/jun/04/philippines-kanlaon-volcano-erupts-sending-5km-ash-cloud-into-sky
Thanks Albert this data is also used on Ionian volcanoes where a single volcano is equal to 100 s if not 1000 s of Earth volcanoes in thermal emission flux
Not this data but similar monitoring ways in space probes
As told Google Earth is good stuff as one can explore any volcano you want instantly and learn features and landforms on them. I have noticed that they are huge general diffrences between alkaline and thoelitic fluid fissure vents and cones in morphology. Alkaline volcanism almost always produce cinder cones, while thoelitic vents produce spatter cones, even huge thoelitic vents haves a spatter like quality unless the fountains gets really tall. This is clearly visible in Hawaii where the thoelitic main shield volcanoes generaly does not form alot of cinder cones, unless the fountains gets very tall and focused like at Puu Oo and Iki, while the alkaline postshield stuff produce cinder cones at nearly every fissure.. obivious its the diffrence in gas content between alkaline and subalkaline mafic magmas. Hawaiian shield lavas are very gas rich as well and specialy so for sulfur.. but alkaline magmas haves higher co2 and higher water content and haves a high sulfur content too. Magmatic water is defentivly a real rocket gun in magmas. Alkaline fissure cones tends to be of cinder / scoria type and these are incredibley common on alkaline areas and Islands where they can dot entire landscapes, I been quite a few times in Hawaii, Azores, Canaries and the two alkaline of these produce the most cinder / scoria cones despite having a viscosity that can be very low at some vents
La Palma was a spectacular example so gas rich it have gas vents near the top of the cone at near supersonic speed a real blowtorch, while very fluid lavas issued at same time from vents in its base. Even the very fluid lavas in Congo produce paricutin like cones due to high gas content making taller fountains and therefore more and cooler fragmentation than at Iceland and Hawaii, La Palma 2021, Fogo 2014 basanites looked similar fluid the near vent flows but had lava fountains that looked strombolian/ almost subplinian in look.. high gas content. Strongly alkaline open lava lakes are also more churned up than subalkaline ones, many mildly alkaline subduction lavas also have alot of gas due to recycled slab volatiles ( Marums lava lakes ). And indeed monogenetic cinder cones are very common too among subduction magmas partly due to the volatiles but many almost all subduction magmas are also more viscous than oceanic basalt. Cinder and scoria cones are also the norm in low sillica alkaline continetal fields and those tends to be very gas rich too.
Truely high alkaline eruptions are also rather very rare ( well Nyiragongo and Nyiramuragira are more or less non stop erupting ) but these are open conduits and constantly degassing so not typical of what it may look like. Nyiramuragira before 2015 when it was more closed as a system had many fissure eruptions and they looking at photos does not look like thoelitic fissure vents at all despite being just as fluid.. the lava fountains are taller and more fragmentation and more cinder cones. La Palma pretty much confirmed that behaviour and morphology, among alkaline vents and even more alkaline like Melilitites and Kimberlites stuff just blows up into maars
Its very hard for me to learn stuff with previous past lead poisoning from making lead oxides at home, but Im working on a New VC post
Its suprising how relativly sharp my brain is today despite my lead oxide furnace experiments, Im lucky that I have not most of my previous mental abilities althrough I dont think my Iq is very good anyway at all despite being neurodivergent and therefore not supportable for normal tests. Liquid lead is magical,so hellish in apparence when heated to 800 c, it becomes completely red and bubbles spew sickly flames discharging yellow oxide smoke, Im luckly this was outside, althrough I stupidly did smaller experiments inside in our tool huts that was only very poorly ventilated, how much Lead(II) oxide I have breathed in… I dont know, and most of that exposure is in my bones today. Lead is really insanely toxic almost like cyanide as a metal, althrough exists in the enviroments so there is a natural tollerance to very very very small ammounts, sadely past human activities and use of lead in gasoline and paints and other tools have increased background natural lead contarmination to unacceptable levels and still used in jetfuel today
Elemental Lead metal is pretty harmless, as are most toxic metals, but Pb2+ is easily formed in acidic environment in air. Your body thinks Pb2+ is Ca2+ and tries to put it in your bones which is why it bioaccumulates. Mercury is similar though it seems to form organometallic compounds more easily.
Cyanide is weirdly not actually that bad it has a high acute toxicity but still low enough you could safely taste NaCN though bad idea. You need probably at least 2 grams to be a serious risk eating NaCN if you are an average fit adult. And it isnt chronically toxic at all, a non lethal dose of CN- is mostly harmless, which is kind of disturbing in a way. The same for CO and H2S, similar mechanism of poisoning, both are important biological molecules.
Maybe a good comparison the lethal dose of caffiene for a 100 kg person has been as low as 1 gram and the LD50 is 2 grams. You could replace the caffiene in your coffee with an equivalent weight of cyanide and the risk of death gets lower… lol 🙂
NO.
LD L0 (lethal dose) of NaCN is 2.8mg/kg for humans.
https://de.wikipedia.org/wiki/Natriumcyanid
(Data is not given on english Wiki-Site, so I added the german one)
This means if you are a 100kg sturdy male human 0.28g of NaCN will kill you.
Please don’t post dangerous rubbish.
LD L0 of Caffeine (for male humans) is 51mg/kg, so 5.1g will kill the 100kg man.
Bit different?
In the world of poisons 0.3 grams is still a lot, more than enough you could taste it and be safe without going close to that. I realised the decimal errors after posting so yes you are correct but the comment chain had moved on and a new eruption started so I forgot about it. No attempt at misinformation and really if someone is looking for the LD50 of NaCN and finds it here first and trusts a random forum over literally anything else they deserve their Darwin award…
Wow… that was a funny read.
I am teaching a toxicology course in the lab at university and I can assure you that 2 grams of cyanide are enough to kill a whole group of students. LOL
Regarding the caffeine… the typical rule of thumb for a letal caffeine intake is 10g (=10.000 mg). But it can be much higher if a person frequently drinks caffeine or has a high body weight with a considerable distribution volume. I usually teach my students that more than 100 cups of coffee are required before caffeine gets dangerous… and in this case much of the caffeine swallowed with the first cups will already be metabolized and eliminated.
If 1g of caffeine would be lethal, I’d already be dead. 😉 I have a weight of 80g and I never drink anything else than strong coffee during the day. I hate mineral water or lemonade, so I come up with 1 litre of coffee every day, A cup of my coffee contains 150 mg (I checked it with HPLC) so go figure what my daily caffeine intake is. 😉
“I have a weight of 80g and I never drink anything else than strong coffee during the day.” Is there a relation between the caffeine and the most severe case of underweight I have heard about? I hope not ..
I am happy to refer you to our volcano coffee post: https://www.volcanocafe.org/volcano-coffee-2/
I did look it up, NaCN has a density of 1.7g/cm3. NaCl is 2.16, NaHCO3 is 2.2. So visually the LD50 amount of NaCN would be about the same as half a gram of salt..
Its the toxic lead fumes are the big problem they spike blood lead so much more than just handling or swallowing solid lead thats much less toxic ( you can drink in lead pipes as long there is a very high water flow so no standing stagnant toxic water is in the pipe ) the fumes are killers for high blood lead results, when you breathe in lead oxides fumes its absorbed instantly in the blood due to the small size of the particles, in the fumes its basicaly lead and oxygen that dissolves easly in humid loungs where it passes quickly into the blood stream. These experiments with burning lead is something I wont do again for soure… only a minute ammounts of lead is needed to distrubt brain functions to some degrees and changes to brain functions are unchangable.. anyway lead is everywhere so impossible to avoid now
Yes, alkaline shields and volcanic fields have large cinder cones everywhere, makes a very different landscape compared to the more tholeiitic volcanoes. I also love seeing the different volcanic landscapes and which factors in the underlying magmatic system shaped them.
I do wonder if maybe tholeiite shields are able to degas CO2 deeper down. Kilauea apparently is a very prolific CO2 emitter but not directly from the vents rather as general emission from the summit area. A lot of alkaline volcanoes for whatever reason have deep magma systems too while tholeiitic basalt volcanoes are often calderas or similar. More alkaline mafic calderas like Katla are also strong CO2 emitters, Katla emits nearly 3x the CO2 of Kilauea despite erupting basically nothing by ɓ
Alkaine mafic rocks are also so very dark! I remeber some basanites and alkali basalts from Azores and Canaries ( canaries basanite ) ( azores alkali basalts ) so very dark due to their iron rich mafic minerals, basanite seems specialy black for soure. Nephelinite is dark too and specialy the crystal poor fresh melt at Nyiragongo, Nephelinitc Aa flow massive interiors tends to be ligther than basanites due to richness of tiny grey nepheline phenocrysts in some Nephelinitc rocks
Now the webcams are in night mode it looks like the eruption might have resumed, or at least there is lava close enough to the surface to pick up on the IR. Might just be a bit of wishful thinking but it looks like this is just pause and not pau.
There is still tremor on all the southwest seismometers too. Its not as strong as it was when obviously erupting but its well above background, so theres still magma flowing in. Wouldnt be surprised to see it restart at any time if it hasnt already.
Things are not quiet at all. We still have quakes and a tremor.
Looks like more than just a glow for the last few horus in the new S1 cam that HVO have just put up, too: https://www.usgs.gov/volcanoes/kilauea/s1cam-view-upper-southwest-rift-zone-kilauea-view-southwest
Oops, make that ‘hours’ … :/
Yes, there is light again. Has the eruption resumed or are there human lights?
View from Mauna Loa Strip Road
Sundhnukagigar cone MKII is waning already by the looks of it.
I think this has a done a big drain and will take some time (6-8 weeks?) before it is at an eruptable level again.
GPS showing no recovery yet but a definite slowing down of the drop.
Thanks for this “infrared” related essay, Albert!
How well can the satellite distinguish between lava and heat flow through solid rock/ground? Sometimes volcanoes release a lot of heat without an eruption of ash or lava. How hot can volcanoes be in the non-eruptive periods?
Rock is an excellent insulator. Heat flows through it very slowly. So rock directly heated by lava stays hot for quite a while. The question is how hot. If it is several hundred C, it should show up. If only mildly warm, then less so. Of course, cooler temperatures emit a lot less heat so the rock stays warm for longer. I don’t know what the limitations are. The papers quote uncertainties of 30%.
How much heat do volcanoes like Popcatepetl, Etna, Stromboli, Merapi release during the eruption breaks? The craters are very open for the next eruption, so the heat flow should continue more or less during the pause.
There are many remote active strato volcanoes, where it’s impossible to see the eruption type, if we only have the satellite data.
Popocatepetl is apparently responsible for 0.3% of annual Mexico CO2 emissions. Which in 2022 was about 490 million tons, so about 15 million of those tons were from Popocatepetl. Thats 40,000 tons a day.
This isnt necessarily a proxy for magma supply rate as arc volcanoes have way more CO2 as a general trend, and really if it was being supplied 1 km3 of magma a year it would be doing way more than it actually is. The same probably applies at nearly every high CO2 volcano. Only at Kilauea have I seen anything about an increase in CO2 being followed by an actual shallow level effect in an already erupting volcano. Kilauea erupts 1/4 the CO2 as Popocatepetl.
But it does show an open conduit exists to a great depth under Popocatepetl and is open enough to degas CO2 out of magma that isnt even near the surface. so heat flow is probably high too. Given that Popo is a particularly huge example of a stratovolcano though its probably no surprise it sits on a robust source. The magma also isnt super viscous considering it is dacitic so there must be some intense heat involved.
Thank you for another very interesting article, Albert!
There is still eruptive activity in the remaining cone in Iceland. So it’s not quite over yet.
Intense works in Grindavik’s walls. I love these people.
Although the erupting cone (now only one) looks weak, the lava field with several ponds still looks vital. Maybe there happens quiet effusion outside the cone:
While we’re on the subject of measurements and since my question from yesterday were lost due to the eruption of Kilauea I ask again:
Is it possible that all high amount of SO2 over Scandinavia is from Iceland or it is from other eruption? I look at Windy.
If the wind is in the right direction, then there could be an impact. If so it should not last long
What’s with the quake swarm east of Askja? Any news on that?
Whats the gas in the left foreground?
It must come from the dike, I guess.
walking with dinosaurs is for a 2025 remaster! hopes they capture the magic and atmosphere of the 1999 s infamousisity
Smallest SWRZ eruption since 1868 (so far): ?itok=6oTgEed9
This eruption was an accident. The intrusion had gone elsewhere, but the earthquakes destablized the shallow that had been left behind here form a previous intrusion. Kilauea is not yet ready for a large eruption here.
Not sure I agree with that Albert. The intrusion went exactly where the eruption was it just pushed up the January magma. Same thing might have happened in the same month near Grindavik for the vents that erupted near the houses inside the wall, probably magma from the November intrusion.
I do agree it was probably an accident the lava actually surfaced but the same sort of thing happened many times in the 1960s along the middle ERZ, intrusions with tiny eruptions followed by more substantial fissure eruptions, and then large fissure eruptions creating a central vent that became Mauna Ulu.
We are at the start of this, and should expect more, maybe the fact the rift has already leaked to the surface means sooner than later, maybe very soon, come back in 2 weeks 🙂
The final central vent stage is not a given but the only way this rifting ends without a lot more lava is if another part of the volcano at a lower elevation takes the magma away. That happened in 1975, with the big quake, the ERZ reopened and there was a massive drain into the deep rift killing all the pressure. Likewise the last SWRZ rift in 1982 was a large rift in the same place as this eruption that got its magma source taken by the ERZ. The culmonation of both of these was a huge volume of magma and the center of pressure shifted to the ERZ, and we all know what happened there in 1983… 🙂
Only thing is that now Halemaumau is still too low to give the pressure to push magma into the ERZ, at least to get it to the middle ERZ starting at Mauna Ulu where it can actually erupt. That area is all the same elevation as the current eruption so no preference. Pu’u O’o also built up a lot of the middle ERZ to the 800 meter elevation too. Only places the ERZ can erupt now is at the bottom of Makaopuhi and near Napau, or east of Pu’u O’o. The SWRZ is shorter and steeper so less resistance right now.
I do wonder if maybe the fact Halemaumau is filled with liquid lava js stopping its filling now. Cant intrude a liquid, and while the lake lava has probably nkt really cooled much at all it is degassed and dense, so any fissure that goes into the lake will start draining as soon as the pressure in the vent drops. 1959 formed an open conduit above its lake before the lava could drown it, so it could become a lava geyser, but no such luck for the recent eruptions. I expect the lava is also dense and heavy enough to push the ring faults closed, and the only part of the caldera outside the lake is basically at 1 km elevation nkw anyway so the magma has other options. I expect now, and unlike my past comments, that it could well take decades before the floor of Halemaumau reaches 1000 meters elevation, even though it only has 50 meters and a few years magma supply to go in theory.
The Kilauea National Park has published a website about the recent eruption: https://www.nps.gov/havo/learn/nature/2024-southwest-rift-zone-eruption.htm
… including this cross section diagramme:
HVO photos and videos: https://www.usgs.gov/observatories/hvo/news/photo-and-video-chronology-fissure-eruption-kilauea-volcanos-southwest-rift
Tilt at UWE going down again… (maybe temporary or something else).
Could just be the start of a DI event as normal. One had just ended not long before the quakes started. The DI events are big too, each microradian on the UWEV tiltmeter seems to be equivalent to about 1 million m3. So while Kilauea has a formal supply rate of around 350-500,000 m3 of magma per day its actually sometimes negative 10x that much… and sometimes positive 10x too. The whole deflation of this eruption is only about 3 DIs, will be back for round 2 in a few weeks at most if the connection to the dike is cut again. Which it seems might not be the case yet…
It seems though that it is generally positive now though, so that long term supply might not be adequate at present, the supply since the start of 2023 might well be over 0.2 km3/year, possibly even 0.3 km3/year, will be fun to see how long it can keep that up. Maybe Mauna Loa was taking a lot from 2014-2023, now Kilauea is getting it all +post 2018 decompression and whatever is going on at Pahala… 🙂
DI = dike intrusion ?
Deflation-inflation cycle. Kilauea has been doing those for years although not always equally frequent. Possibly related to overturning in the magma conduit
It’s a very uncertain phase now. Impossible to predict what’s going to happen next. The eruption on 31/12/1974 was only a single day as the recent one on 3/6/2024. Here is the paper about 1974: https://pubs.usgs.gov/pp/1613/report.pdf
The eruption lasted for six hours, while the 2024 eruption lasted for twelve hours. The lava area of 1974 was 7 square kilometers, the volume was 0.01 cubic kilometers. According to the recently published map about the 2024 eruption, the area is much smaller 2024. My estimation of the current new lava area is around 0.25 square kilometers.
The tiny size and low eruption rate (well compared to 1975, still probably >100 m3/s at times) are why I think this isnt finished.
This new intrusion differs from any other historical seismic SWRZ intrusions not because it erupted but because it was a repeat event. The Pu’u Koa’e fissure swarm has rifted a few times historically, in 1963, 1974 and 1982, and it probably also rifted in 1868 and possibly also in the 1810s or 1820s, but ill ignore those now. All of these other times were single one off events, and only 1974 erupted, and at high intensity very fast. Then the fissure swarm rifted again in January, marking the 4th time. But now only a few months go by and the same dike is active again and erupts. The only other times this has happened the rifting has been long lived and voluminous. I dont think the historical rifts in this area are a good comparison as they might first appear.
This has a lot of the characteristics of Taal’s latest eruption–a slightly exposed laccolith or sill, just degassing with no impetus to generate a significant eruption. September 1961 has been brought up, Hi’iaka 1968, a literal bucketful of lava was erupted in 1980, and another small one in March 2009 near Kane Nui O Hamo.
I think the dike in January was equivalent to the one in September 1961, that dike started off a rifting episode that erupted 4 more times along exactly the same fissure, and at the same time a year later rifting began west of Makaopuhi too which evolved into Mauna Ulu. The east Napau fissures appeared to die but Pu’u O’o formed offset only a hundred meters and in the same place so im not so sure…
This is going to be the same I expect. Going to be many more intrusions and eruptions along this rift. Maybe even a Mauna Ulu 2. Possibly after a while the SWRZ connector will extend and eruptions will begin lower down or maybe the ERZ will be pushed open instead but that is probably a few more years off.
Here is the GPS for caldera extension at Kilauea, reflacting inflation. The rate it has gone up this year is extraordinary, just about 40 cm in 4 months, a rate of over 1 meter a year. But just in the last month is 20 cm, crazy.
I dont xepect the eruption to show on this, the tilt signal was tiny and this graph tends to be pretty close to that even though it measures a different thing. Round 2 is definitely in the works
Thank you for the new article.
As a very un-scientific person, this is the kind of science communication I like:
https://www.nature.com/articles/s41561-024-01442-0
It continues the “soda-pop” theme, haha. Paywalled but I found extrapolation elsewhere.
Meant to ask: what planet is this?? 😮
Io …. : ) not a far away analouge
It’s earth,but million years in the future!
That’s quite possible.
Frightening that you predict this (one or several?) million in the future.
Earth in the past would fit too but you’d have to go back ~4 billion years! 🙂
Interesting. Just above the cone’s lava outflow there’s a glowing spot above it on the cone and it’s been there for at least 5+ hours. I assume the lava flowing underneath is heating the rock enough so it keeps glowing on the outer side.
Possible weak spot and prone to fail. If it does, it could get interesting again for a couple minutes at least.
First known human death from H5N2 in Mexico, the source of the infection is a mystery.
https://www.scmp.com/news/world/americas/article/3265542/who-confirms-first-fatal-human-case-bird-flu-ah5n2-subtype
An extremely lame virus.
Newest picture of the lava by HVO. Even if it is stored magma from 4 months ago thats barely anything, the lava flows are very frothy and still barely a meter tall. They do directly compare to the 1974 lava close by in tbe caption for this picture.
Im not so surprised it stopped erupting now. Im sure everyone saw the videos of it erupting that showed the massive crack west and downhill. HVO says that ultimately went as far as to near Mauna Iki. Lots of cracks for the magma to flow into down that way. Seems it started as a short fast ‘normal’ dike that was pretty minor and maybe should have failed, but near the surface it got into shallow cracks and just started flowing along them in a way like it did in 1919 or 1971, erupting a bit and flowing into the rift cracks or the past 4 days. But it seems it could be over just now. Will be interesting to see in a week or two if the magmaflow resumes here or things get noisy again. Seems the former would be more likely but then its so hard to predict now 🙂
Wow spoke too soon, RIMD showing magma movement signals already though SDH isnt. There are new flurries of quakes between Keanakako’i and the Kau desert too, probably going to get a round 2 in the next few days, see if it erupts this time too.
HVO daily update gives an eruption volume of 100,000 m³ in 8.5 hours, and average eruption rate of 3.2 m³/s.
Super lame eruption
bahahahah lol I died here 😀 😀
Yes, I guess it would not register on the TVI (Tallis Volcanic Intensity) scale
A more accidental eruption than a real one. It was predominantly an intrusion with a fart eruption.
Much less than it looked in the video, most of that 8 hours must have been just glowing fissures not actual eruption.
Seems this eruption was basically a dike that happened to slightly graze the surface, probably just about filling the rift created in January. The next intrusion here will probably be a lot more impressive at the surface, if it is something like the one in January it could be over 100x stronger…
Really am wondering if this eruption was even more than an accident, the deflation was so small its barely even above background. Calm before the storm I wonder…
Extrapolating the present inflation rate, the summit will have fully re-inflated in 3-4 days. There must be a substantial supply spike going on since the UWE tiltmeter is going up at 3 microradians per day. So if this pulse goes on, we will see action really soon. I’m more inclined for an Upper East Rift Zone or Halema’uma’u eruption/dike next, since it’s very rare for Kilauea to rift the same fissure swarm twice without alternating with some other location. In fact, in might be the first time this happens for a relevant intrusion outside Halema’uma’u.
As soon as I speak, inflation halts. XD.
UWEV has stopped going up but SDH hasnt, up more than 20 microradians in a few days. So I think Kilauea might be breaking its rules again soon.
I feel like the intrusion and eruption we got was kind of accidental from pressure in the south caldera reopening some of the January intrusion and using that to erupt, not actually breaking open its own dike.. The pressure is high still, we might get another dike like the January event but possibly erupting very significantly. Something like 1974 but maybe 2-3x bigger, 30 million m3 of lava in a day. Would be very similar to the start of the last Svartsengi eruption, and actually could reach the ocean with that kind of speed and volume. Of course now I said that it will be completely different… 🙂
The eruption lasted longer than 1974, but was smaller in volume and rate. HVO today assumes that the eruption “is unlikely to restart” after more than 48 hours now.
1975 it lasted 11 months for Kilauea to do the next eruption on November 29th, connected to a major earthquake. But Kilauea looks different now than 1974. 1974 it was more or less an “after Mauna Ulu development”, while today we’re likely in the early stage of a new eruption period.
2023 Kilauea already tried to “escape” the Summit caldera with vents on the cliff. 2024 this mission was successfull. Maybe the series 2020-2023 will in the end be a prelude to the main new period. Occasionally summit eruptions preceded rift zone eruptions like f.e. 1954 and 1955. This was once viewed as the “classical” behaviour. This time it looks inlikely that Kilauea does lower Rift Zone eruptions, but rather upper Rift Zone eruptions. The June 3rd eruption can be the first of those.
Theres actually quite a lot of less obvious differences between now and the 60s-70s. The main one is the supply rate is way higher, it was about 0.1 km3/year for Mauna Ulu, but 0.15 km3 for Pu’u O’o 50% higher. Now it is probably even higher still.
The other is that since about 2010 or so the magma system at Kilaueas summit went from an intrusion complex to an actual singular magma chamber. Thats why there was such variability of magma composition in the 20th century, now it is all basically the same except for the fissure 8 stuff that dredged up the deep rift and had a lot of olivine in it. Surprisingly the new lava has also got a lot of olivine in it but so far thats all HVO have said.
Steve asked a couple of days ago about the swarm around Herðubreið/Askja but i suspect everyone is distracted by actual action proper at Kilauea and Sundhnúkur.
Anyone know if the swarm is tectonic or magmatic?
Seemed to start with a couple of very deep quakes – ca 25Km.
I dont know if ut has ever been formally addressed but I think it is caused by inflation at Askja, same way that the recent activity at Fagradalsfjall and Sundhnjukur has caused earthquakes at other places on Reykjanes.
It probably started mostly after Holuhraun, the extension probably going far north of the eruption but there was no magma there to feed a dike so it stayed as elastic deformation. I remember that there was also something nearby in the 2000s, was a topic of discussion on here once, but it seems unlikey to be continuous or related to the present activity.
What does seem unlikely is it being a reactivation of Herdubreid, theres no magma signals and 25 km is still in the lithosphere there, central Iceland has continental-thick crust just of basalt composition. Im not even sure if Herdubreid is even its own volcano or just an eccentric monogenetic satellite of Askja, theres a lot of other tuyas nearby and also lava shields.
Many thanks Chad
Very thick crusted indeed… near Vatnajökull its 50 kilometers thick in one area.. thats halfway to space ( to karman line ) in thickness with plutonic gabbro
Some scientists believe that Iceland is actually part of a continent and the deep crust is one reason that they say so.
The Catalogue of Icelandic Volcanoes desribes Askja’s Fissure swarm (including Herdubreid): “Seismic swarms preceded 1875 CE eruption. No information on previous eruptions. At present, low-level microseismicity in the Herðubreið and Upptyppingar area”. Herðubreið is surrounded by Askja’s prehistorical lava. It is part of the southern fissure swarm, where eruptions occur more frequently than in the distant north (close to Krafla). 15 to 20 fissure eruptions are known, but it’s uncertain how Askja would run towards one. Most eruptions stay in the central volcano.
There are likely two distinct causes for earth quakes in that region.
Those under/near to Askja are caused by the inflation under Askja as Chad pointed out.
The region between Askja and Herdubreid (-lindar, -tögl) has some parallel NNE – SSW cracks from near surface to more than 8 kms deep. As long as I follow Iceland related to volcanology, pre Barda, there are minor to larger quake swarms in that area, also in the period before the renewed inflation in Askja area started. Some interesting articles about the activity down there, can be found in the VC archives. The vid from Andrej Flis on youtube showing the quake pattern in 3D is very nice.
https://youtu.be/gvOSH70iCIY?feature=shared
Starship launching soon
Its back again.. succesfully!
Starship flight 4 successful landing of both the booster and the orbiter.
Literal most powerful machine we have ever created.
First rocket where all of it landed 99% intact on the ground.
First ever complete livestream of a re-entry from low earth orbit.
Skin of one of the fins was eaten at max Q but the structure survived otherwise pretty undamaged. Thing is a lot more robust than it looks.
Everything is just a whole different level of insane in rocket science. Its easy to forget that just the actuators for the fins are 300 kW model s motors.. And each Raptor makes 7 GW and theres 32 of them. Starship could power all of Texas.
Also not to mention that the Raptor is probably the most efficient heat engine we have ever made, 63% BTE. Its kind of ironic that an Elon Musk company made the best ICE 🙂
https://www.youtube.com/watch?v=dUwgwPoT35k
Isak’s livestream starting in approx. 45 minites. (Weather permitting.)
https://eos.org/thelandslideblog/switzerland-seismic-1
A different use of seismic data. With rising temperature, there will be more to detect.
Nice. Thanks for linking it. 🙂
Very nice and informativ. Thanks for the link!
Been winter in Northen Iceland even snow so rather cold for season! and a good example how northenly winds from greenland can ruin an early summer, well souch a cool oceanic climate rarely gets a real “european summer” but in comming week it will become warmer and more summerlike in Iceland ( whats more normal for season ) Icelands cool oceanic climate is what scares away most persons from living there, even Icelanders go to mainland often to get better summers, many icelanders living on my street because of that
Yes Jasper, there seem to be many Icelanders living in Mediterranean regions.
The cold weather in the North has blocked roads, held up supplies and affected tourist income.
New grass leys damaged; hay for stock animals will have to be purchased.
Nestling birds killed.
A meterologist on one of the news sites said it happens “every eight to fourteen years”.
Yes there are many Icelanders living in the nordic mainland too, our summers at least in sourthen parts of nordics that can get over 25 are quite warm for their summer standards. Any Icelanders are free citizens here by default, just as I am free citizen in Iceland. I wants to move to Iceland as soon as possible, but haves zero idea of career choices, here in the worlds richest countries I perhaps needs to be a professor to get a job. But i do strongly trust in special voucational education, and perhaps better to learn a work skill in Iceland and not here.
I woud myself skip mediterreaean.. gets too hot in high summers and wages are generaly below Nordic standards, but the Med certainly is very beautyful and less gloomy than the grey boreful nordics, i strongly miss Sicily, still Iceland can hardly be called boring!
I been in Iceland many times and some summers in Reykjavik was a real comedy, pure horseshit weather, its windy and rainy and only 10 c but it feels it like 5, it was a misery experience doing stuff outside, still a good summer day there can get up to 20 but thats quite rare, the wind and humidity is your greatest enemy in Iceland, even more cold and wet woud be South Sandwich islands, South Goeriga and Heard island, these places coud be ideal prison places where criminals coud live out their last days in the wind and cold only getting food through yearly massive ship transports. “exiled to south georgia” that woud be something
Despite the horseturd summers I wants to live in Iceland anyway
Im willing to buy and endure “horsetard donkey weather” for living with volcanoes for rest of my life
Looks like inflation is back – but the shallow let down indicated the large volume of magma released did relieve the pressure at 5 km depth or so, for awhile.
How is Fagradalsfjall doing? We’re close to 11 months now, so we’ll witness whether Fagradalsfjall will continue the series although Svartsengi erupts at the same time.
https://browser.dataspace.copernicus.eu/?zoom=14&lat=-1.51405&lng=29.23201&themeId=DEFAULT-THEME&visualizationUrl=https%3A%2F%2Fsh.dataspace.copernicus.eu%2Fogc%2Fwms%2Fa91f72b5-f393-4320-bc0f-990129bd9e63&datasetId=S2_L2A_CDAS&fromTime=2023-12-06T00%3A00%3A00.000Z&toTime=2024-06-06T23%3A59%3A59.999Z&layerId=1_TRUE_COLOR&demSource3D=%22MAPZEN%22&cloudCoverage=30&dateMode=MOSAIC
https://browser.dataspace.copernicus.eu/?zoom=14&lat=-1.52235&lng=29.24808&themeId=DEFAULT-THEME&visualizationUrl=https%3A%2F%2Fsh.dataspace.copernicus.eu%2Fogc%2Fwms%2Fa91f72b5-f393-4320-bc0f-990129bd9e63&datasetId=S2_L2A_CDAS&fromTime=2023-12-06T00%3A00%3A00.000Z&toTime=2024-06-06T23%3A59%3A59.999Z&layerId=6-SWIR&demSource3D=%22MAPZEN%22&cloudCoverage=30&dateMode=MOSAIC
Robust vog plume from Nyiragongo and its strong in swir thermal filter too, its either strong spatter cone activity like Kilaueas post 2018 caldera fillings or perhaps we haves another new open conduit lava lake at Nyiragongo again. Nyiragongo and Nyiramulagira are one of the worlds most thermaly powerful volcanoes outside Hawaii, so magma supply is prolific here too, and its really ashoninshly productive for being so very alkaline as Virunga is, large ammounts of melting deep down, even if alkaline magmas are tought to be produced by very small ammounts of melting. for being nephelinites, basanites, tephrites, magmas that usualy only found in monogentic fields or weak sleepy ocean islands, then Virunga its impressive, and infact one of the worlds most productive volcanic regions outside Hawaii and Iceland. I think Goma is poorly placed and should be moved as part of a very long term future project, this activity is not going to stop anytime soon
Nyiramulagira is lively too likey is large overflows from spatter cones in the caldera, pahoehoe fillings are common too
Virunga is also quite young. The river in the rift valley used to run northwards here. The rise of the bulge of Virunga stopped that and now the waters run south and cause the peculiar chemistry of the rift lakes to the south. The recent explosion of cichlid evolution in those lakes is a consequence of Virunga. Great mountain. As for Goma, you can move it but it would re-establish itself in the same place within a year. It is too good a place to live.
Seems to be a very peaceful place to live in and one of the best weathers in the world, but just wait until that boulge in the future haves it major meltdown and a thoelitic flood basalt sequence buries everything in central africa! If that theory of a birthing plume is correct then Nyiramulagira is going to grow into a very scary volcano indeed in a few 10 000 s or 100 000 of years, its young and seems to have a very lively future when the whole area ”melts down” litteraly. But the next lava flood from Nyiragongo maybe only a decade away if it fills at this current pace.. woud be fun with some on ground photos from the caldera rim…
Explains the constant sulfur plume thats always seen in the windy app over Congo .. a few weeks agao there was an ENORMOUS sulfur plume over africa that covered entire congo and outside areas, I wonder of this was the opening of an open conduited lava lake in Nyiragongo, or a very powerful paroxysmal caldera lava fountain eruption in either Nyiragongo or Nyiramuragira I have not seen any pyrocumulus anivils from it from satelite imagery but those coud be hidden in the mega cumulunimbus clouds that forms everyday there.
https://www.youtube.com/watch?v=dx175ZTLNt0 Nice lava firehoses into the previous Nyiragongo lava lake, similar things seen in hawaiian shelf tubes too that gush into the ocean
Been long enough now that the GPS on Kilauea are showing the recent intrusion. This is at KOSM near Pu’u Koa’e which can be seen to move a lot. I think it was either very close or actually within the graben formed the other day, as the movement is not identical in direction to that in January.
And these are AHUP and OUTL, which are both in the south caldera area only about a mile apart but they went in opposite directions.
SDH tiltmeter is showing the south caldera source of the recent dike is filling again quickly, and the earthquake rate has gone above 100/day again too. Usually I wouldnt expect much just yet but the eruption might resume at basically any time now.
Volcano Watch talks about the eruption: https://www.usgs.gov/observatories/hvo/news/volcano-watch-keeping-kilauea
We likely get a random variation of eruptions of the three main magma chambers. Magma pressure is there, but there are multiple paths to the surface and no single conduit to get it all.
https://jardvis-hi-is.translate.goog/is/eldgos-vid-sundhnuksgiga-i-lok-mai-2024-fyrstu-berg-og-jardefnafraedigogn?_x_tr_sl=auto&_x_tr_tl=en&_x_tr_hl=en-US&_x_tr_pto=wapp
https://www-nature-com.translate.goog/articles/s41586-022-04981-x?error=cookies_not_supported&code=6c8bce9e-94e3-43ac-bb81-eac4eeee4c93&_x_tr_sl=auto&_x_tr_tl=en&_x_tr_hl=en-US&_x_tr_pto=wapp
New analysis of Iceland’s lava.
(Duplicate – ‘cos posted wrong place doh!)
Eruption at Sundhnúksgíga at the end of May 2024 – first rock and geochemical data
Samples of pyroxene and rapidly cooled lava were collected north of Fiskidalsfjall and east of Sýlingarfell on the first and fourth day of the eruption that began on May 29 at Sundhnúksgíga. Both the lava and pyroxene consist of foliated basaltic glass with plagioclase, olivine, and agite dikes (Figure 1). The basalt glass was chemically analyzed with the University’s Institute of Geosciences Microscope. The igneous glass is free of microcrystals, but rapidly cooled lava samples contain variable amounts of them. Overall, the lithological features of the new lava are similar to previous lavas that have flowed at Sundhnúksgíga since December 2023 ( see previous reports ).
Geochemical characteristics
The concentration of MgO in the glass is ~6.2-7.0 %, or similar to that from other eruptions at Sundhnúksgíga since December 2023. The ratio K 2 O/TiO 2 of the glass is 0.13-0.14 in all analyzed samples from this the most recent eruption, which is significantly different from the previous eruptions at Sundhnúksgíga, but in those eruptions it was 0.21-0.23 (fig. 2). This change in K 2 O/TiO 2 compared to previous eruptions in the area since December 2023 suggests that new and altered magma is coming to the surface at Sundhnúks crater.
Landris began in Svartsengi at the beginning of April ( see the reports of the Icelandic Meteorological Office ) during the eruption that began in March 2024. Our first geochemical data indicate that since the beginning of April, new and altered magma has accumulated under Svartsengi. This magma most likely accumulated in a separate magma reservoir in the mid-crustal, distinct from that in which the Martian eruption originated. The magma that is now emerging at Sundhnúksgíga has a K 2 O/TiO 2 ratio that is similar to that of the magma that emerged at the beginning of the eruption in Geldingaðalur in 2021. One possible explanation for this is that the two magma systems are connected deep down in the earth’s crust. For the first time since the beginning of Geldingadalagos 2021, magma with low K 2 O/TiO 2 is dominant in the eruption centers of Sundhnúks crater.”
It did look very shiny and fluid in the recent overflights. And the speed of the lava flowing padt Hagafell on the first day was extreme even for a basaltic eruption, it looked like orange paint.
I think the source is the same but now all of the magma that built up since 2020 or before has erupted and the stuff we get now and in future will be fresh and hot.
It copied all of it apparently…
I have taken the silliest part out.
The surprise is, of course, that the magma is different from that of the ‘Martian eruption’. Who would have guessed!
martian eruption??
I think its a bad translation talking about the eruption in March
March is the month of Mars. So it was indeed a Martian eruption, but not on Martian planet, but during Martian month.
https://www.youtube.com/watch?v=R5dn7xBP2mU the superfluid 2021 lava, looks alot like Halemaumau lava
Thanks for the link and translations!
Lava emerges predominantly calm now. The lava fountain continues on reduced levels.
Firmed an overflowing lava lake like in 2021. It sort of did that last eruption too but its a lot bigger now.
I think this cone might actually become a bit like Pu’u O’o, erupting more than once and growing bigger. Only difference being that it doesnt do a high fountain in the first part. But its getting very big you can see it on the Vogar webcam now.
9:16 pm Sat 8-June-2024 and the cone looks like it’s not going on much longer, maybe 3 or 4 days?
How high can be the Volcanic Radiative Power on dormant volcanoe? F.e. Vesuvius, Vulcano, Campi Flegrei at present.
IO 100 s of times the eruoting volcanoes on Earth combined… hopes Elon and Albert can build me a Io orbiter probe one day
Yes, the eruption was very fluid when I saw it in June of 2021. Almost like red water spilling down the face of the cone.
Not sure how this reply got tagged to the wrong comment. Oops!
Taal also regularly pumps out high levels of So2. In fact there’s quite a few that pump out >10kt daily when not in eruption.
I wonder if its because of hydrothermal circulation, SO2 is pretty water soluble and Taal has had a lot of phreatic eruptions in the past few years, some involving fresm magma so there is contact.
IMHO, one indicator that you’re right about that is the fact that magmatic degassing is long-dormant volcanic systems is a known and common source of naturally carbonated sparkling water (like the ones from the Eifel region of Germany).
I would imagine that higher temperature (Compared to dormant locations) hydrothermal systems (Like Taal) cause the water to degass, rather than keeping the CO2 in solution.
Looks like Svartsengi is considering resuming inflation again.
Nice of it to consider.
SKSH isn’t really showing it but HS02 is right above it and you can see the stall/slight uplift.
Seems to have decided on resumed uplift now.
Met Office observes the same: https://www.vedur.is/um-vi/frettir/jardhraeringar-grindavik
Sinking of land has stopped and inflow of magma into the system is at present likely the same as the erupted quantity of lava on the Sundhunkur crater. The red graph shows the current state of deformation:
Are they saying that the chemical composition IS different?
“The data show that the chemical composition of the magma that is now coming to the surface is not different from that which has arisen in the last four volcanic eruptions in the Sundhnúks crater series, but is similar to the magma from the beginning of the eruption in Geldingaðalur in 2021. These results are a sign that the magma collection area under Svartsengi is changing.”
During the Geldingadalir eruption, magma changed in composition from an initially more tholeiitic magma to a more alkalic one that is extremely rare in the area. I don’t know if the later Fagradalsfjall eruptions produced the alkalic type or the tholeiitic type. The Sundnukur eruptions had so far erupted a more evolved version of the late Geldingalir alkalic magma, but with this eruption, it has shifted to the regular, more tholeiitic basalt. There are some links above, in comments about this question.
There are probably important implications to this change, but I don’t know which.
Looking it up, the 2022 Fagradalsfjall eruption was more enriched/alkalic than the late Geldingadalir lavas, so this could be the end of a 2021-2024 chapter of anomalous enriched/alkalic lavas in the Reykjanes Peninsula.
Present deformation at Keilir looks as if Fagradalsfjall is going to do no eruption in 2024. The negative deformation rather indicates that magma runs from Fagradalsfjall to Svartsengi. This could mean that Fagradalsfjall stays calm, as long as Svartsengi is active:
The negative trend on Fagradalsfjall may indicate negative correlation of the systems: http://brunnur.vedur.is/gps/reykjanes.html
I just don’t think there’s space in the crust whilst Svartsengi inflates. The inflation is pushing everything else together and not allowing intrusions elsewhere.
Is Kilauea having some bursts of tremor?
https://d9-wret.s3.us-west-2.amazonaws.com/assets/palladium/production/s3fs-public/styles/full_width/public/media/images/Kilauea_may-june_eruption_annot 1.png?itok=bNgSRZap
Deformation associated with the eruption. For such a small volume of magma involved this was a pretty long dike. Theres also alot of new images of the lava fields.
Iceland already existed during the last “Coal Age” Miocene, when climate still was warm and allowed woods to grow until the Arctic ocean. During this time the last coal sediments (Lignite) were created. Iceland likely was heavily forested and without any glaciers. Can we imagine how Iceland looked like then?
Thats a lot of lava. No wonder its crossing the road.
https://www.youtube.com/live/PTHDkXkbs_A?si=fg_qyPrYhIfS0UFY
Hope he’s further from the lava than he appears to be:
Source: https://www.livefromiceland.is/webcams/thorbjorn2
They want us to believe that something is going on. Of course nothing is going on. The Sundhnukuriki cam also turned towards the berm. As if we were that naive! The workers and the guys that steer the cams obviously work together to make us believe that the situation is changing. It isn’t. Amazing how much efforts are directed towards this make-believe.
Well, the IMO office did release an official comment.
New footage of the flow over the road uploaded by Just Icelandic, really makes me question how sustainable fighting the lava is, the berms can’t be raised indefinitely. Great efforts so far but I still think it could prove to be all in vain in the end…
I like the sat pic that IMO have put up. It looks like Cthulhu’s giant black tentacles, or Mongolian horsemen or something, surrounding two walled towns. Although in this case one walled location is the Blue Lagoon and the power station and the other Grindavik. I suspect the locals are getting sick of all this.
The berms are working well so far.
Very Mordor-esque. The blue lagoon as the Sea of Nurnen. Surrounded on all sides by formidable mountains (berms).