
Hunga Tonga after the 2014 eruption. This is the rim of the cone and the crater. Both were removed from existence on 13 and 14 January 2022. The 15 Jan eruption occurred below sea level. Source: BBC youtube
Did you know that there is an international treaty on eruptions? In truth, there isn’t. But there is a treaty on nuclear explosions, and there are similarities between explosive volcanic eruptions and nuclear explosions. Banning eruptions would go a bit above the United Nations powers. Could a volcanic eruption appear as a nuclear test? There is a system of detectors set around the world to detect nuclear explosions. Could they tell the difference? If not, could a nuclear explosion hide by pretending to be volcanic? We now have the answer, thanks to Hunga Tonga.
Hunga Tonga had come to life on 20 December 2021. This is (or was) in fact a fairly active volcano. The island of Hunga Tonga had been created in 2014 when an eruption occurring between the islands of Hunga and Ha’apai had merged the two. Previous eruptions had occured near to or along the edge of an apparent caldera, building submarine cones and two rock stacks which reached above the sea. Both the original islands and the 2014 eruptions were also on this ring. When the activity resumed in 2021, it was at near to the previous eruption. There were some explosions and a new cone build, but it was fairly minor and had ended by 11 January 2023. On 13/14 January 2022, a large explosion destroyed the 2014 cone and caused an eruption cloud 20 km high with a small tsunami.
The big event came on 15 January. It destroyed Hunga Tonga, leaving only two small remnants of the previous islands, removed the two rock stacks from existence, caused a tsunami which washed over islands 50 km away and caused damage around the Pacific Ocean, caused two fatalities in distant South America, produced a 600-km wide eruption cloud that reached above the stratosphere(!) and generated the biggest lightning storm ever recorded (it even produced gamma rays!), and it caused a atmospheric pressure wave that travelled around the Earth more than three times, and was detected in Manchester 7 times over 4 days. It was the loudest volcanic explosion since Krakatau in 1883. If any volcano had violated the test ban treaty, this was it. Time to call in the nuclear detectives. But no worry, they were on the case. A recent paper by Stefanie Donner (Hannover) describes their work.

The Comprehensive Nuclear-Test-Ban Treaty
The wave of hundreds of nuclear tests done in the 1950’s were very damaging and dangerous. The worst fall-out on record came from the US Bikini test in 1954. The largest explosion came in 1961 with the USSR Tsar Bomba, a 50 megaton monster. Even milk was now contaminated with strontium. The Atomic Energy Committee (a powerful US group) in vain argued that radiation was not something to worry about. It destroyed its own credibility in the process. This became a struggle between the nuclear hawks (with the AEC on their side) and a population in both the US and the USSR which became more and more worried and demanded that something was done. The Cuba crisis, when nuclear war was briefly more likely then not, finally galvanized the leaders into action. Some form of sanity had to prevail. The world stepped back from the brink. We may never really know how close we came to disaster: left to its own, there can be a destructive tendency in humanity, an inability to see beyond the battles of today to the damage of tomorrow.
One of the sticking points in the treaty negotiations was the need to devise a way to detect nuclear explosions. A treaty has little meaning without a mechanism to test compliance. A system of monitoring posts was proposed covering land, sea, and (more controversial) the air, to distinguish nuclear explosions from earthquakes. There were arguments about how sensitive such systems could be, how such a system should be run and who should be in charge. These uncertainties were never fully resolved,
But this uncertainty did not stop the final agreement. The Partial Test-Ban Treaty of 1963 banned all nuclear tests in outer space, the atmosphere and the oceans. The Soviet Union, the US and the UK quickly signed and ratified. But China and France did not. France especially became a nuclear menace, carrying out 50 atmospheric nuclear tests in the 1970’s and at one point even attacked New Zealand to safeguard their right to irradiate the rest of the world. After this low point, sanity came even to the French. By 1980, atmospheric tests were finally ended.
The treaty did not forbid underground tests – that was the ‘Partial’ part. Completing the process took more than 30 years. The Comprehensive Nuclear-Test-Ban Treaty (CTBT) was adopted by the UN only in 1996. The CTBT bans all nuclear explosions, whether for military or peaceful purposes. It did not come easy and it is still not in force. 44 nations have to sign and ratify it before it becomes legally binding: these all the nations with some sort of nuclear capability in 1996, ranging from Algeria to Zaire in the alphabet of nations. Three rather important nations among the 44 have not even signed: Pakistan, India and North Korea. These nations now present the highest nuclear risks in the world. Some other countries have signed but not ratified, including the US, China and Iran. Russia had signed and ratified the treaty but withdrew their ratification in November 2023. The world is not in a good place and sanity is hard to gain and easy to lose. Still, anyone attempting a nuclear explosion will be found out. Russia tried but failed to hide the accidental explosion of a nuclear-power missile.
The reason for the inability to carry out secret nuclear explosions lies in a global network of monitoring stations, reporting to the International Data Centre in Vienna. The monitoring network includes seismic stations, hydroacoustic stations, infrasound stations and radionuclide stations, all working together to detect explosions across the globe and determine whether they are nuclear.
The seismic stations do what many other such instruments do across the world: they detect waves coming through the Earth. Hydroacoustic stations detect similar waves but ones coming through water. Infrasound detects the ultra-low frequency waves in the atmosphere. Radionuclides are the radioactive particles and gases that would be released by a nuclear event (such as the Russian missile test) in the atmosphere. The complete network is called the International Monitoring System or IMS. It works: the IMS has succeeded in detecting all of North Korea’s nuclear tests.
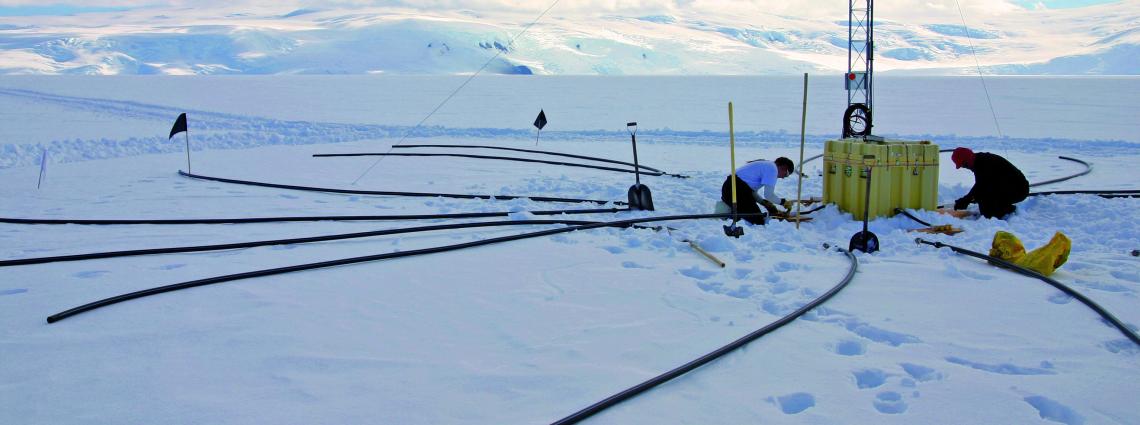
IMS 54, Palmer Station, Anvers Island, Antarctica peninsula
Palmer station and the local penguin colony
Since nuclear explosions have become very rare, almost all detected signals are from other events. These instruments are used to detect such non-nuclear events. The seismic stations can pick up events that warrant tsunami warnings. These signals are therefore reported to various countries. They were among the ones that allowed Japan to issue tsunami warnings before the arrival of the waves in 2011. The radionuclide detectors saw the ejecta from the Fukushima plant. The ultrasound detectors detected the eruption of Eyafjallajokul in 2010. The hydroacoustic detectors have seen signals from underwater events such as the deep Mayotte eruption. The demise of the Titan submarine was detected in real time by hydroacoustic detectors (it was quite a large implosion) although this was reportedly run by the US military rather than the IDC in Vienna. Two of the IMS hydroacoustic stations were well placed to detect the lost airplane MH370: one did detect a potential signal, but there was interference from a possible Antarctic ice collapse, while the second station was affected by a nearby ship.
The eruption of Hunga Tonga on 15 Jan 2022 was picked up by much of the IMS network.

The stations of the CTBT monitoring network, or IMS
The goal of these systems is to detect large energy releases and to decide whether these are from nuclear explosions. The most common energy releases are from earthquakes. These come from large rock masses held in place by friction, and suddenly begin to slide past each other when the stress exceeds the friction force. Because the friction force between moving masses is much less than that between stationary ones, the sliding rapidly accelerates. True explosions act different but they are rarer. Some of the missiles used in the Russia-Ukraine war were strong enough to be detected by seismographs. Volcanic explosions can also produce a lot of energy: imagine a missile strong enough to excavate a crater several kilometers across! But such explosions are rare.
Hunga Tonga had a major eruption in January 2022. It was immediately clear that this was a large one, but the full size only became apparent in the weeks and months that followed. The islands of Tonga received a generous helping of ash. More devastating was the tsunami which overwhelmed some of the islands and caused damage and casualties across the Pacific ocean. It could have been much worse but the waves were mainly directed away from the nearest and populated islands. At Hunga Tonga itself, the initial wave may have been 90 meters high. The explosion had major impacts in the atmosphere. The wind speeds away from the eruption reached hurricane speeds, the ejected water reached the stratosphere. The pressure wave went around the world several times. In Manchester we detected the pressure wave 7 times. A lightning storm hit the rising column of water and ash, with the most lighting strikes every detected. One of the strikes was so strong it was detected in gamma rays, the first time this was ever done from lightning. The ejecta ended up in the ocean, but it was discovered that these debris flows had cut the communication cables to Tonga – 50 kilometers from the eruption. It turned out to be the largest volcanic explosion since Krakatau – not the largest eruption, but the largest explosion. It was an ideal test for the detection systems for violations of the Comprehensive Nuclear-Test-Ban Treaty
Wave physics

Explosions generate a series of waves, which can be detected at distance. Some waves travel through the atmosphere, some through water and some through solid rock. An explosion in the atmospheric will cause mainly atmospheric waves, underwater explosions give water waves and underground explosions cause earthquake-like waves in the earth. The CTBT monitors listen for all these kinds of waves.
Let’s first do some physics. A wave occurs when something is pushed or pulled forward, backward or sideways, and the moving particle then pushes or pulls the particle in front of it in the same way. The original particle ends up where it started, while the wave moves forward.
The best known type of wave is the sound wave. It is how we communicate (or at least it was until the invention of the mobile phone effectively ended communication). Air particles are pushed forward, they push the air ahead of them, etc. At the same time the air ahead pushes back, forcing the molecules behind to go back to where they came from. The wave moves forward at the speed of sound, while the air molecules themselves stay where they were. The speed of sound is 330 meters per second. The sound from an explosion 100 km away will take 5 minutes to arrive.

P wave
Sound waves can occur not just in air. They can also travel in water or in rock. The mechanism is the same, but they travel faster that way, reaching several km/sec in rock. The sound wave in rock from an earthquake is called the ‘P’ wave. ‘P’ stands for ‘primary’, as it is the first wave to arrive.
The second type of wave is where the particle is pushed sideways rather than forward/backward. It doesn’t work in air or water, as they don’t mind going sideways and don’t push back. But in rock, there is resistance. Rocks do not like being deformed this way and they push back. Now the wave travels the same way as before. This wave is called a ‘shear’ wave. In earthquakes it is called the ‘S’ wave, but ‘S’ stands for ‘secondary’, not ‘shear’, and it is called this because it travels slower and arrives later than the ‘P’ wave.

S wave

Because shear waves exist only in solid rock, if a P wave is seen but no S wave follows, it suggest there is liquid between us and the earthquake. This may indicate a magma reservoir, for instance.
Confused? This youtube video may help explain how a wave travels – or not.
In an explosion, the force (pressure) is directed away from whatever detonated. This is very good at generating P waves but terrible at S waves because there is little or no sideways motion to begin with. In contrast, an earthquake arises from movement along a fault, for instance the Andreas fault (just to scare the Californians among us). Now all the movement is sideways, so this is very effective at generating S waves but terrible at doing P waves. (It depends on the direction you are looking. P waves are generated along the fault line.) So this is a way to tell the difference between an explosion and an earthquake.
Waves can also travel along a surface. This can be a water wave on the surface of the sea, but it can also happen on the surface of the Earth. There are two types of these surface waves. In a water wave, the particles mainly move up and down. On a rock surface, the particles can also move sideways, similar to the shear waves that were already mentioned. The ‘up and down’ waves are called Rayleigh waves. The sideways ones are called Love waves. If you see an earthquake roll towards you, and your house is moving up and down before collapsing, it is Rayleigh wave. If the house is being shaken apart sideways it is a Love wave. Californians, take note.
Finally, surface waves can also travel in a plate of some thickness. Whereas Rayleigh waves only affect the surface to a depth of about the length of the wave, these waves affect the entire plate thickness in a quite complex motion. They are called ‘Lamb waves’. They occur for instance in the atmosphere, where the ‘plate’ corresponds to the troposphere. Explosions in air can generate such Lamb waves. However, atmospheric Lamb waves need a lot of energy to get started; they have been seen only after major events, such as Krakatau, Tunguska and solar eclipses. The pressure wave that circled the globe multiple times after Hunga Tonga was a atmospheric Lamb wave.
You may also have come across the term ‘gravity wave’. In most of the cases which we have seen, particles pull each other back to where they came from. In gravity waves, the pull-back comes from gravity. Clearly, this only happens if the wave is up and down, not sideways, as as gravity is not interested in sideways motion. Waves on the surface of the water act this way. As the wave arrives, sater rises; gravity objects and pulls it back. This mechanism can also work in the atmosphere. Because gravity is not affected by the boundaries in the atmosphere, such as the troposphere-stratosphere transition, gravity waves can extend across these boundaries, even into the mesosphere.
Hunga Tome eruption cloud. The wave pattern in the cloud are gravity waves
This is the end of the physics lesson. Time to wake up and smell the coffee.
Seismographs
All 50 or so seismographic stations picked up the signal of the Hung Tonga explosions. The figure below (as most pictures it is taken from Donner et al.) shows some of the signals. The traces are ordered in distance from the explosion. The blue circles show when the P wave from the onset of the eruption (just after 4am UTC) would have been seen at each station. The blue triangles show the same for the S wave: these arrive later, because they travel slower. The blue line shows the predicted arrival of the Rayleigh wave, the slowest of the lot at about 3.7 km/s. For the nearest seismographs, the signals of the three waves arrive near-simultaneously and become mixed up.

Seismograph signals from the Hunga Tonga eruption
The nearest seismograph show two more explosions, which happened at 4.15am and 4:18am. The orange and red points and lines show the progression of the various waves from these two events.
It is immediately obvious that the dominant seismic signal is from Rayleigh (surface) waves. The P and S waves of the first eruption are not visible on the traces. The P waves from the later eruptions are seen, but only at stations more than 5000 km away – for closer stations, the Rayleigh waves of the earlier eruption arrive before the later P waves and make them impossible to see. For the same reason, S waves are only discernible at the most distant stations. Where they can be seen, they seem similar in strength to the P waves.
For earthquakes, the S wave is normally much stronger than the P wave, because an earthquake originates in shear motion. That is not the case here, and it favours an origin in an explosive event rather than an earthquake rupture. The strength of the Rayleigh wave also favours an explosive origin, possibly near the surface.
Combining all the stations and extrapolating the signal back to the source, it is possible to see the individual events. This is shown below. The plot is logarithmic, meaning that a signal that looks two times stronger is in fact 100 times more powerful. There are explosive events at 4:01am, 4:15am, 4:18am (those two are by far the strongest), 5:30am and 8:30am. In between there is considerable seismic noise.
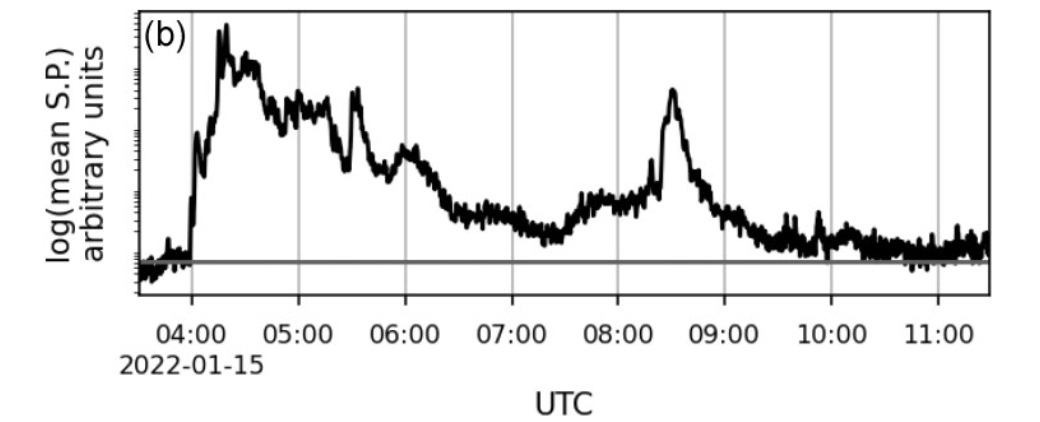
The seismic power generated by the Hunga Tonga eruption
The eruption started around 4am, building up a large explosion within a few minutes. After that the activity continued, with a sudden very large explosion 15 minutes later, following within minutes bu a second one. The activity was continuous until 5:20 when it dropped but quickly followed by a new burst. After 6:30 activity was low level, but with another large outburst at 8:30. The activity became very weak by 9:30 and had ended by 10:30 am. The complete eruption lasted 6 hours.
Infrasound
Infrasound is an atmospheric sound wave, in the form of a traveling pressure wave. Although called ‘sound’, the frequency is far too low to be picked by our ears. The frequency is milliHerz, rather than the few hundred Herz our ears are designed for! It traveled large distance using the stratosphere as a waveguide. Such a wave was first detected after the Krakatau eruption, In 1908, it was detected after the ‘Great Siberian Meteor’ as it was known at that time (now known as Tunguska) with an amplitude of 1.2 mbar in Irkutsk and 0.3 mbar across Europe. The Tsar Bomba caused around 2 mbar more than 2000 km away. In comparison, Hunga Tonga caused 5mbar at a similar distance, similar to the Krakatau wave. Clearly a lot of the explosive energy went into the atmosphere.
All 53 IMS infrasound detectors recorded the pressure wave. This is unprecedented. Because the travel speed is affected by the winds in the stratosphere and can vary, extrapolating back to the exact time of origin is not as accurate as for the seismic signal. The best results were found for four stations westward of Hunga Tonga.


Infrasound signal fro the atomspheric pressure wave
The infrasound waves show the sharp events at 4:15 and 4:18 am. The 4:01am event was only weakly detected. After 4:18, the atmospheric noise continued high until 4:30am. There was another explosion around 4:34am and a smaller one at 4:50am. This agrees with the high level of seismic noise until after 6am but the details are different. The sharp infrasound signals between 4:30 and 5am are not visible on the seismographs.
Hydroacoustics
The IMS contains 11 hydroacoustic detectors. Five are deep-water seismographs and 6 are hydrophones. These last 6 are used for Hunga Tonga. These stations are at a depth of around 1 km, which is the depth where acoustic signals can travel long distances.
Only the instruments ones with a direct line of travel from Huna Tonga. In several instrument, there were islands in the way which delayed the signal.


Hydroacoustic signal
The underwater signals differ from the other two in some respect. The early phase is picked up relatively stronger, and there is a quiet phase between the 4:15 and 4:18am events. A precursor event is seen around 3:45am, and there is an event at 4:12am not seen by the other methods.
The yield
The seismic signal has been difficult to assess. The body waves (P and S waves) have been used to assign magnitude, while the Rayleigh waves give a higher strength. Combining all seismic signals may give a magnitude of the three main explosions of 6. Converting this to energy would indicate 300 kton TNT. On the other hand, the strength of the atmospheric waves have been used to calculated as much as 100 Mt TNT. That is an entirely different beast! If that amount of energy had been used to generate seismic wave, an earthquake magnitude of 8 would have been possible. Clearly, very little of the energy went into the ground. This was not a closed magma chamber blowing up.
The energy becomes comparable to (but perhaps a factor 2 lower 4) than Krakatau. This was indeed a once-in-a-lifetime eruption.
The eruption
The different methods saw different aspects of the eruption. They agree on the duration, the presence of large explosions and the continuous activity. They disagree on the details, especially the hydroacoustics. The natural explanation for this is that the eruption occurred partly below water, partly above. The relative weakness of the seismic signal indicates a shallow, mostly open eruption.
There is little doubt that the eruption started below water. The eruption the previous day had removed the part of the island where the eruption occured, as shown by images taken afterwards. Therefore, the fact that the hydroacoustics picked up precursor activity missed by the other methods is understandable. The lack of seismic activity may suggest that the 3:45am event wasn’t explosive in nature. A vent may have opened. My thinking is that a small flank collapse may have started the events.
The 4:01am explosion was the proper start. It was strong in the hydroacoustics but weaker in seismic energy and infrasound, at lest relative to the events that followed. This again was mainly below water, as was the 4:12am explosion. The 4:15am explosion was very much larger. This was also the explosion that started the atmospheric Lamb wave. It was massive, the loudest volcanic bang for over 130 years.
It appears that the eruption started 150 meters under water. One suggestion is that the 4:01am event opened the conduit, so that water began to intrude into the magma. Such an intrusion leads to a phase of film boiling: wherever magma and water are in direct contact, the water boils in a thin layer. This can be stable for a brief period (minutes) if it happens under sufficient pressure – 150 meters of water will do for this. There is now a thin layer (film) of vapour which keeps the magma and water apart. Eventually, the boiling films become unstable and the vapour condenses back into water. This can happen naturally, or it can be caused by a new failure, such as a rockfall. Now water and magma are in direct contact. Within milliseconds, the pressurised water flashes back to steam, fragmenting the magma. The water at this point is supercritical, at high internal pressure. The new vapour wants to take up 1000 times its original volume. The water-magma mix explodes.
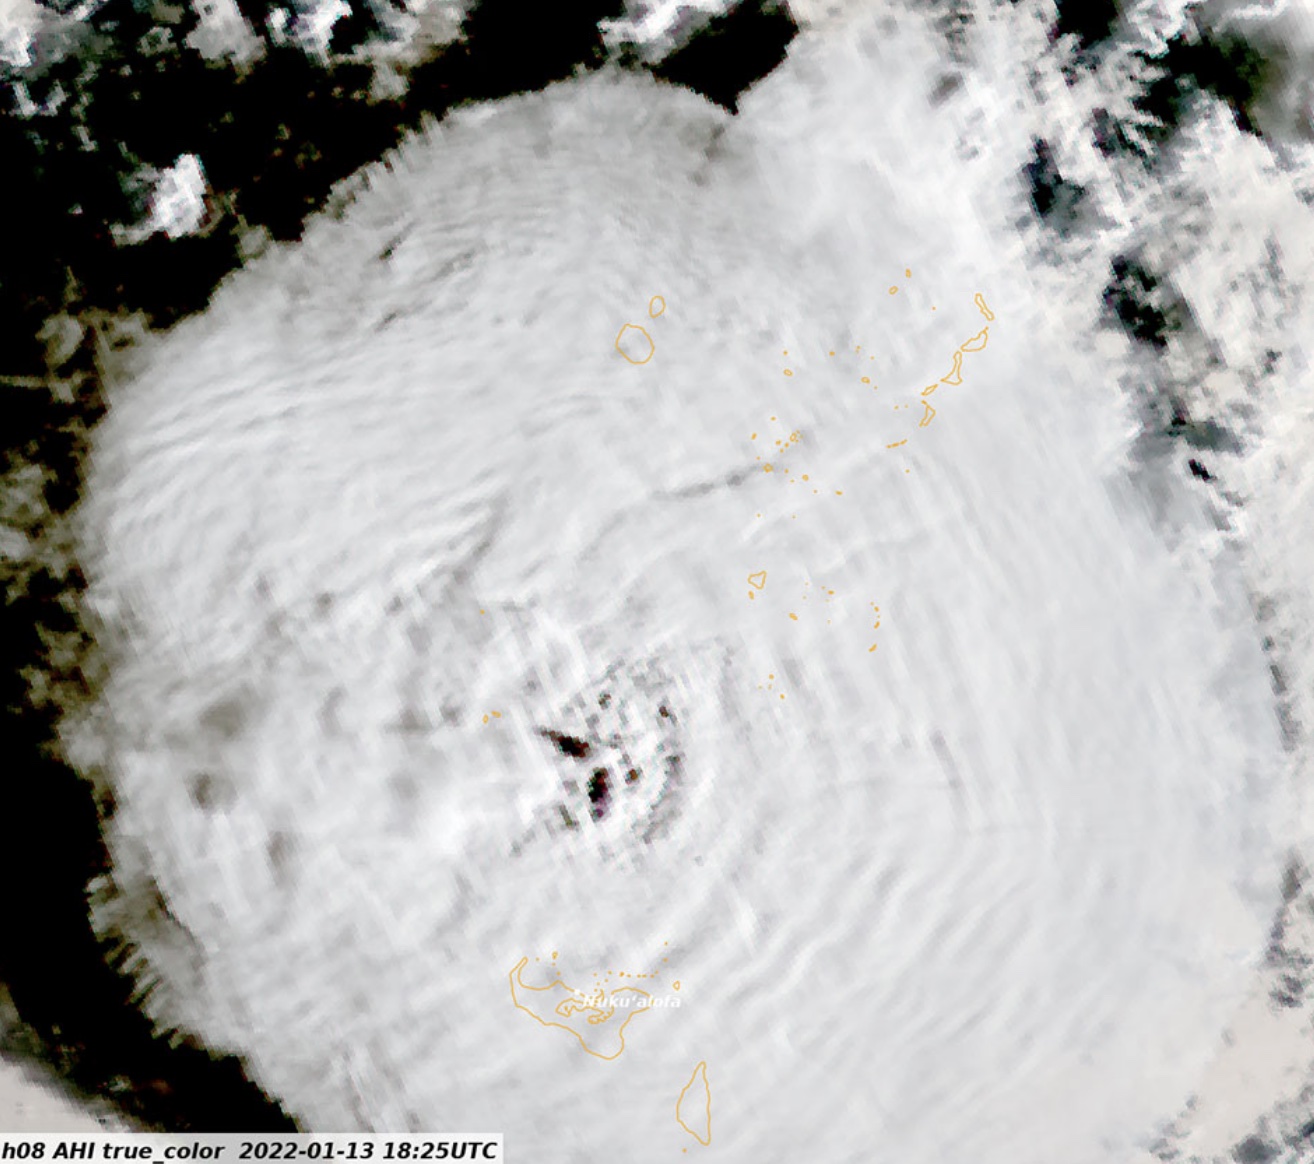
The eruption cloud was first seen by the Himawari satellite at 4:10am. (There are images every 10 minutes.) This indicates that the 4:01am eruption was already a large one which broke through the water surface and lifted a cloud to 10-15 km height. This explosion generated a loud hydroacoustic signal but much less seismic signal. My personal opinion is that this was a continuation of the large eruption of the previous day. The 13/14 January eruption lasted 22 hours with numerous individual explosions. It may have ended when the conduit became blocked, perhaps by debris or collapse. The 4:01am eruption was throat clearing: the loud hydroacoustic signal could indicate a slide. The explosion deposited energy into the water but less into the ground, so it was probably fairly open upward: this was not inside the conduit but at the top.
The process of water entrainment in the magma now began. At 4:12am there was a larger event seen (heard) in hydroacoustics. And at 4:15am came the climactic explosion, the one that pushed the eruption cloud into the mesosphere and generated the atmospheric pressure wave. The size of an explosion from water-magma mixing is determined by the surface area that is in contact. The enormity of this eruption would suggest that water had come in to the major part of the conduit or perhaps to the magma sill. The previous bangs had caused a large opening for the water to pour in. Pour in it did.
The next event was at 4:18am. But here the characteristics were different. The P waves of the 4:15 explosion started with a positive excursion: this was a high pressure wave radiating in all directions, i.e. an explosion. But the 4:18am started with a negative excursion, a pressure drop. This was not an explosion but an implosion. The 4:15 am explosion had blown out the magma. The 4:18am bang came when the volcano collapsed into the hole. This gave a bang as large as the preceding explosion, as it involved the same volume. These two explosions generated the large and damaging tsunami which spread across the Pacific ocean.
There was a poorly understood event around 4:30 and a larger explosion at 5:30. A large explosion at 8:30 finished the eruption: the plume from this again reached the stratosphere. It was not seen in satellite images because of the previous clouds, but probably reached over 20-25 km. Over the next hour or so the eruption wound down and Hunga Tonga was not heard from again.
The eruption was a low VEI-6 to high VEI-5 on the volcano explosion scale. That puts it on par with Pinatubo and Santa Maria, but below Krakatau. However, the energy deposited into the atmosphere was ten times larger than Pinatubo and was comparable to Krakatau, while comparable little energy went into the rock.
This is probably typical for shallow submarine eruptions. Santorini may have been like this, explaining the large tsunami but leaving little evidence in the ice cores. It is not the volcanic islands that are the problem. It is the ones you can’t see, or which only just break the surface. Think Bogoslof – or Iwo Jima.
Nuclear volcanoes
This study of the Hunga Tonga eruption used the CTBT network, aimed at monitoring for nuclear explosions. Did this network work? It showed that this event was not an earthquake but an explosion. It showed the importance of monitoring water, earth and wind. But did it show that this was not Kim of North Korea doing a Bond? Could it tell that this was not nuclear?
The fact that multiple explosions were seen with continuous activity in between is a pointer at a volcanic origin rather than a nuclear weapon – they tend to explode only once. The decisive data though came from the fourth element, fire. No radioactivity was detected.
An event like this may not re-occur for a century or more. Or it may happen again in 2024. In any case, the 2022 eruption was an opportunity to test a system we hopefully will never have to use in a time of anger. Nature is not friendly – but it is not our enemy either. It is not like us.
Albert, January 2024
This post is based on the following paper. The images are taken from that paper.
S Donner, A Steinberg, J Lehr, C Pilger, P Hupe, P Gaebler, J O Ross, E P S Eibl, S Heimann, D Rebscher, T Plenefisch, L Ceranna, The January 2022 Hunga Volcano explosive eruption from the multitechnological perspective of CTBT monitoring, Geophysical Journal International, Volume 235, Issue 1, October 2023, Pages 48–73, https://doi.org/10.1093/gji/ggad204

Tsunami aftermath at Tonga


Did anyone else notice the green fumes in some places?
I’m guessing those could have been copper cables or whatever electric installations they had in places. Or rather the webcam color shifting the lava hue on the smoke towards green. What do you think?
New cam showing the front of the lava flow.
Caution: mute the audio. Crappy music playing for no good reason.
https://www.ruv.is/sjonvarp/beint/ruv2
It’s the same old RUV Þorbjörn camera. You just found the direct RUV broadcast link.
Oh. 😀
Someone on the last page asked if the rift keeps extending south => the above cam is good to follow on that.
I have my mouse cursor just straight down from under the n of “nordan” where I saw the southernmost (intermittent) splats of lava to keep track.
Also, from the Husafjall camera it seems to show the fall of the land and there looks to be a hump in the middle. It looks like most of the lava north of the hump is spreading out and has to get over the hump to go south.
There is only a short part of the fissure south of this hump.
Any views on whether this is / will affect the amount and speed of lava flow towards Grindavik?
From those aerial pictures it looks like the lava might have ctually already reached Grindavik by now if the wall wasnt there to divert most of the lava to the west.
Yes, it looks like it is as the very least partially diverting or slowing the lava flow.
More interestingly it looks as if the berm is cleverly diverting the flow in a fork around the greenhouse. So unless the berm height is overflowed the greenhouse might still have a very small chance of survival!
Someone had to take a punt on where to put the berm, no one can predict if the fissure ended up one side or another. But if they used the topography to divert flow around the greenhouse rather than as only a wall to block the flow, then it might be quite a clever approach.
This berm thing is all now, so it’ll be experiment, experiment, experiment through this series of fires I guess,
RIP lamppost. You stood your ground but it wasn’t enough. Your heroic efforts will be remembered. Melt in piece! 🙂
Green house lamp post 2024, hashtag never forget! 😀
Although I would love it if this is the only casualty in this eruption.
Lights on until the very end. 🫡
I do hope that they didn’t move the berm further north solely to save the greenhouse. It may turn out to be an expensive mistake. If it had been further south it would be saving Grindavik now.
No they didn’t. They just made a guess based on the landscape and older eruptions where to put it.
The greenhouse was severely damaged by the events on 10 November and was pretty much considered a write-off. The berms need to work with the landscape to be effective. Put them too close to the town and they wouldn’t be as effective in diverting the flows.
Woohoo! Hopefully it does stop just short of Grindavik.
The quake map for the last 10 hours is crazy. Far reaching effects from this morning’s swarm.
https://vafri.is/quake/
Oh and Eyja had a M3.6 too.
IMO gets overwhelmed quickly during swarms. Be careful about trusting depth/epicenter even for moderate size events. It’s better to wait for the dust to settle. You want that 90+ “gaedi”! 🙂
Two images of the RUV cam 60 minutes apart:

Even though the eruption fissure is partially below it, it appears that the embankment is helping to save Grindavik.
Looks like the gap where the road goes through the wall is being closed off, now that lava is flowing that way more seriously
Right, and not much way to go:
Source: https://livefromiceland.is/webcams/fagradalsfjall
Steam explosion in Grindavik! oh $%# new fissure in town!
Saw that at 12:07, massive cloud of steam
Wait a minute .. .what … on the right …
Well therecis a new fissure in Grindavik 🙁 Shawn Wilsey live drone flight on youtube
Next to Grindavik not in it, but seems like it could get longer soon
New fissure right next to town!!! 😮
Live Drone from Shawn Willsey
Unfortunately it looks like a new fissure has opened right next to the town
I hope this doesn’t turn into the main vent since it’s at the lowest elevation of all the fissures. But its also the fartest from the magma source so maybe it won’t survive long.
It is using the system of cracks and fissures to spread the lava, so it would not be strange if it continues moving in a SW direction…. 🙁
Roughly 1km to the harbour: Any chance of doing the ‘Heimaey’? (Pump water there?)
New article is up:
https://www.volcanocafe.org/the-sundhnukur-fires-summary-precedents-and-future/
A fissure has popped up further South. Small, but it’s actually right at Grindavik. Or tens of meters from houses.
https://www.youtube.com/watch?v=Fec3ipZWMTk
Geologyhub doing a live coverage situation of Grindavik with another geologist.