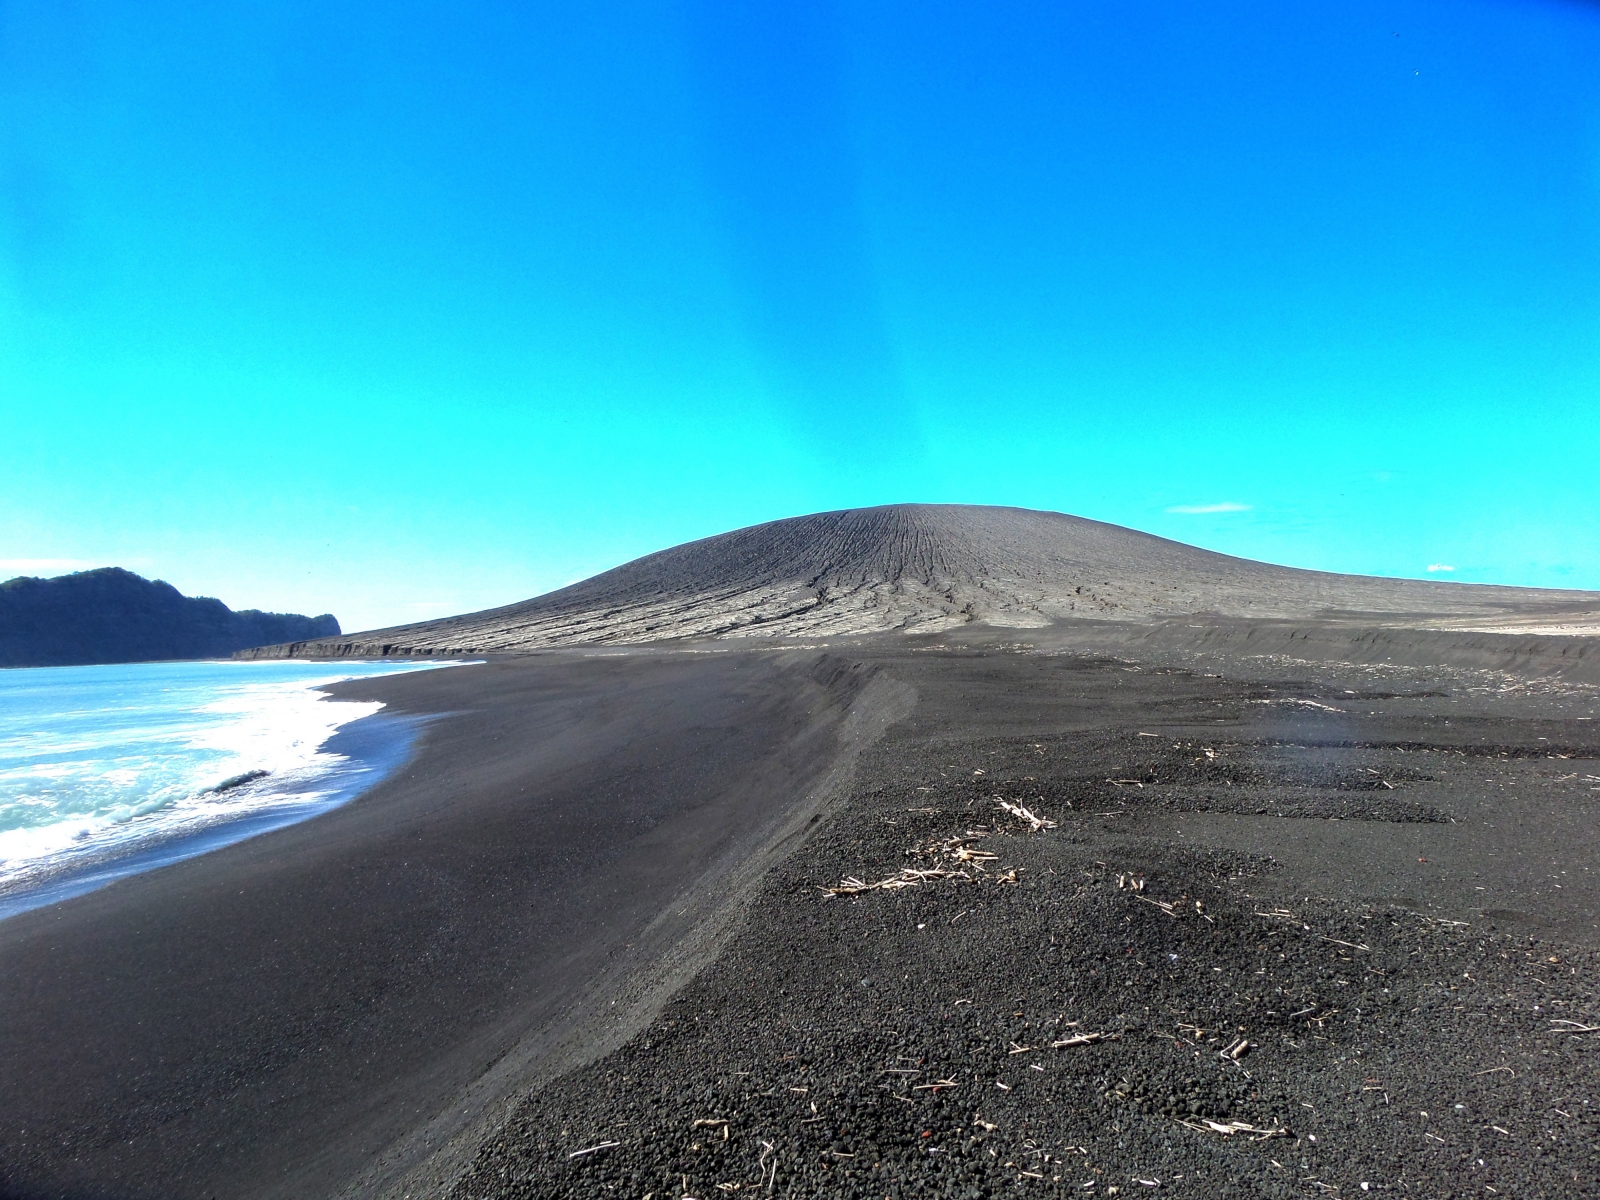
The cone and ridge before the destruction
As more information comes in, it is time for a brief update, and for a theory on why the eruption of Hunga Tonga was so destructive for what was, after all, a fairly small volcano.
The death toll of the tsunami at the moment stands at five, three at Tonga and two in Peru. There is extensive damage along the western shores of the Tonga archipelago. Damage at the capital is limited, but other islands have not yet been contacted, and it appears that they have been affected much worse than initial reports suggested.
There is damage further away, boats in harbours in New Zealand and Japan, and some minor coastal damage in the US. There is an oil spill in Peru, from a tanker that was pumping out oil as the tsunami rolled in. The coast is polluted over 1 or 2 kilometers. But these pale into insignificance compared to the local damage.
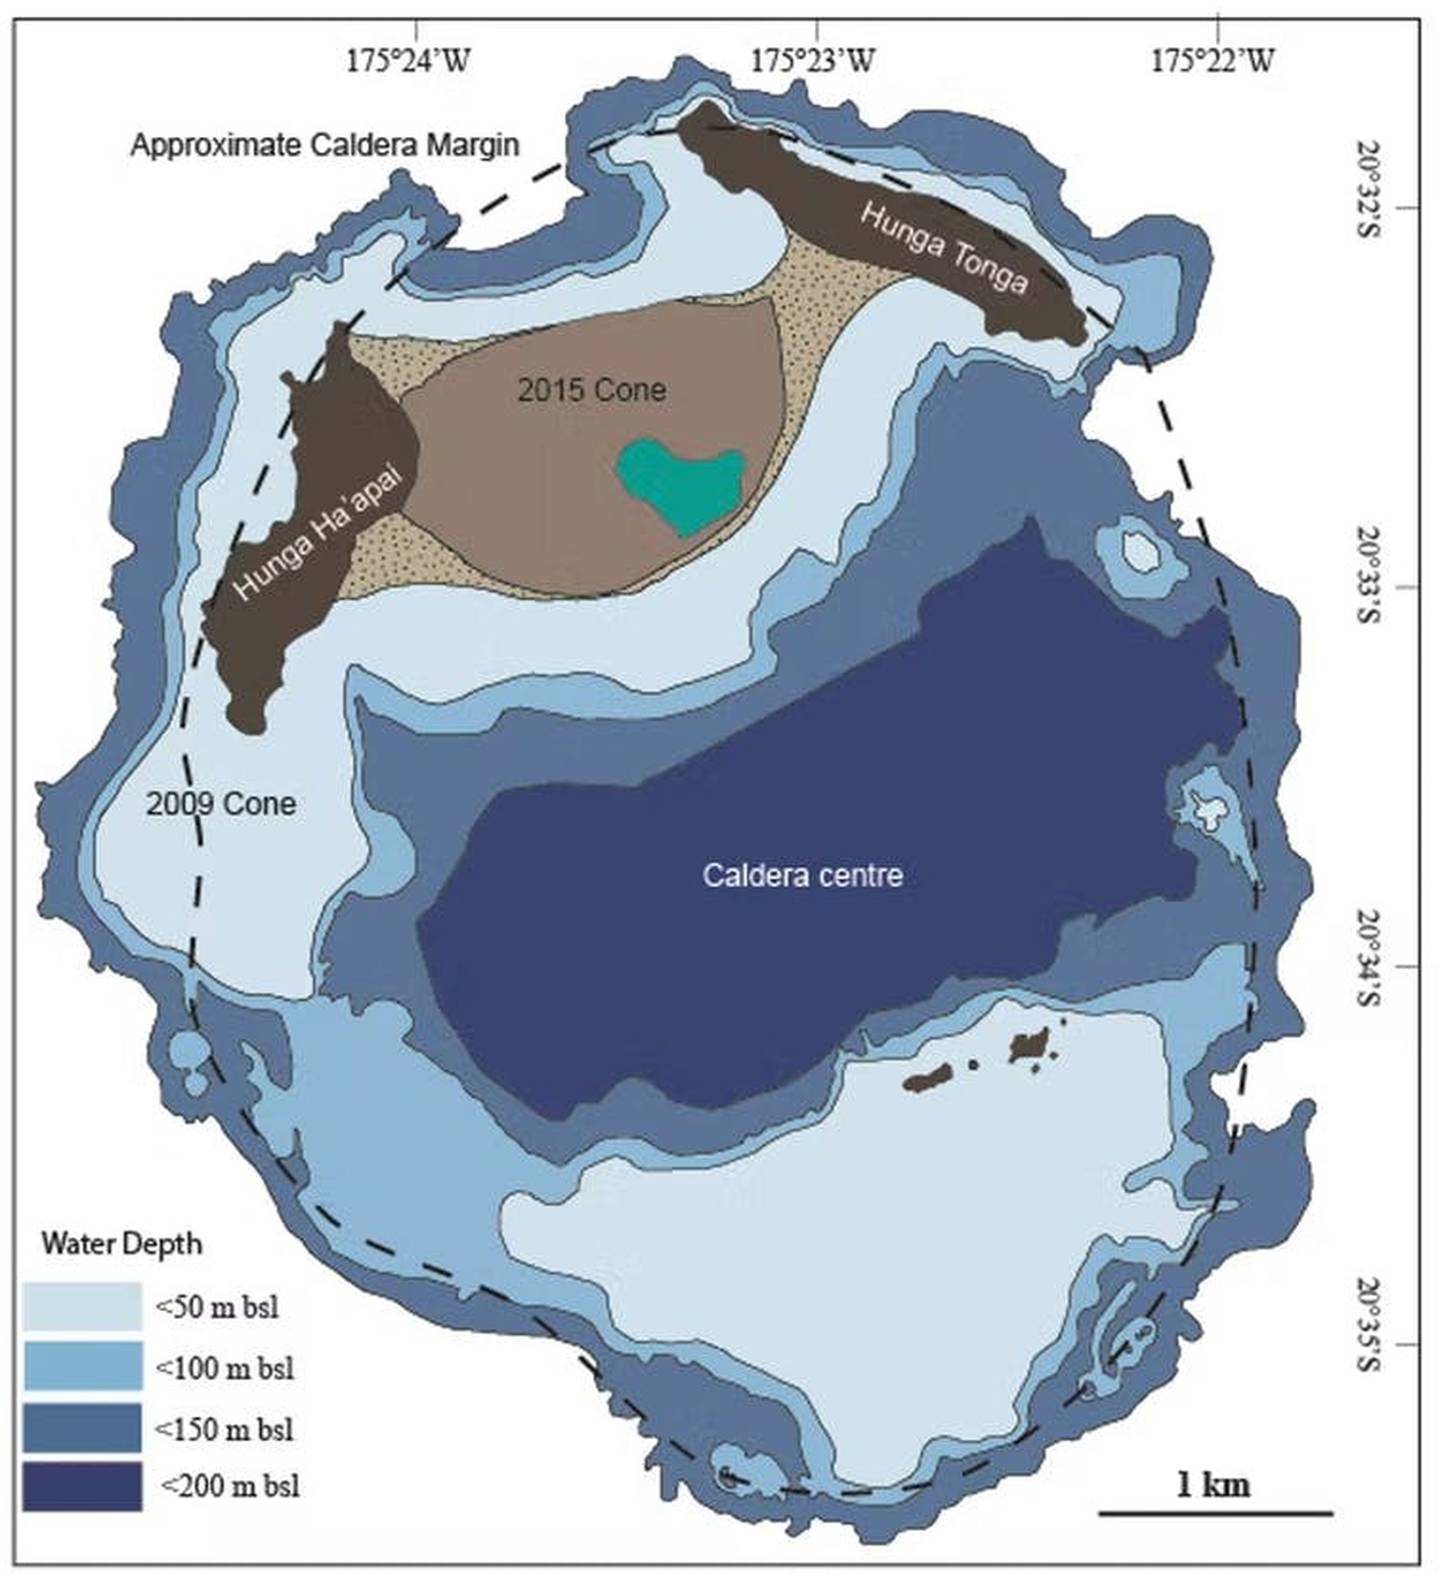
Hunga Tonga has been reduced to two small slivers of land, as shown above. (Officially it is called Hunga Ha’apai, and Hunga Tonga is the eastern ridge, but this distinction has quickly been lost.) It is interesting that these are the highest ridges of the old caldera rim. The lower lying land, perhaps some tens of meters above sea, is all gone. That includes two small islands that existed 3 kilometers to the south, on the southern caldera rim. The destruction suggests that it was caused by more than the explosion (which would have gone for the steep, high ridges) . The tsunami may have contributed to the lost land, especially if it was much higher than we assumed.

Sentinel 2, Jan 17 2022

This is from the same Sentinel image as above, but using different filters. It covers a larger area of about 20 km across. The bright spot right of the centre is the remnant of Hunga Tonga. The linear stripes are floating debris.

Photos suggest something like 1-2 cm of ash on Tonga, 60 km from the epicentre of the blast. That information is not enough information to calculate the total volume of ash! For that you need to know thickness at several distances from the eruption. But we can do a comparison. Hekla in 1108 AD covered about 10,000 km2 within the 2-cm isopach (contour of ash thickness). Note that that was with a strong southerly wind: the ash was almost entirely to the north, with 2 cm thickness out to 150 km away but only in a narrow cone. Assuming equal distribution in all directions, the 2-cm isopach of Hunga Tonga would be similar in area. Hekla ejected 2.5 km3 of tephra. We are in VEI-5 territory, but with very large uncertainty!
Comparing to to Ilopongo 540 AD, where the same isopach covers an area of around 150,000 km2 shows that we are very definitely not talking VEI-7! Taking that eruption (107 km3 tephra including ignimbrite) and scaling it to our area gives 8 km3 for Hunga Tonga. Those two numbers, 2.5 and 8km3 give us a ballpark, but no more than that. We don’t know enough yet.
A report from Tonga itself speaks of 10 cm of ash. That would push the numbers up to over 10 km3 of ash. However, I expect this refers to maximum thickness (wind blown) rather than average.
There have been claims that this eruption was ash-poor for its size. Before we make that conclusion, we need to know much more about the amount of ash. These estimations point at a VEI-5 tephra class, but it is based on a number guessed from one long range photo!
The tsunami was far worse than first reports suggested. The early videos and stories showing a dangerous but manageable wave appear to have come from sheltered areas. The capital was not exposed to the largest waves. But elsewhere on the archipelago, waves of 5-10 meters high have now reported. A few small islands were wiped off the map. This explains the size of the long-range tsunami, with 0.5-1 meter commonly across the Pacific. The height of a tsunami depends a lot on the shallowing sea near the coast, and on bay resonances. A 10-meter wave at Tonga would be down to 10 cm at the distance of Alaska (this includes a correction for the curvature of the Earth – people adamant that the Earth is flat will see a smaller tsunami). That is indeed roughly what was reported.
The scary thing is that a VEI-5 managed a Pacific-wide tsunami. Imagine what a large VEI-6 could do in similar circumstances!
Let’s discuss three aspects: the explosion, the tsunami and the air pressure wave. After I will talk about the destruction of the islands of Hunga Tonga before the bottom line: how did this happen, and can it happen again?
Boom
This was an underwater explosion. This is clear from the fact that the area above sea level around the centre of activity had already been removed b the explosion of Jan 14, itself possibly VEI 4. The sea had covered this area.

Planet, Jan 14, after the initial explosion but before the main event. The centre of activity is now under water
There are of course examples of underwater explosions. We even had made some ourselves. Here is one we made earlier: the Hardtack Umbrella event, in hindsight a stupendously stupid polluting idea to use nuclear weapons in the sea. It was an 8 kton explosion. detonated 50 meters below water. On the video, note the wave engulfing the ship.
The wave is caused by displacement of water. The big explosion vaporises the water around it. This expands by a lot (roughly taking up 1000 times its original volume). If a globe of 100 meter radius evaporates, it creates a bubble of 1 kilometer in radius. (The Hardtack explosion did not reach anywhere near this size.) The bubble expands supersonically – faster than the speed of sound in water (1500 m/s). The water can’t get out of the way that fast, and a shock wave forms. The bubble continues to expand but it overshoots. Once it gets too large, the pressure in the bubble is now lower than that in water, and the bubble begins to collapse. You will get a pulsating behaviour where the bubble expands, collapses, expands, etc, all within a fraction of a second. There are many youtube videos showing this effect. Each collapse causes an overpressure of water at the central point, and this causes a jet of water suddenly spraying up, as seen in the video above. And if the explosion is at the bottom of the sea, this jet can also bring up debris from the sea floor.
The description above is for explosions where the bubble is smaller than the depth underwater. This is also the case for those youtube videos on experiments of underwater explosion (if only for reasons of safety!). In the case of Hunga Tonga, this wasn’t true. The bubble became larger than the depth, and exploded into the air on its first expansion, with a speed far exceeding the sound speed in air. This caused the huge bang heard as far as Alaska (though regrettably not by our local correspondent motsfo): it was a sonic boom amplified by the fact that the speed of sound in water is so much higher than that in air.
On reaching the freedom of the atmosphere, the overpressure in the bubble dropped instantly and water saw a chance. It pushed back into the hole, with the water flowing in from all directions and colliding in the centre at the speed of sound. This violent collision threw a big jet of water kilometers into the air. It also caused the water bulge which started the tsunami. The bulge, tens of meters high, began to travel outward.
Tsunami
The speed of a tsunami depends on the depth of the water: it goes as the square root of the depth. The wave took around 10 hours to arrive at Alaska. That gives a speed of 250 m/s. This speed is reached for an average depth of roughly 6 km. This is indeed the depth of much of the Pacific.
The wave travels at this enormous speed through the ocean, but at very small amplitude, only a few centimeters in height. A wave a few hundred kilometers long and a few centimeter high is difficult to detect! But when the wave approaches the coast, things change. It slows down by a lot. When the sea becomes 100 meter deep, the speed is down by a factor of 7. The wave from behind is still traveling at the old speed. The water now piles up. This piling up causes the tsunami.

The same effect occurred at Hunga Tonga itself, but in reverse. Initially the wave was slow, as the water around Hunga Tonga is not deep. It accelerated as it reached deeper water. The other Tonga islands are sitting on a separate underwater ridge, so here the wave slowed down again and the wave height build up. The height it reached would have depended very much on local conditions, the presence of a reef, etc. But the wave would have come suddenly. As it began as a water bulge, there was no initial withdrawal of the water. There was no real warning.
There has been discussion whether the long distance tsunami really was a water wave. The alternative would be a meteo-tsunami, formed by the air pressure wave. The timing settles this question: the arrival in Alaska agreed with speed of the ocean wave, whilst the air pressure wave had arrived saveral hours earlier. The tsunami around the Pacific really did come from this single-point failure, the Hunaa Tonga eruption. It will have been amplified by local conditions, such as the shape of a bay, but it originated from the sea.
But what about the reports of waves in the Atlantic? That is rather far away, and America forms a bit of an obstacle: it takes a big wave to cross that! In the Caribbean, waves of some tens of centimeters were reported. That could be within range of what can be caused by the air pressure wave. And it is not unique: after Karakatau 1883, the tsunami reached far and wide with an arrival time consistent with the known depth of the oceans. But in the Caribbean it arrived much too early. It was unexplained at the time, and a different cause was suggested, perhaps some local event such as an earthquake. Perhaps this too was the air pressure, a meteotsunami. Meteotsunamis are often caused by wind, but that can be excluded here.
Air wave
The explosion was heard far and wide. It arrived at Tonga still as a sonic boom, and it was deafening. That would have been within minutes of the explosion, perhaps five minutes before any ocean waves arrived.
It is an interesting fact that closer to the eruption, nothing may have been heard. The sound wave was emitted in all directions. But the speed of sound is larger at sea level than at higher altitudes. It depends on temperature (not pressure): the sound speed is higher in warmer air. As you go up in the atmosphere, the temperature drops and sound slows down.
Imagine carrying a very big vertical stick (representing the crest of one wave of the sound where the sound is moving horizontally; it may be easier to visualize as water wave on its side). If the top moves slower than the bottom, then the stick will not remain vertical but will start to bend back. The sound wave travels at a right angle to the stick, so now it begins to travel away from the ground. Indeed, when St Helens blew, people tens of kilometers away (where they should not have been) heard nothing. As far as sound was concerned, it was a deadly quiet zone. The same is true for lightning storms. You hear the thunder for nearby storms, but not for ones you see on the horizon. You are in their silent shadow zone.

Sound carries further if the air at ground (or sea) level is colder than air higher up. In that case the wave hugs the ground and can be heard farther away. You really do hear better in winter!

Once the sound wave travels upward and away from the ground, it eventually reaches the tropopause. But here the opposite happens. The temperature, and thus the sound speed, now increase with altitude. The temperature is lowest at the tropopause, and it gets warmer again higher up. So the sound wave does not enter the stratosphere but it reflects back to the surface.
This reflection can happen close to the ground if there is a temperature inversion. This is called troposphere ducting and it allows (sometimes) thunderstorms to be heard to hundreds of kilometers distance. That is not enough for us. By ducting the sound at the tropopause, if it is loud enough it can carry many thousands of kilometers. In the right conditions it bends back to earth, to startle the unsuspected listener with the sounds of a distant battle. In the past, it was often compared to cannon fire. Of course that is not something we are too familiar with nowadays!
The people on Tonga startled by the bang, heard something that may have come back from the stratosphere. So did people on Fiji, in Australia, New Zealand and even Alaska. Hunga Tonga, I think, now holds the record for the most distant sound heard by ear by people. Someone in Alaska is the world record holder!
The audible sound was accompanied by a pressure wave, a rise and fall in air pressure, This wave was measured all around the earth. In Manchester it arrived at 7pm UT, some 15 hours after the eruption, and lasted 20 minutes. A quick computation shows that it traveled at roughly 350 m/s, i.e. at the speed of sound. Krakatoa had done the same, and its pressure wave was measured all over the world.
There was a second pass of the wave in Manchester at 2am. This was the wave that had traveled the other way around the world.
The next day, the wave re-appeared at 7am, followed by its counter-rotating counterpart at 2pm. By this time it had gone around the world 1.5 times. After Krakatoa 1883, in some places the pressure wave was detected 7 times. Imagine a sound so loud that it was heard worldwide for five days! (Of course we can’t hear these pressure waves.) We are not there yet with Hunga Tonga but who knows.
The figure shows the Manchester wave of Jan 17 with bumps at 7am and 2pm. There are better detections available – but it is nice to see one next door.

The Manchester wave carried an excess pressure of 1.5 mbar. This was similar to what was reported at various places after Krakatoa. The sound wave appears to carry a similar amount of energy to the sound wave of Krakatoa, even though that was a significantly larger eruption. I believe this is due to this eruption being a little below the water surface. This amplified the pressure wave in a way similar to tsunamis: as the pressure wave entered the air and slowed down, it piled up and this increases the amplitude. This was (and perhaps still is?) a pressure tsunami.
Destruction of Hunga Tonga
Explosions under water create a far more destructive pressure wave than one in air.
This wave expands out into the water. The water is incompressible and just passes the wave on. When it reaches something solid, it becomes hugely damaging, as the wave has the weight of water behind it. A torpedo acts this way: the shock wave in water punctures the hull of a ship. (It also does considerable more damage as the wave passes through the structure of the ship, much more so than an explosion in air would.)
https://www.navygeneralboard.com/how-do-torpedoes-damage-a-ship/
Such a pressure wave was set by the original explosion at Hunga Tonga. But this was within a confined space. The old caldera wall, 3 kilometer wide, is still there. This shock wave would have bounced off the shallow bottom and the steep wall and reflected back towards the centre. Perhaps this is the cause of the wide destruction of Hunga Tonga. The two small island on the southern rim are gone, even though they were some distance from the explosion. I imagine that this supersonic shock wave shook the old crater rim to pieces below sea level. This acted together with a water wave perhaps as high as 50 meters and the explosion above the water. Only the toughest parts of the caldera ring, protected below water by a shelf and above water by its height, survived.
The power of water
That leaves the question how this eruption happened. Why was it so large and so loud?
We are talking about water getting in contact with magma, as driving the explosion. It has been presented here as a collapse of the roof of a magma chamber, water rushing in and instantly flashing to vapour. That picture has the basics but it is too simple.
When water is brought in touch with lava, there are explosions. But there isn’t one big explosion. For instance, when lava entered the Kilaueau lake (remember that one?), the lake boiled away but it did not cause a big explosion. That is because of insulation. The water touching the lava becomes vapour. It now forms a layer between the water and the lava, and this layer insulates the water. The rest of the water does not boil until the vapour has moved out of the way and the process begins again. Lava itself also insulates well, and once the surface has lost heat to the water, it takes time to heat up again. This is not the way to get a big explosion.
What you need is to confine the water, so nothing can escape. You also need to put it under pressure, and give it time to heat up. The pressure raises the boiling temperature so now the water can be superheated. But don’t put it under too much pressure, as it can no longer boil (see the post on black smokers).
How is this done? For Hunga Tonga, the process started with the Jan 14 eruption. It destroyed the central part of the island to below sea level, and left the conduit open and under water. Water flowed in, but did not do too much except make a big steam cloud, for reasons explained above. Now the conduit collapsed. Suddenly the water was caught between a rock and a hot place, and under considerable pressure from the mountain above. I imagine this happened a few hundred meters below sea level, but no more than 500 meters because the rock would have carried too much weight for the water to boil. The water could not escape, and it began to heat up. Eventually some water boiled and vaporized. The expansion as it vaporized increased the pressure: remember that water is not compressible, and does not respond well to being pushed. The extra pressure broke the blockage. This dropped the pressure, and therefore the boiling temperature came down. All of the liquid water suddenly found itself above the boiling temperature, flashed into vapour (cooling down quite a bit in the process) and suddenly the conduit was 1000 times too small for its contents. And up it went.
The same process could happen on the flank as well: the flank breaks open, water goes in, flank slides down which closes the hole, and it is time to get yourself to a safe distance. It is now a ticking grenade.
This model explains why Hunga Tonga’s destruction happened a day after an earlier large eruption which took the cone top below sea level. It explains why Krakatoa’s huge boom came after three or four big booms over the previous day. These kind of events require priming. And finally, it explains why Krakatoa’s magma chamber survived. (We know that it did because Anak Krakatau formed in the same location.) The roof of its magma chamber was fine: all the action was in the conduit. It predicts that while the initial explosion happened under water, it immediately reached the surface: the vapour bubble grew larger than the depth of the explosion which was only 100 to 500 meters below the sea.
This model it makes it less likely that another such explosion will happen soon. Grenades don’t go off twice. It is possible there is a second grenade there waiting to be primed. For now, however, we should look very carefully at similar locations elsewhere around the world. We know similar sea level volcanic islands, and have discussed them here at VC. We will be much more cautious about them in the future. This kind of explosion is not common. It may not happen every century. But once burned, twice shy.
This won’t be the end of Hunga Tonga. One day the island will reform, and the cycle begins again. But that will take time. In the mean time, few people will ever be able to say to have been on this island. That also is similar to Krakatau: if we had know it would cease to exist, they would have documented it better. We know remarkably little about it. You may want to look at the story below, perhaps the best remaining photographic record of this phase of Hunga Tonga. I think the person is too old to qualify for a Darwin award, but what a story to tell, walking on the biggest bomb on earth. Almost nothing in the photos and video still exists.
Albert Zijlstra, Jan 2022


I’ve posted this before, but here is an 80x40km caldera in the Arctic Ocean, near where the Gakkel Ridge intercepts the continental shelf and turns into a transform fault. Not well known about at all for obvious reasons, and reasonably deep.
https://www.nature.com/articles/srep46248
Oh, a fellow friend of the Gakkel I see. 🙂
Wow a 3000 km3 submarine eruption!
Solid VEI 8
Probaly was an old stale ryholitic / Dacite chamber .. the eruption must have generated an amazing ammounts of floating pumice equal to the whole Vatnajökull Glacier in volume : O : D pumice mats of insanity really
M 4.8 – 36 km NNW of Nuku‘alofa, Tonga
2022-01-19 01:16:39 (UTC) 20.829°S 175.331°W 10.0 km depth
Hopefully that was just the caldera settling and not the ring fault opening up again.
There are two more over the Kermadec Ridge and another two parallel a little further West, all between 4,5 and five. one 2,7 over TVZ. Is that unusually many at the same time?
Does this have to do with it (in case it’s not unusual)?:
https://oceanrep.geomar.de/28167/1/Stratford%20et.al.pdf
(Subduction of Louisville Seamount Chain, plate erosion)
It’s normal for earthquakes to happen in the area. However the two earthquakes mentioned are very close to Hunga Tonga Hunga Haapai, so might be actually coming from the volcano. It is also typical for caldera ring faults to make earthquakes close to M 5. For example Hunga Tonga Hunga Haapai threw an M 4.8 just before erupting in 2009. So that’s why I find the earthquakes interesting. There is a possibility that magma is still moving in the ring fault. However it could simply be some tectonic adjustment or settling of the caldera. There is very poor seismic monitoring so it’s hard to tell.
M 4.9 – 29 km WNW of Haveluloto, Tonga
Magnitude 4.9 mb± 0.1
Location 21.066°S 175.482°W ± 13.1 km
Depth 10.0 km ± 1.9
Origin Time 2022-01-19 23:23:50.219 UTC
Another, possibly coming from Hunga Tonga Hunga Haapai, although it is poorly located.
There were also 2 earthquakes on January 18. List of all the earthquakes near the volcano since the eruption:
M 4.6 72 km NW of Nuku‘alofa, Tonga 2022-01-18 11:03:55 (UTC) 10.0 km depth
M 4.9 68 km NW of Nuku‘alofa, Tonga 2022-01-18 17:59:54 (UTC) 10.0 km depth
M 4.8 36 km NNW of Nuku‘alofa, Tonga 2022-01-19 01:16:39 (UTC) 10.0 km depth
M 4.9 29 km WNW of Haveluloto, Tonga 2022-01-19 23:23:50 (UTC) 10.0 km depth
Hector, do you know what the “standard error” of location of those are ? Is it possible that the latest two were also actually at the caldera ?
I’ve seen the location of earthquakes thrown of by several tens of kilometres from their respective volcanoes by the global catalogue of earthquakes run by USGS with very sparse stations. As such I think it is entirely possible, even likely, that these earthquakes came from Hunga Tonga Hunga Haapai.
There are two causes of errors in the USGS locations. One is caused by inaccurate measurements. These errors are mostly less than 10km. The other is the model of the shape of the earth that they are using. That can be off by 20 km in places, but it is repeatable (or systematic). So two earthquakes at the same place will still be plotted together, just at slightly the wrong place. Reykjanes earthquakes, for instance, are placed about 20 km northeast of their actual location by USGS.
This is one for our A level Physics students. Great stuff Albert! Thank you 🙂
The Afar Mantle Plume shows up well in density data of the mantle. The redder the arera the more molten and soft the rocks are where the Top of the mantle plume is melting by decompression melting
Is this activity that feeds Erta Ale
Why is Erta Ale so ridiculously small?
Probably because it is young, it would be really hard to accurately date in that area but it seems likely with its present rate of activity to be much less than 10,000 years old. Of course it also could be a lot older and just recently had a major phase of shield building that we are in the late stages of too,
That’s centred on the ethiopian rift at Nazet/Adama, volcanoes around but not that near arta ale which is close to the coast at the start of the rift.
My late wife went to the rift as a young girl and told me it was amazingly impressive with steep cliffs down from the cold plateau to banana and tropical fruit plantations at the bottom. They rode horses down, there being no other way in those days.
Sounds idyllic.
Looks like a pretty well formed plume
Its hot too, same composition as Hawaii and Fagradalshraun. But Afar already had its major thoelitic flood basalt 30 million years ago when the plume head surfaced. But There is lots of partial melting there.. I wonder If the Afar plume is capable of another round of flood basalts as the crust thinns and the astenosphere gets even shallower
Still its not even close to the monster mantle plumes that where behind the meozoic Pangea flood basalts, despite its Grand scale, African rift is very a small breakup
Had this plume been in an ocean with thin mafic litosphere crust You woud have had something thats similar to Galapagos in size and look. The Afar Plume is pretty powerful, and maybe be even more powerful than it seems, most of its strenght hidden below the continetal litosphere.
Down in Kenya – Virunga There is another massive plume dome .. but its having trouble with the cratons.. and is not as visible in activity, its feeding Lengai, Kilimanjaro and perhaps Nyiragongo and Nyiramuragira, althrough Virunga coud be a sepparate massive emerging plume head
Great African African Rift will probaly experience more true flood basalts in the future, the GAR probaly haves the largest potential at current for that on the planet. It will not be the size of CAMP But it coud be the size of Deccan Traps future events in the rift
Does anyone know why Hunga Tonga Hunga Ha-apai’s neighbouring Tofua volcano has just started showing yellow (unrest) state on Volcano Discovery?
Ttheres no information as too why and I’m wondering if it’s been noted by any official sources. Perhaps due to earthquake activity or SO2 detection?
I wonder if this was from a false detection by Meteorsat on the 16th?
In the last 15 years there have been a number of magnitude 8 + earthquakes in the vicinity of Tonga
That probably stirred things up a bit
https://www.space.com/tonga-volcano-eruption-damage-satellite-images (apologies if already posted) Some satellite pictures by Maxar Technologies of the before and after state at Tonga-Hunga Tonga-Haipai and the tsunami damage clearly visible.
The Daily Mail has some pictures from the Tonga region, the tsunami did more damage than first imagined. https://www.dailymail.co.uk/news/article-10416323/Tonga-tsunami-Photos-reveal-devastation-volcano-eruption-South-Pacific.html
Given the trauma and damage, the island is now perhaps 200mm higher and has a relatively fertile addition of soil. Long term this is a plus. The vegetation will soon return, not so sure about the marine ecosystem although that may be relatively unharmed.
Every cloud has a silver lining, sometimes.
Brand new discovery of concentric atmospheric waves see https://strangesounds.org/2022/01/tonga-volcano-eruption-creates-mysterious-and-puzzling-concentric-ripples-in-earths-atmosphere.html
That makes me think this was a supersonic injection of gas and water vapor into the upper atmosphere
Gigantic pulse of hot gas vertically
Apparently there are warnings that Ubinas in Peru is at risk of a collapse. One to watch for sure.
some two or three million cubic metres is not that much. The mount St. Helens sector collapse was about a thousand times more than that. Still, debris avalanches are nothing to mess with.
PS As I write the UK electricity is 60% fossil and 23% renewable so keep buying electric cars.
OK Night in winter not much wind, unfair I hear you say …. BUT…
PS This is not a troll, no comments expected, for information only.
I would argue that 23% at night under high pressure (no wind) is not bad.. but obviously open to improvement, much of which has to come from energy efficiency. The 23% (25% at this moment) includes 4% biomass and 2% hydro. The renewable electricity cost half of what the gas-powered electricity costs. But the price is set by the latter, for all of electricity. Wind farms get a fixed price per kWh, and this is far below the price at which it is resold to electricity companies. It is a funny market. It does make solar panels on your roof sound attractive, although in the UK in January they don’t do much.
We need to do at least double the renewables (and the biomass includes wood pellets) we do at the moment and fast. Basically because currently electricity is under half our total energy consumption. Currently (as I speak) PV is 1.1%, which is not zero. Solar seems to run from 0.4GW (weekly ave) to 2.5GW so its about 1/5 in winter.
I appear to be using (Nov) 750 kWh/month or 25/day (mostly computers, lighting and some towel rails). So I would need about a 150 kWh array (they are all rated summer rating) or about 15kW summer output. about 15 sq m for winter. I would need min 2 days battery storage or 50kWh which with a 10/90 discharge would be a 60kWh battery.
Assuming electricity prices rise to 35p/kWh my annual bill will be circa £3k and if the equipment is to pay back over 10 years thats £30k installed.
Is that a goer?
PS heating is separate.
PPS No, I have no idea why I am using so much. wifi metering plugs suggest washing etc is quite modest usage.
I am surprised you use that much. Any ideas?
The main problem is that renewables are too unstable. Net landbased windproduction of total varied from 0,37 GWh (0,67%) to ~50 GWh (~67% (per hour)) in Germany in December 2021. And it is not very unusual. Esp. in winter. When a high baseload is needed. In practic terms it is unregulable. And the german state revision says a meaningful percentage of storage is absolutely out of the question. So.
When they (still) are shutting down stable nuclear powersources based on the decision after Fukushima they needed to replace that with something else. First half of 2021 CO2-emissions from burning coal rose 38%. A “bad” year for wind contributed.
Looking at numbers from 2022 (they shut down 4 050 MW nuclear at new year) there is another steep rise in CO2 from electricity production (when the wind does not blow) so clearly the 1 440 MW increased capasity from Norway does too little. Norwegian export topped 0,14 TWh in the 24 hours of 21.12.21. With the highest prices seen in Nordpool to date. We have already seen close to those numbers daily in 2022. No capasityproblems due to low windproduction? Check out the dates with the highest prices and compare them to windproduction. It is a match. CO2-emissions from production has seen hours of 700+ g.CO2/Kwh… Never seen before in recent years. A green change? Well. No.
https://www.agora-energiewende.de/service/agorameter/chart/power_generation/01.12.2021/20.01.2022/today/
If you add to that that nat gas is to be relied upon from Russia? The warnings were many (UK PM Brown,2008 aso) and the person to thank that EU electricity prices are not hitting that price celing in Nordpool now is? “Beautiful clean coal, tremendous nat gas”. Ring a bell? Wo. LNG-ships in constant transit over the Atlantic right now europeans would basically be freezing AND paying an insane bill for it. Because the US decided to mainly continue to focus on stability in supply. And export.
A cold “snap” this winter in Europe with little wind will be dramatic. Just remember the price-roof in Nordpool; 30 Euro/MW. Plus taxes. And transport. And sure, it ill affect nat gas prices too.
This is failing. It does not matter how good the intentions were if “the beast from the east” makes a visit to most of Europe this winter too. In a midst of a electrification process. 1 mill. more EV’s in Europe to charge in cold weather compared to last winter? Less stabile el. production. A blackout would be devastating. Not saying it will happen, but it is 100% clear to me that the place to look for forward spotprice in the electricity market is in GFS/CFS+++ forecasts for wind and T. And THAT is not safe.
Atle D:
It really pees me off that the ever so green germans scrap workable nuclear plants and have to replace it by burning lignite.
AND the eco-warriors applaud!
Its why I gave up bothering about global warming in the 1980’s, whereas I was a keen proponent that we should seriously do something even then.
Its because for most people, its not about ‘saving the planet’ its about eco-politics which means doing politically correct things and d*mn the reality.
I have to agree with you. Nuclear has to be safe, of curse, decommissioning old plants is needed at some point. Bu doing away with nuclear causes far more problems than it solves. We cannot solve the crisis without nuclear energy. It has a role.
For info:
https://www.solar.sheffield.ac.uk/pvlive/
displays the UK PV output
mar-jul ~1.5TWh/month, dec-feb ~ 0.25TWh/month.
About a 6=fold difference.
So a personal user needs approx 6x max output to remain grid-free all year.
“Nuclear has to be safe, of curse”.
Freudian slip?
Albert, 23% overnight isn’t bad? I’m afraid I can’t resist bringing up electric cars; most people seem to charge those at home overnight. So, if you drastically increase your number of electric cars, you’re going to need a lot more base load capacity for the overnight hours. 🙂
No, it isn’t bad. It not yet good enough, of course. But you are talking mid winter (so energy use is high) and little wind (in winter most of the renewables come from wind. The UK produces more renewable energy in winter than in summer, to such an extent that the non-renewable part of our electricity is about constant (on average) through the year. (Not the total energy use, as this does not count gas heating.) For the future we will need to add a lot of capacity to our electricity network. That is true everywhere in the world. It is a major problem for China, for instance. The US will also require massive investment but that is the case for more of its infrastructure. In your case, electric cars do not seem to fit your requirements. They are easier to use in and around cities.
Cities should have a standard spec very small, max 30mph car with max 30 mile range and preferably hire them/subscribers.
All other vehicles except delivery trucks should be banned, including expensive, often empty, very polluting buses.
Albert, my suspicion is that that some of the politicians who are designing future grid specifications are rather deficient in the knowledge department, and may not even understand the difference between base load and peak load, or that the sun does not shine at night. They tend to make the classic mistake of assuming that a policy will achieve its desired results.
One example you’re probably familiar with comes to mind; the biomass scheme in the UK, which has had the effect of heating a vast number of vacant buildings at enormous cost to the taxpayer, while of course giving a major boost to CO2 output – a case of a policy and scheme achieving exactly the opposite of its goals.
https://en.wikipedia.org/wiki/Renewable_Heat_Incentive_scandal.
It’s things like this that make me disinclined to trust the claims by politicians that going full renewable on the grid won’t result in an unreliable grid. I’m not saying it will result in an unreliable grid, just that it needs to be looked at by people who actually know what they are doing. As a purely practical matter, there is no better way to undermine public support for renewable power than broken promises and failed schemes, and without public support, it won’t be happening.
As for electric cars, my only point is that, while they may be great for some people (I wholeheartedly agree regarding urban commuter use), they aren’t for everyone, not currently anyway. Kind of like volcanoes, really – I love volcanoes, but I’d be a might unhappy and prone to argue if someone was trying to force me to have one in my garage. 🙂
There is a difference between design, implementation and policy. The renewable heat incentive in Northern Ireland was a potentially good policy. The implementation turned it into an expensive failure. Politicians set the policy. Design and implementation is done by civil servants, under guidance from the politicians, and is normally outsourced. There are three causes why things go badly wrong. One is if politicians set policy based on popularity. That rarely works, and is the reason why populism often brings its own downfall – it cannot deliver. The second cause if politicians are given the wrong requirements. That is not so common: there are a lot of checks in the system, but it can happen . The third is if the implementation is hijacked. That is very common. The people in charge of the implementation can do so to the benefit of a third party, sometimes the politician, more often a company. There are many varieties, but these are the basic patterns. At one extreme there is state capture, as happened in South Africa. At the other extreme is political paralysis where no policy can be implemented. Volcanoes, of course, don’t care. They do what they want
EV is still a more efficient and better use of that energy than using an ICE car. At least, coal power stations run at the near theoretical max efficiency and are not placed in the middle of cities, you cant get max efficiency in an engine small enough to fit on a car, and then putting that through a bunch of moving metal parts you lose about half of that to friction, its like a rube goldberg machine just to make the wheels move.
I know you probably wont listen to me because you think I pull my numbers out of my ass but I expect Carl will have something to say on this too, ICE cars were supposed to be a step into the future of transportation to make it available to the masses while a better battery tech was found, just that took a lot longer than anyone thought in the early 1900s (probably having 2 world wars didnt help). Now it is here there is no real excuse.
Coal fired typ ~35% eff, gas ~43% eff modern diesels high 40%. Its all to do with the laws of thermodynamics that means the operating temperature of electrical systems is modest 300-800C but a bang in a cylinder is ~1500C. Actually the diesel is nowhere near its theoretical efficiency level.
Anyway we simply do not have remotely the electrical infrastructure to make massive use of electric cars.
Near here they are building a medium housing estate. It was all supposed to have heat pump heating. This has had to be dropped for gas because the electricity supply company cannot offer enough infrastructure without massive charges to the developer.
Its just the way it is. Given plenty of properly priced electricity and a well organised battery renovation system EV is the choice of course. I agree. Completely.
BUT right now we should not delude ourselves that it is.
Diesel generators are 40% efficient if they are the size of the whole car and run at constant presumably carefully calibrated speed, none of which apply to the engines they actually put into cars and especially not when coupled with a mechanical transmission, it is why diesel trains are actually electric drivetrain, the power variation is controlled by electric systems while the generator is constant. The only way to get that 40% efficiency into a car would be to make it a performance hybrid with full electric drive at all speeds, and the engine as a base load power source, as is done in trains.
I dont think gas turbines should be counted for this purpose at all, given they are massive structures that take up whole buildings. Combustion engines work better at really large scale and if left running, putting them in a car is very much not optimal, and anything smaller like a bike is looking at single digit efficiency regarding motion, although they do get high 90% sonic emissions, which is apparently desirable to some people 🙂
No real excuse? I’m in a nitpicky and quibbley mood, so I’ll give you five; 🙂
I’m currently thinking of replacing two SUVs and a sedan. Here’s what I ran into;
#1, electric vehicles need charging, so you need charging infrastructure. Here in the USA, it’s rather sparse (to put it charitably) in rural areas not near major highways. I live in such an area, plus go to similar areas a lot.
#2, charging takes longer than filling up a gas tank. Often, a lot longer, if there’s not a vacant charging bay. I travel around the USA and Canada a lot by SUV, and having to stop for half hour charging on long highway runs would not be okay with me.
#3, Electric vehicles tend to be a lot heavier. There are (so far as I know) a very limited selection of high-clearance 4×4 electric vehicles that can take large offroad-capable tires. Carl mentioned one (the only one I know of), Rivian. A very capable 4×4 pickup. It, however, has a huge problem; it weighs 7000 pounds!. In mud or sand, that’d be a great way to get stuck. I have enough trouble with one of my SUVs that weighs about half that (It bogs down in conditions that the lighter one handles with ease).
#4; For cars rather than SUVs, electric cars don’t seem to come with a full size spare, and worse, don’t have a full size wheel well. Heck, Tesla cheaps out even more; no spare at all, and no jack! Good grief, even the old Yugo, a very cheap basic car, had a spare, and they can’t put one in a 100k car?!
#5, The connected crap. It’s darn hard to find any new car without that junk, and I won’t even consider having one with it. With some new ICE cars, you can rip it out. With the electrics I’ve looked at, ripping it out is a much more complicated job. I’m not a fan of either option, so unless this changes (or I find something acceptable) I’m sticking with my old gas hogs and doing a rebuild on them (or buying used ones as replacements… I’m not sure yet).
I think you might be surprised about charging in the next few years, both advancements in speed and also availability. There will also probably be inverse surprises about the availability and cost of petrol in the same timeframe too, after all it is only there because it is someones job to put it there, and if it costs too much to employ that role suddenly it will be ICE cars that will give you range anxiety. That wont just happen, would be chaos, but for sure will be phased out.
EVs also require way less maintainence, like it is ridiculous. Even the battery will last at least 300,000 km before it is going to be a problem, the motors are already solidly rated for 1 million miles, and new generation batteries are built to last a similar length of time, just have not existed long enough to be able to test that yet.
I would have thought the idea of stopping somewhere for half an hour on a road trip would be one of welcome relief, not a negative. Maybe you have a bladder of steel 🙂 but I think most people would be thrilled to stop and charge by the time they have driven enough to actually need it.
A key component of the discussion as I see it is that there are uses where EVs are superior and uses where diesel/gas will remain dominant for some time. I’m familiar with your situation, often leading scouts out in the woods for days where the vehicle will be left in cold temps and where the nearest civilization is nearly an hour drive away. I want the certainty of an ICE at that time. For my commute in town, though, the EVs are more convenient and a hell of a lot of fun to drive.
Not every vehicle has to fill every purpose.
Well writ on the advocacy for ICE powered vehicles.
Regarding #5: When you refer to “connected crap”, do you mean navigation systems? Developing and exercising a sense of direction, and not being afraid of occasionally getting lost, is one of life’s simple pleasures. Do they still make cars which are not “connected”? Here’s your chance to exploit a new market..
I agree, Chad, that I’ll probably be surprised by increased charging speed in the next few years, though that’s actually a great argument for not buying electric right now; better to hold off on purchasing until that happens. 🙂
The problem I have with the half-hour charging times isn’t just having to hang around for half an hour, but far more than that. If there are 3 cars ahead of me at the gas pump, I’m looking at maybe 10 minutes wait in total. If there are three ahead of me at the electric charging lineup, I’m looking at around 2 hours. I’ve never paid much attention before, but lately I’ve looked over at the electric charging stands on the rare occasions I’m within sight of them, and they often do have lineups. (That’s a very, very small sample size, just a few at truck stops in Arizona and Utah, so of course, take it with a huge grain of salt). My biggest issue though is that there very often aren’t charging stations along the routes I drive (I prefer to avoid highways). Just as in Australia, it’s quite common for the next gas station to be over a hundred miles ahead (in some cases, a lot more), and in such areas, you just aren’t going to find an electric charging station (or if you do, it’ll be a very busy one).
@ Jazz-Chi, agreed; not every vehicle has to fit every purpose. That’s why I, a single guy, have 3 vehicles. They each serve different roles. My sedan, for example, is fun to drive, but it’s mothballed in winter because it does not have 4 wheel drive, and the road to my house turns to mud. If I did a daily commute within an EV’s range, plus lived on pavement, and I could find a basic one (No connected stuff, or at least removable) I’d be quite interested in having one as a second vehicle, and using it for the commute. My only point is that EV;s, currently anyway, aren’t for everyone.
Maybe it is a product of my age (early 20s) but I will never understand why there is even any argument to keep fossil fuels in the system long term, there is really no good reason. I do mean what I just said too, energy storage can be covered by green hydrogen or battery storage (there is way more to batteries than just Li-Ion too), transport can be EVs and hydrogen. Planes will be harder, though using ammonia fuel cells could be an option (better gravimetric energy density than LH2 and way easier to store)
With all due respect it seems most of you are all older, not seeing the future implications because it will not be personal. Sometimes I wonder if maybe the world today moves too fast for the wisdom of age to be a judgement of authority, particularly regarding politics, maybe the world now would do better to have the world leaders be in their 30s instead of 50s-60s.
It is a combination of conservatism of the older (the world of the future would be much better if it were like the world of the past. Our memory tends to forget the bad things), and of realism – it takes a long time to change the world. We do need to make sure that people do not see their standard of living drop, otherwise support for renewable energy will quickly evaporate. Don’t move faster than you can get away with. As for electric cars, a lot of the resistance is conservatism, some is realism. In ten years time, we will wonder what all the fuzz was about – if we get the basics right. As people have said they are actually better to drive and easier to maintain.
…..and what do you foresee as the timeline for the evolution of these technologies such that they are on stream and functional. Will your thirty-something visionaries be grandparents or great-grands by then? At present, the reality of green generated electric power in volume sufficient to satify the voracious appetites of the ‘gadget set’ does not apear to be readily forthcoming.
Edited by admin to keep the discussion on energy rather than politics
“not every vehicle has to fit every purpose. That’s why I, a single guy, have 3 vehicles … My sedan, for example, is fun to drive, but it’s mothballed in winter because it does not have 4 wheel drive,”
Oh boy. A single person and you have three different vehicles. One of which is clearly for the purpose of fun primarily and possibly only for that purpose. Sorry to say that that will not be acceptable in the future. I’m not talking about that being banned, but it not being socially acceptable. Heck the way the United States is going at the moment it might not actually be affordable!
Now there are, of course, strong arguments against banning something simply because the person wanting the ban does not like it. However there is a point where it simply becomes self-indulgent extravagance. I suspect that what is considered the threshhold for self-indulgent extravagance will become smaller when it comes to things like vehicles in the future.
You’re likely not someone who preaches environmentalism and them flies around in a private jet or something equivalent. So I’m certainly not accusing you of hypocrisy or anything like that. What I am saying is that the rampant consumerism which America in particular takes to the nth degree has a strong chance of becoming something with very strong social stigmas attached to it over the next few decades.
There are an awful lot of rich hypocrites in the United States who deserve a serious dose of reality in many areas. Their environmental wastefulness is just one. An awful lot of those hypocrites inhabit places like Hollywood. The trouble is that their deserved dose of reality is going to have a lot of splash damage hitting the rest of us.
The main problem is this has been pushed way too fast. I follow commodityprices and it is obvious by now the prices for raw materials needed are rising much much faster than both anticipated and for what would be a organic correct increase in electrification.
It think Toyota was right; For (one) 100% reduction of emissions they need to produce three cars (Cambridge-study of Toyota’s colllected data last 10 yrs). Maybe less in 2022. But they only need ~4,2 KWh batteries @ 212V to do it. One normal EV needs 50-100 KWh @ 400-800V to do the same. And that is depending on energy-mix… Toyota’s (middle-way) solutions requires zero infrastructure. What gives the best net (and least risk) over a 18-20 year lifespan? For the society.
I say this happened too fast.
Héctor,
you might know this, if not, you’ll probably like it. About the characteristics of seismicity in the area. Interesting for all who want to read about this, so many here:
https://academic.oup.com/gji/article/196/3/1657/582814
Hunga Ha’apai 3.2
Lots of good bathymetric pics and good graphs.
https://academic.oup.com/view-large/figure/9406891/ggt472fig4c.tiff
Why I think the eruption is almost certainly a VEI 5 and even possibly a VEI 6, and some details of the eruption gleaned from infrared satellite data……Note: all times are local Tongan times and refer to events on Saturday Jan 15.
The eruption’s umbrella cloud or anvil had a tall central fountain or overshoot that featured cloud top temperatures colder than -70 C at 5:10 pm, 5:20 pm and 5:30 pm. At 5:40 pm the cold central overshoot had disappeared or greatly diminished, but at 5:50 pm it was back again. The overshoot had disappeared again at 6:00 pm but was back a third time at 6:10 pm. After that, energetic rings of alternate cold and warmer cloud tops continued to emanate from the volcano, but with no central overshoot colder than -70 C until about 7:30 pm when the anvil top became smoother. Just before 9:00 pm the concentric rings of cold and warmer cloud tops started to radiate from the volcano again after almost 1.5 hours of relative quiet. At 9:20 pm the cold central overshoot reappeared for the 4th time that night, with temperatures colder than -60 C cooling further to -80 C at 9:30 pm and 9:40 pm. At 9:50 pm the cold central overshoot disappeared for the final time and the generation of those concentric rings from the volcano seemed to stop for good.
It seems that vigorous eruptive activity lasted for almost 5 hours, but with about 1.5 hours of relative quiet from about 7:30 pm until 9:00 pm. The most intense activity, including the generation of the tsunami and loud shock waves seems to have occurred in the first 30 minutes or so, but I wonder if later activity may have generated less atmospheric effects due to the vents being progressively further submerged under water. Possibly, the later activity continued to feature intense venting.
Based on the growth of the umbrella cloud, I estimate that the eruption rate averaged over the first 30 minutes may have been 10^9 – 3*10^9 kg/s. That could produce ~2* 10^12 kg to ~5*10^12 kg of tephra in 30 minutes. That would correspond to an eruption magnitude of 5.3 – 5.7…..a mid sized VEI 5. If a lot more was erupted during the several hours after that, even if much of that was under water, it is conceivable to me that the eruption may have reached VEI 6 with 10^13 kg of total eruptive mass. The only way that we are likely to be able to estimate the erupted mass with more confidence would be a bathymetric survey to estimated the volume of caldera collapse, and or a measurment of the apron of submarine pyroclastic debris that is probably deposited largely around the base of the stratocone at 1000 – 2000 metres depth, and possibly in the caldera itself.
If there was caldera collapse…(and there probable was) with a volume as large as 4 km^3, displacing magma with a density of 2,500 kg/m^3, that would indicate a total erupted mass as large as 10^13 kg with a DRE of 4 km^3. Such a volume could be accommodated with a 3 * 4 km caldera having an average subsidence of greater than about 530 metres. Such a caldera would extend S and include all of the southern shoal areas along its greater axis. The caldera, if present, could be partially filled with intra-caldera tuff, complicating estimates of collapse depth.
As for the submarine deposits, with a density of 1500 kg/m^3 a submarine deposit volume of 7 km^3 or more would warrant an assignment of VEI 6 as erupted mass would be greater then 10^13 kg. At this point, it is almost inconceivable to me that this eruption could have involved less that 10^12 kg of erupted mass. Therefore a VEI value as low as 4 seems vary unlikely to me. Still, we will have to wait for the data to come in…..as it hopefully will. Any comments would be greatly appreciated.
I will explain to you why I don’t love high estimates (better wait for volumes):
It has no consequence for poor people. But the main consequence for shop- and hotel-owners – therefore also for Nea Zealanders and Australians who spend their vacation there – is that the insurance rates would go up, for some that might be desastrous.
As I owe to locals having spent lots of nice vacations in places with great local people and would like to go on with that without having to stay in a cheap airport hostel I would never do a high estimate without evidence.
I can also see what is happening on one neighbouring island of Big Island: People moved away, maybe partly for a reason like that, not being able to manage any more. Now it is the habitat of several bigshots. Right next to the coast, no problem for them.
Thank God, this is a small site. People wanting for a 6 don’t know what they are doing to locals. And to themselves if they ever want to travel there.
It helps thinking of car accidents.
Had not really thought about that. Do you really think that tourists react that differently based on the size of an eruption ? As for insurance, wouldn’t a provider try to say that the eruption was NOT very big ?
Extraordinary announcements require extraordinary evidence
<>
https://twitter.com/kositski/status/1483134553606823937
Out of reach for me
https://t.co/kLP1GYjHD7
https://hal-ensta-bretagne.archives-ouvertes.fr/hal-01714103/document
read
Took some barometric pressure data from following the Tonga eruption and fitted it with TNT blast data. Based on the data I’m getting about 2 to 6 GigaTon of TNT.
I think he is a factor of 100 to 1000 off. Perhaps forgot about the curvature of the earth?
I don’t know, it seems excessive to me, people at 60/70km have survived.
There are really a lot of factors and to generalise from one factor each time is probably nonsense.
It’s found from here.
https://twitter.com/altNOAA/status/1482674118822608898
There’s only 5 data points from the eruption on that graph. I would want more than that to draw any significant conclusion from this.
Not accurate for an atmospheric gravity wave-type disturbance like this was. He used data for shockwaves (shock overpressure), which are different and lose their power much faster. As an example, Tsar Bomba registered as 1.5 mbar at 6000 km, as a barometric disturbance.
Thanks for the information!
Albert, Carl, yes, treating the disturbance simply as a shock at large distance will yield an overestimate. On the other hand, what the other Carl here did, and what Yokoyama did for Krakatao, caclulating the gas volume that needs to be expanded in the atmosphere for the pressure difference measured, seems a conservative and solid approach to me. For Krakatao, that required 33MT TNT (for the pressure wave alone). Like Tsar Bomba, it was about 1.5mbar at 6000km. Given that a 50MT Teller-Ulam bomb will have huge thermal losses (and a lot of that “uselessly” to space), both numbers seem to match quite well. From that somehow naturally follows that the 10MT that were quoted as “NASA scientists” verdict on the total energy for the HTHH blast would be dubious. How would one initiate a pressure wave that was measured at 2+mbar near the antipodal point within that budget?
There seems to be data points on that graph from about 0.4 – 60 GT of TNT….but how ? no one has ever exploded anything that big. Is it possible that the scale is off by 10^3 ? If so the largest datapoint would be around 60 MT. That would match very closely with Tsar Bomba.
I didn’t think of it this morning, the explosion was confined to the atmosphere, so less than 240MT.
The source is lost in my library.
In French, a word from the CEA (NPT watchdog) on the event.
http://www-dase.cea.fr/actu/dossiers_scientifiques/2022-01-15/index.html
By studying some events of the past with some reports by also whalers (most often mentioned: a few days of darkness) I am getting to the conclusion that an event like this is nothing unusual in the area. Here is a fine assessment of legends, tied to some scientific evidence, Simkin is mentioned:
MYTHS, LEGENDS AND VOLCANIC ACTIVITY: AN EXAMPLE FROM NORTHERN TONGA.
PAUL W TAYLOR Australian Volcanological Investigations
http://www.jps.auckland.ac.nz/document/Volume_104_1995/Volume_104%2C_No._3/Myths%2C_legends_and_volcanic_activity%3A_An_example_from_northern_Tonga%2C_by_Paul_W._Taylor%2C_p_323-346/p1
I like this investigation very much. It also nicely explains where the Hawai’ian legends came from as it happens to be the same people. Bad guys: Many, some unknown. Among them:
(meaning many new coconuts):
From Taylor paper:
“The prevailing wind patterns at the time of the 1886 eruption of Niuafo’ou influenced the dispersal of the tephra that was injected into the troposphere (Taylor 1991:48). Thus, during a small scale explosive eruption, ejection of tephra to heights below the trade wind shear zone would be expected, and this tephra would be dispersed along a westerly dispersal axis. However, in the case of a moderate to large scale explosive eruption, ejection of tephra into the upper troposphere (3-19 km in the dry season; and 3-17 km in the wet season) could be expected with the dispersal axis being orientated in an easterly or south-easterly direction.The prevailing wind patterns at the time of the 1886 eruption of Niuafo’ou influenced the dispersal of the tephra that was injected into the troposphere (Taylor 1991:48). Thus, during a small scale explosive eruption, ejection of tephra to heights below the trade wind shear zone would be expected, and this tephra would be dispersed along a westerly dispersal axis. However, in the case of a moderate to large scale explosive eruption, ejection of tephra into the upper troposphere (3-19 km in the dry season; and 3-17 km in the wet season) could be expected with the dispersal axis being orientated in an easterly or south-easterly direction.”
This might come close to what happend on Hunga. Classified as a 4, but this is a different kind of classification.
From some local legends and reports in logbooks of whalers and trade ships it can clearly be seen that the region is busy with volcanism, also more violent volcanism. As it is remote there is only legend plus reconstructing with analysis of tephra.
There seem to be numerous earthquakes north and south of the collision zone of the Louisville Seamount Chain with the Tonga-Kermadec Trench which is not as deep at the collision point whereas the adjoining arc is higher than the surroundings. There is massive faulting and deformation , blocks from the subduted and subducting seamounts and an aseismic zone in between very seismic zones north and south of the traffic accident 🙂
It is very easy for a volcanic plume to get up into the upper troposphere, especially in the tropics. It does not take a very big eruption to get to a height of 3-19 km. Plumes in the area seem to get to heights like those every year.
3-17 is ridiculous as a measurement.
Fix point:
Soufrière St. Vincent 26.000 feet.
VEI 4. Contributing to this is a longer effusive period before with the construction of a lava dome and a longer explosive period.
So, a comparison is hardly possible.
A comparison with ships 500 miles away, covered by ashes from Nofulei is nice though. Therefore, to give some company to the guy with the British flag and also put some suspence into this I do an estimate of 4, based on volume minus water. Daring. And possibly wrong. So what.
The Louisville Chain volcanoes, that’s to say their subduction, is assumed to have (had) considerable consequences as for instance rifting and the creation of microplates, seen here:
Here then is a bathymetric image of the Lau-Basin and the rifting in it:
In one source that I am unable to find right now, the authors decribed rock material on Tafahi which could have its origin in the mantle (subducted seamounts, mantle plume now about 4000 km away in the South-East).
Tafahi is about 500 km north of Hunga. So where Tonga (the main island) and Hunga are there is pressure from two sides, the north and the east.
Good paper, understandable too:
https://www.frontiersin.org/articles/10.3389/feart.2021.665185/full
Niuafo’ou is an interesting volcano, basically a ring shape.
Can see the lava flows clearly from the eruptions in the 1920-1940s, seems to be very fluid, pahoehoe sheet flows and curtains of fire, would have been quite a sight to see. 1943 eruption lasted longer and made a perched channel and littoral cones too. It also shows very well that effusive eruptions driven by pressure dont really interact with the ocean very much, because one of the fissure lines goes right to the shore and there is nothing.
The eruption in 1886 might not have been effusive though.
The eruption of Fonulei in 1846 certainly was not, as ships 500-600 miles to the North-East were showered with ashes (Findlay 1871).
All I’m saying is that this eruption doesn’t seem to be unusual for the area, but only on a geological time scale.
For us it was highly unusual as we don’t see so much of it.
If you go one picture down to Fonulei, Chad, you might get the impression that ring shape and caldera is gold standard on that island arc.
Not sure I would count Niuafo’ou as an arc volcano, it is related but more of a back arc rift volcano. Seems it is a Galapagos-type shield, just mostly submerged.
More what I was getting at is that effusive eruptions with low fountaining that are driven by pressure, seem to stay effusive even near water. Eruptions with more gas will see tall fountains and that will become surtseyan in water. If the vent loses pressure water can also intrude into it. If a hydrothermal system is allowed to depressurize it will explode, probably the biggest bangs are from this effect but where the hydrothermal system is in direct contact with magma, so effectively water at magmatic temperature. It seems the amount of actual magma erupted in the event is not necessarily important, whether it be 20 km3 as at Krakatau, or 2 km3 as at Hunga Tonga Hunga Ha’apai, because the energy isn’t coming from the gas in the magma but the heat it contains. If 1 km3 of water was vaporized to do this, then in theory you only need 0.3 km3 of basalt to get enough heat to go Krakatau.
This eruption might have been a true turning point in volcanology, that we will look back at in 100 years.
“what I was getting at is that effusive eruptions with low fountaining that are driven by pressure, seem to stay effusive even near water.”
Yes, Cumbre Vieja, Fagra.
And this must du be due to the fact that the water didn’t invade the magma chamber first like is the case here.
1886 explosive btw. whole island of Niuafo’ou covered by tephra, thickness between 10 cm and 6m, Chad.
So, different forms of eruptions.
This is a very nice picture of a setting which exists, but they don’t tell. They call it Volcano F which gets me to Fonulei, also around 50 km north of Tonga’s main island.
Could be – must not though – that Fonulei is their supect. Fonulei erupted in 1846 and is, according to Siebert, classified as a 4, rightly with a question mark, as it is difficult to estimate volumes in the past in an oceanic setting.
The piece itself is about “floating stones”, pumice and is therefore interesting in this context:
https://www.geomar.de/en/news/article/volcano-f-is-the-origin-of-the-floating-stones
Volcano F and Fonualei are different volcanoes.
Location can be seen here:
Thanks very much.
It’s quite confusing. Some Tonga-Kermadec volcanoes have proper names but others are referred to as numbers or letters, and there are a couple of them that have never been referred to by any of these, I find it quite difficult too to know which volcano is which.
So Carl,
with those two links and the text I wrote I might get back to your offer in a few months or so, when we have more data, and write a frame for them, so a whole article if you then still want it, and I will even mention the Louisville chain and its plume 🙂
I have an idea for a post at least, and in case Albert is willing to correct it which certainly will be necessary in parts, i will try it. It will be more about the geological setting.
https://twitter.com/jfgino/status/1484113610427310080
Video of tonga devastation
What resilient palm trees. Evolutionary adaptation to tropical storms, perhaps.
While IO s volcanoes are larger and hotter and more violent than Earths, is IO capable of VEI 8 flood basalts? It sourely haves the melt generation in its mantle
Sillicate lava flows on IO are rapidly snowed over by Sulfur snow that comes from as the sulfur gas freeze out from the basaltic fountaining, so hard to see earlier big lava flows
Lei Kung Fluctus is the largest recent lava flow on IO and in the solar system, But its a slow compound pahoehoe flow and not a venusian or marsian style lava flood
Regarding the fuel-coolant interaction suggested earlier by some VC readers:
Found a paper, haven’t had the time to even skim over it though: https://agupubs.onlinelibrary.wiley.com/doi/pdf/10.1029/96JB02935
I find the idea appealing and very interesting.
Not today, saved it though. Thank you.
Its would be very wise to avoid scaling an experiment done on the cm scale, for one in the km scale.
This is why asteroid impacts are simply not scaled up copies of a rifle bullet impact.
Scaling physical systems is not at all straightforward, indeed typically behave very differently as scales change significantly.
That is a good point for sure. If I see their setup, it might be a funny thing to try on July 4, but one can be skeptical whether this would be possible to happen in large scale, as in Hunga Tonga.
Still, I like how they get a shock wave 1.6 m away with a comparably simple process, that doesn’t involve any combustion.
Do we actually know for certain whether this was a phreatic or really a phreatomagmatic detonation?
The latter being the most violent type according to Zimanowski et al (1997).
Based on Nofolei with ash 500 miles away, and on Mount Pelée, the killer of St. Pierre (phreatomagmatic), both VEI 4, I cannot give this more than a 4. In one single company so far, and risking to be wrong. Will take time though to prove me wrong. The tsunami was also worse on Martinique.
Estimate based on comparison.
For this 4 the volume needs to be – as Albert explained – > 0.1 km3. Up to > 1 km3 would be 5, Albert’s estimate based on calculation which is also based on one estimation though: Depth.
The explosion itsself is estimated at 10 Megatons by NASA.
The volume underneath is estimated to have grown by a factor of 1.700 by the entry of water. There was extreme rilling.
Thes two are quite useful:
1. From one of the dungeon masters
https://www.volcanocafe.org/taal-in-water/
2. From the viking (impressive)
https://www.volcanocafe.org/taal-in-water/
Meant this:
https://www.volcanocafe.org/the-water-volcano-the-new-decade-volcano-program/
It’s about Kelud and the tunnels Indonesia constructed to give way to the water
You do you, Denali. I only took exception to the manner in which another user presented their opinion.
To me it was dismissive and condescending, that’s my perception / perspective. Not backed up by any logic or data. At least you’re doing that here, and more power to you.
I don’t get involved in trying to estimate the size of an eruption because I am not an expert. It is certainly fun to speculate and theorize, but when someone with experience and knowledge superior to that of my own (Albert) applies his scientific training to the problem and comes up with a solution based upon physics and math, I’m not inclined to doubt that. Does that mean his correct? Absolutely not. This may be the most disputed eruption in terms of VEI and volume in modern history, and I’m sure lots of people will be adding their own analysis to the debate.
With that said, my own opinion is that a 4 seems unlikely accounting for the material that was blasted out of the island. If that counts as part of the VEI rating, as it appears to in all other eruptions I’ve researched (many being calculated in part by tephra and in part by material excavated out of the caldera), I’d be very surprised we’re talking <1km^3. Wholly unscientific, so I defer to the those with the scientific training to make a better estimation.
Cronin, NZ vulcanologist ob UK radio 4
https://www.bbc.co.uk/programmes/m0013hjr
download
https://open.live.bbc.co.uk/mediaselector/6/redir/version/2.0/mediaset/audio-nondrm-download-low/proto/https/vpid/p0bjd6wy.mp3
Albert, thank you for that quick second, and updated description of the events that took place.
I particularly liked the comprehensive explanations all around the shock wave physics, along with the educational videos. (And I like BackyardScientist for his video on making the rubber band whip, yet another supersonic effect =D, and it’s so fun too <3 )
How does the curvature of the earth come into play with the tsunami height on Alaska or the reduction of it, for that matter? Didn't know such an effect, maybe someone can point me to the physical law behind?
Are there good papers or websites on the tropospheric ducting of sound? Vast majority I could find were about ducting of EM signals…
The strength of the tsunami in open ocean decreases as 1 over the distance. That is because it is distributed over the circumference of a circle which is 2 pi r, and the total energy is pretty much maintained. But once you are far enough away, the circumference becomes less than this, and once you 10,000 km away the circumference actually declines again because of the curvature of the earth. So at large distance, the tsunami is stronger than you would expect. In theory, it could get very strong at the antipodal point but no ocean gets that far. The same also applied to the air pressure wave, and there you do get this strengthening at large distances. That is also the reason the pressure wave lasts so long. These long pressure waves dissipate little energy because they don’t interact much with the ground
Aaaaa wheeeew never calculated something you had to take the earth’s curvature into mind (ok except Pythagoras law to calculate horizon distance), to reduce uncertainties.
I can exactly understand your point now, thank you for pointing out!
8th pass of the shockwave detected in Miami!
https://twitter.com/BMcNoldy/status/1484227033051844620
https://twitter.com/SquigglyVolcano/status/1484220091814363144
The eruption’s ash plume got to a maximum height of 55km, which is in the *mesosphere*, above the stratosphere and troposphere. Never before seen in the satellite era, and it means the erupted material was ascending close to the speed of sound!
WOW!
A similar tweet:
https://twitter.com/simon_sat/status/1484123252293353475/photo/1
Data mostly agrees that the most of the plume reached to 35 km. However there are also some suggestions that the central overshoot of the plume made it to 40-55 km. This would have probably been very variable with time, and such heights would have been achieved very locally, at the centre of the plume.
Did I not say a vertical projection at faster than sound
Hence the sonic boom
Probably gas mixed with some ash
Hence no column collapse
Yes, of course, that’s what caused the sudden gun-like crack, supersonic delivery of steam and ash from the mortar that is the volcano.
As carl noted from the Tonga phone clip just before the crack they had their breath knocked out by the main pressure/shock wave. That was a relatively low frequency pulse (which would have been stronger at altitude).
I can readily see a supersonic rising column punching through earlier (and now subsonic) outer ash/steam coats producing later bangs.
I think the physics is now starting to simply and easily explain what happened.
Just need the magnitudes.
Wow and skies up there are completely black too even in daylight
Air pressure is only 1/1000 th of Earths surface there or less
I have difficulties accepting anything above 35 km, but 55 km seems just a few steps too far.
mjf will be with me in this rather likely.
Didn’t buy into the 48 km too.
As Albert cautioned, there needs to be exceptional good data to prove such a figure, how much more necessity is in proving 55 km….
Sure, sounds hard to believe for a volcano! But as far as I see, this is a geometric argument, so probably in absence of mistakes should be discussed seriously. The “Tsar Bomba” cloud is said to have peaked at >60km. And that was a mere 50MT in total energy. Sure, even sharper energy release, and most important, the cloud from a nuclear air burst is very hot and light. No direct comparison. Just saying given a sufficient energy release, clouds can reach mesospheric altitudes…
2022-01-20 20:05:30.0
38min ago
20.35 S 175.38 W 10 4.8 TONGA
Actually 5 earthquakes above 4 in the last day, which means there is still considerable activity.
It’s looking more and more likely people in Alaska really did hear something:
https://twitter.com/NWSAlaska/status/1482431322740060162?s=20
Which makes NASA’s revision down to 6MT/TNT pure puppy poo, there has to be political reasons for doing so. Krakatoa’s eruption was heard at least 3000 miles (4800km) away and had an explosive force equivalent of 150MT/TNT. Yet Hunga Tonga was heard 6000 miles away (9600km) and only had a fraction of the energy input?
Sound dissipates very quickly; it is why musicians don’t like playing outside, you have to put in more energy to get a fuller sound, compared to playing in a Cathedral with lovely acoustics.
I think it is possible to calculate the tonnage ourselves using the power law frequency dependent acoustic attenuation formula. Calculating the power from TNT equivalences.
Pressure wave alone for Krakatoa was ~30MT TNT. But, even irrelevant. I would like to see a revised calculation that demonstrates production of a ~300km cloud umbrella, a transoceanic tsunami, and ~2mbar pressure difference at the antipodal point within an energy budget of 6 or 10 MT TNT.
You have to turn your dialectic around: If Krakatau was really heard at a distance of 3000 km and was a VEI 6 with – what you say – 150 Megatons TNT equivalent, this volcano wasn’t heard in Alaska.
It would have been heard in Guam and Hawai’i for sure.
And if NASA scaled it down to 6 Megatons TNT eqiivalent it might have been 6.
I think it’s kind of strange when people put the Twitter folks acoustic impressions above NASA. It makes me think whether those folks should send devices into Space instead.
Tambora with a VEI 7 is said to have been heard at a distance of 2.600 km.
But what is more important is the death of at least 70.000 people, some estimates are around 100.000. Due to population increase in Indonesia that would correspond to 8 million today.
Tambora’s column is said to have reached a height of 44km.
VEI is irrelevant for the question how strong the pressure wave was. A 1km asteroid impacting in a deep ocean will excavate the equivalent of a VEI 1 maybe, but the bang will be heard probably over continents.
I have problems with the 6MT TNT, as I do not understand how so little energy could even produce such a shock. And I am not the only one. “NASA said” is not at all a scientific argument 😉
The official NASA page about the Hunga Tonga eruption doesn’t mention anything about energy levels, but has a nice collection of satellite images and data (most of which have been discussed here already).
https://earthobservatory.nasa.gov/images/149347/hunga-tonga-hunga-haapai-erupts
However, the CALIPSO (Cloud-Aerosol Lidar and Infrared Pathfinder Satellite Observations) graph on the volcanic plume height was nice to see.
They also have a link to prior pages on Hunga Tonga over the years, which gives a nice way to quickly look at the development over the years…
As you said yourself, vei does not correlate AT ALL with how any energy is partitioned between air (pressure) air (lift) and total mass erupted.
As far as I can see the only viable explanation that also fits what is observed is that a large mass of very hot supercritical wet rubble from previous eruptions was heated by (probably many but small) sills until such time as the surface also became unstable. Once there was enough activity to remover overburden and thus the pressure restraining the supercritical water iy basically pretty well all vapourised at once, from a depth of 1-2km and was fired like a gun barrel up into the air with significant force.
This explains pretty well everything including the low SO2 content which suggests there was little fresh magma despite the huge energy release.
The acoustic diagram is from David Fee of the Alaska Volcano Observatory. It was recorded by the ALC’s infrasound recorders. This was a sound that was recorded and documented. I think that is somewhat beyond reproach. It is showing that there was a sound above 20 Hz at around 50 – 60 dB. A low rumble that lasted about 30 minutes. It gets progressively louder the farther down you go in frequency.
The NWS notes that it wasn’t heard in Hawai’i and speculates, as Albert does in his article, that atmospheric channeling or bouncing was responsible for missing Hawai’i and reaching Alaska.
The normal human hearing is general around the 0-120db. This is a logarithmic scale 10db is 10 times louder than near silence and 20db is 100 times louder… Hearing Krakatoa from 3000miles would have been with 0-120db, I suspect at 3000 miles (notwithstanding the atmospheric bouncing), that we are talking the extremity of audible sound.
Notwithstanding atmospheric and acoustic conditions, it seems silly to expect to us to believe that only 4% of the TNT required to take a sound 3000miles can take an audible sound 6000miles.
Energy can neither be created nor destroyed, it is transferred from one means to another.
https://pubmed.ncbi.nlm.nih.gov/17770304/
Tambora was not as explosive as Krakatau or Hunga Tonga Hunga Ha’apai, it erupted a lot of magma but there was not a single massive explosion of 800+ megatons like is thrown around, that is cumulative total energy. I doubt any entirely magmatic eruption of any scale can be as violent as what we just saw. This is really closer to a nuke or bolide impact than a normal volcanic eruption in terms of physics.
True. But at some point Tambora collapsed into his caldera, and that was probably heard. And the same thing might have happened here, with a smaller edifice, but with tons of water involved. So it seems logical that it might have been a bit louder, but not so logical that it wasn’t heard in Russia, Japan, Hawai’i or Guam. Or Antarctica.
The other thing is the red sunsets. This is different though. Some spectacular sunsets were seen in the mountains around the globe. That might be caused by some sulfur in the clouds/moisture in the air. This is a global phenomenon.
I read about Pliny yesterday who sent a short report to Tacitus 25 years later when the latter asked him about his uncle. I also saw then that Pompei is thought to have had 20k inhabitants at the time, and that 90% of them might have survived. It would be mainly elderly and sick people then whose bodies are found there. I think this makes sense. The story of Vesuvius is centred on the excavation.
Is the correspondence from Pliny you the classic letters or some other. I have the former in my library and don`t see how the possible survival percentages might be concluded.
I think edifice collapse is not going to be as explosive as this though. I think of it as being kind of like expanding foam, the mountain falls in and pushes the magma chamber out basically onto the surface, and unconfined it rapidly expands though probably not with true explosive violence. This will send it racing outwards, some will go up but most will stay on the ground and spread out. In a way it is similar physics to an effusive eruption but really fast, and the flows have the property of being somewhat self propelling and nearly frictionless as long as there is enough gas. In the case of Tambora that also meant the flows went right into the ocean, it is basically the same thing as a hot landslide so no real surprise there was a tsunami.
This is distinct from a plinian eruption and column collapse too. A plinian eruption is basically the same thing as a lava fountain but where the force is high enough to exceed the yield strength of the magma. Obviously this is easy to do in viscous magma, which is not really even liquid at all, but it can still happen in fluid magma, even without water, if the eruption rate is high enough.
Anyway, this video actually is exactly what I think the physics behind big caldera collapses is. Ignore the chemistry, just look at the expanding foam and imagine it is magma 🙂
https://www.youtube.com/watch?v=XXn4fP3CnJg
(skip to 9 min in)
Taupo was basically this but really huge, flood of glowing fluidised sand covering 1/4 of the North Island, probably in only a few hours, maybe a lot less. It would look like a pyroclastic flow from a smaller eruption visually because there would be ash in the mix that would rise from convection, but there would be no surge and no extreme directed blast, it would be relatively slow too probably, spreading out until it is only a few tens of cm thick over a huge area due to the extremely low friction and mostly flat landscape. In the Hatepe eruption that was it, but the Oruanui eruption repeated this process many times, at least 10 and probably more, in quite rapid succession.
I think though there was also an actual explosion at Taupo too, of same mechanism as we just got from Hunga Tonga, it is a lake after all and the lake was there 2000 years ago.
Tambora was not known in America or Europe. People may have heard it, they would not have associated it with a volcano they did not know about. It exploded well before the telegraph, and news would have reached Europe only after many months, long after any noise would have been forgotten. The awful summer and starvation of 1816 is now known to be caused by Tambora, but this association was only made 100 years after the volcano. It is far from clear that Tambora was less loud than Krakatoa. Hunga Tonga has shown that a water volcano can be very loud for its size, but Tambora was also a lot larger than Krakatau.
I wonder. The Dutch must have known that Indonesia is full of volcanoes.
Both the Dutch and British knew that Indonesia is full of volcanoes. It’s thought that the British governor, Raffles (?), kept relatively quiet about Tambora because he did not want to discourage investment in the region.
In the absence of the telegraph and later communication media, there was no means to coordinate an effective response to the eruption. Also, unlike Krakatau, which was researched by both the Dutch and the British, there wasn’t any scientific research done into how far the impact reached.
Yes Merlot.
“Many economic historians regard the Netherlands as the first thoroughly capitalist country in the world. In early modern Europe, it had the wealthiest trading city (Amsterdam) country in the world. and the first full-time stock-exchange.”
https://en.wikipedia.org/wiki/Netherlands#Dutch_Republic_(1581–1795)
The most beautiful buildings in many places, a lot of them in Amsterdam. Phantastic art. Early example:
And of course knowledge and science, together with the British, the French and Spain.
https://impact.ese.ic.ac.uk/ImpactEarth/cgi-bin/crater.cgi?dist=200&distanceUnits=1&diam=1000&diameterUnits=1&pdens=500&pdens_select=1000&vel=300&velocityUnits=1&theta=5&wdepth=&wdepthUnits=1&tdens=2750
Destruction just by air^^
More freaky concentric rings, this time from a satellite measuring the temperature perturbation between the day of the eruption and the next day: https://twitter.com/CathyClerbaux/status/1483843083640975360?s=20
Wavelength is about 900km to the northwest.
Speed of sound 0-10km = 300 – 350 m/s
Period ~3000s = 50min
Temp difference about 2C. So you could roughly get an indication of the energy.
Personally I think this is cause by reflection vertically within the atmosphere being resonant at 50min as the arcs to the south show multiple rings and probably a different period
Very cool though!.
900 km would be within range (but at the top end) of what has been seen for gravity waves in the atmosphere. A possible cause (speculation alert) is the pressure which has a large enough wavelength to trigger vertical movement due to buoyancy (so these are strictly buoyancy waves). A quick search shows that periods of 30-50 minutes are possible and because the wave took about 30 minutes to pass (from the pressure measurements), that may be able to trigger a resonance. They are not long lived unless caught in an atmospheric duct (similar to how the sound wave traveled so far). There were much shorter gravity waves in the cloud above Hunga Tonga.
Pressure wave passing over Gemini North / Mauna Kea:
https://twitter.com/GeminiObs/status/1483920464846241800
Disregarding the energetic arguments for a moment, I think it is safe to say that atmospheric pressure waves o such magnitude from an explosive event have not been seen for quite a while.
A nice article in Wired discussing the Tonga eruption:
https://www.wired.com/story/tonga-volcano-eruption-science/
Good piece, thanks. One mistake:
“he saw a tower of ash unlike anything he, or anyone else, had ever seen. Satellites had captured images of a huge column of ash”…..Ash.
It doesn’t matter though because the details further down correct it.
Not fully caught up on the comments to this article yet so forgive me if this has been discussed or posted previously, but I thought this was absolutely bonkers:
https://www.volcanodiscovery.com/hunga-tonga-hunga-haapai/news/170897/Hunga-Tonga-Hunga-Ha-apai-volcano-Tonga-activity-update-top-of-plume-may-have-reached-55-km-altitude.html
I just came upon Albert discussing these anomalously high readings with another user and mentioning the need for caution in jumping to conclusions, and I totally get that.
I’m just in awe of what an incredible display of force this otherwise not particularly remarkable volcano put on a few days ago.
It’s been a pleasure reading through discussion on this and the previous article, dissecting and theorizing what truly was a bizarre event. The kind that hopefully pushes volcanology forward.
It would be interesting to get an analysis of the atmospheric conditions of the upper atmosphere over the Pacific at the time of the explosion. Being a Navy man I have had occasion to experience ducting conditions for both radar and sonar, in which unusually long detection ranges have been observed. The differences in temp and salinity layers act like layers of glass, bending sound and electromagnetic waves as they pass through. If the angle of incidence is correct the waves are trapped in the layers and travel enormous ranges, much like edge lit glass. There is a fotograph in an old radar training manual from the 1960s that shows a radar picture of the entire Mediterranean Sea. Ranges are not accurate but the entire coastline is visible.
Or having Alan Eustace / Felix Baumgartner in helium balloon right above the eruption at their space jump altitudes.. the eruption cloud woud reach both I think, But at their altitudes There is so little air, they woud not feel the shockwave?
“analysis of the atmospheric conditions of the upper atmosphere over the Pacific at the time of the explosion”. Yes, exactly. Esp. as there was possibly a tropical cyclone in the area.
Saw this on a link by Canthisbenull (interesting):
https://www.wired.com/video/watch/inside-a-tornado-modeled-by-a-supercomputer
I took a quick look at supercritical water/steam using this calculator, which I have timed out on.
Supercritical steam is NOT steam that is always liquid, it just means the latent heat of fusion is zero. There is still a temperature and pressure where the water (high density form) turns to steam (lower density form).
https://www.efunda.com/materials/water/steamtable_general.cfm
Whilst I did have usage I examines supercritical water in the 75-80 bar and 260-300C range.
A 2100m depth being about 70 bar in seawater.
Its quite sensitive (I was only looking at density before I timed out, the enthalpy being also very important) and despite it being supercritical there is a large density variation (and quite abrupt) between low and high density water in the period I was looking at. That seems to suggest that its possible (indeed likely) to have a column of wet rock heated mostly from below (ie hotter at depth than shallower) capped with a partly semi-permeable cap and the weight of seawater than renders it stable in the water form.
You will eventually trigger a switch to the low density form, most likely at the upper layers, these will explode if they cannot vent off quickly enough. This removes the overburden dropping the pressure deeper down which then dutifully explodes too.
There will be a time constant at least as long as the speed of sound in water, possibly longer.#If I get access again, I (or someone else) can figure out the energy of (for round figs) 1 km^3 being exposed to atmospheric pressure, and possibly do some ballistics for a 2km long gun pointing vertically containing a km sized projectile.
I like your efforts about understanding the thermodynamic side of things. Would be certainly interesting.
Thank you fort that link, will have a try at it, maybe in the evening.
Its physics. The numbers have to come out somewhere near or your postulate is wrong.
The below are strictly order of magnitude comments.
The problem here is how to heat ~~1km^3 to ~~300C. Do it in 100 years (the apparent relaxation time of this volcano) and that’s perhaps 1/10 MT TNT/annum. Quite reasonable order of 10m/annum over 1 sq km given that transferring energy between magma and water is tricky. How to discharge it in seconds is also straightforward but the energy neds to be right. ~~10MT TNT in perhaps 4 km^3 wet rock with perhaps a 10% water content is needed.
For Krakatau there is something extremely precious: A Dutch geologist with the name Rogier Verbeek who was sent in right away and wrote a 550 page report after talking with many witnesses:
https://www.lindahall.org/rogier-verbeek/
I believe 55 km… Do you look at the shadows and layers… 50-55 km seems likely, although most of the ash cloud (around the overshooting top) was on average 35 km height.
I don’t believe NASA for a second. But America is all about political framing and america being best and other countries suck. If the same eruption happened in their waters, it would have been 100 megatons TNT.
Nasa is very clear on their data and often gives it out in Public quickly.
I think they almost always can be trusted ..althrough their internal political and economic managment is another stuff
Also without Nasa there will be No juno IO flybys in 2024 and beyond
I think we should be happy that they exist 🙂 I like all the Nasa pages and sicence they are doing 🙂
Right.
Dont forget the wonders of Cassini, Galileo space – probes.. the moons of the Gas Giants.. are one of the very most exciting stuff that ever been discovered by man, the oceans of Europa, the volcanoes of IO, the Hydrocarbons seas of Titan. These Nasa spaceprobes where Captain Cook in our solar system really, and they where created by Nasa in general
Nasa have done alot of awsome things, althrough we must Thank the diffirent companies and engineers and technicans as well working on these projects
I looooves space exploration.. and excited What Nasa haves in store for the future
Right. Great things.
So, stating that you don’t believe 1. NASA and 2. South Pacific specialist Cronin who says the column was around 35 km high, Cronin who states they are altogether scratching their heads and the only thing which helps against this scientific pruritus is fieldwork.
Mechanisms: “Because these were only precursor explosions – the volcano clearing its throat – the lahars were modest in size, yet deadly to anything caught in their path.
Then the main eruption. Suddenly the summit could no longer resist the enormous pressures from below. It disappeared over 25 km high into the stratosphere in a huge, Plinian explosion, shattered into tiny fragments and was accompanied by vast quantities of magma. The gas contained in the magma formed microscopic bubbles. As these droplets cooled quickly, they burst into incredibly sharp shards of volcanic glass that turned into cement when inhaled, a cement made of volcanic ashes and bodily fluids that slowly choked its victims as far away as fifty kilometres or more downwind from the eruption.”
https://www.volcanocafe.org/volcanology-basics/the-life-of-a-volcano/
Add water to the recipe.
“Only some 15,000 years ago, a new cycle began. Broadly, it followed the pattern of the previous cycle even if the final, cataclysmic eruption was many magnitudes greater. This time, there was a series of very large eruptions that emptied the by now much enlarged upper magma chamber to the extent that almost the entire edifice disappeared in the ensuing collapse when the roof no longer could bear the weight of the huge edifice. Where it had stood, there was now a large caldera, some 11 x 9½ km in diameter and well over 2½ km deep that slowly filled with water over the following millennia.”
Make it a lot smaller and add water. Subtract the victims (few) who died due to a small to moderate tsunami. Contray to Tambora where – should it erupt today on the same scale (not to be exspected) – 8 million people would die.
Concerning the South Pacific Community it doesn’t help blowing this up as they are rightly more focussed on Papua-New Guinea. This is for learning.
For what it’s worth…
I take the view that, given the extraordinary nature of the event, waiting is in order.
Allow time for all those fields to be populated with as much data as possible.
Yes, but where’s the fun in that?
We cater for all sorts. You’d be surprised.
In Alaska it is said above 20Hz, the sound was between 50 and 60 dB and lasted for 20-30 minutes long gradually getting louder and coinciding with the pressure wave impact.
Considering my learning on VC I got to the conclusion – by reading most – that this eruption is interesting for science, and that it will be really interesting and more solid again when people like Cronin or Taylor and other scientists from other nations have done some field work and bathymetry.
The real problems though are where people live on tiny space which makes evacuation difficult to not possible (Henrik’s nr.1). They have names: Indonesia, the Philippines, Papua-New Guinea, Japan, Mexico City, Nicaragua, Guatemala or Naples.
Adding to this I must say that it shocks me more when I see somebody carry a burnt woman in the piece of Carl’s about Kelud or pictures of the victims of Fuego. And Nyragongo cooking up a caldera event wouldn’t be pretty at all. So, not to forget the African Rift.
That’s why I was a bit shocked when comparisons came up right away with a monster like Krakatau back then. It is pretty to read about volcanoes, but it is also dire for me when I see the victims, mostly burnt. Poor people. Carl said in his piece about Kelud that they started being negligent with those drainage systems. Hopefully this eruption gives them something to think about.
Carl didn’t say that Pliny overstimated Vesuvius. He said s.th. in the sense of Vesuvius having become extraordinarily famous because of Pliny, so a bit hyped I’d say. Campi is more dangerous. So, this eruption might also give Naples and Rome some thoughts. Pliny is the only one with some testimony. I checked this. It is estimated that 5-10% of the people in the Roman empire in the first century AD were literate.
It’s always good to remember that many eruptions have implications… sometimes of a catastrophic nature, for real people. Real people have to live with the outcomes, or cease to live because of them.
Some measure of sensitivity and fellow-feeling is appropriate and respectful.
However, I distinguish between that and allowing people to let their creative natures play with concepts, because “play ” (as Farmeroz infers in relation to my previous comment) , even when it may appear frivelous, enables understanding.
A balance is required.
Yes, I encourage all of you continue the way you are playing with ideas concerning the physics of this event.
This can be very educating.
Why not, Neil. Balance is good.
The damage though seems manegeable while people around Goma are said to still live in camps.
From a human perspective Goma was much worse.
Point taken, but equally…
I’ll wait a little longer before forming an opinion on that.
There may or may not be entire settlements scrubbed off some of the smaller islands. So much still needs clarification.
Tatun by Tallis:
“One way that can give more data and some insight into this possibility is to study the plumbing and dynamics of the hydrothermal chamber. A potentially important part of this would be the aforementioned regional tectonics. The hydrothermal chamber is often mentioned as a side note to the magma chamber, and generally only receives modest attention as it doesn’t threaten a large number of people. This is not the case here, not only is this hydrothermal system large, it might have highly volatile material from the mantle.
A Vulcanian eruption would produce similar issues. The predictability would probably go up as the eruption would get larger, however, this doesn’t have to be the case. This volcano doesn’t have what would call a well-grasped history and it’s existence seems to be special. It’s magmatic eruptions could be very predictable or very unpredictable. But after 1 deadly explosion, there would be mass evacuations and prep almost immediately after. These eruptions wouldn’t be extremely dangerous for normal volcanoes but this isn’t a normal volcano. The inherent difficulty of giving an accurate volcanic forecast is maximized with the nature of these eruptions. They would not be extremely deadly like Nevado del Ruiz or Pelee but relative to their size they could be some of the costliest and deadliest eruptions of their kind.”
https://www.volcanocafe.org/the-urban-volcano/
http://www.iris.washington.edu/news/events/taiwan/taiwan99reports/chi-chi4.html#:~:text=Taiwan%20is%20located%20at%20a,SE%20direction%20(Figure%201).
Somebody remembered! Tatun is such an underrated beast! 3,000 km3 of magma, 5 million people living with in 5 km of the volcano along with 2 nuclear power plants! Every single volcanic hazard has taken place at this system and with the threat of volcanic nuclear meltdown threatening over 5 million people, this volcano is the most dangerous in the world
Think of say pinatubo at its most energetic eruption stage.It is lifting a dense column of ash to the stratosphere.
The energy from the eruption is lifting this heavy ash column, now imagine the same energy release with a less km3 of ash , would not this less dense column then go faster and higher?
Then the mystery is that amount of energy without the expected ash rich column
Must of been a sudden massive influx of magma from depth, most of which is still place?
Folks…it is not about “believing NASA”. NASA is no single entity. What we have are some media reports claiming that NASA scientists revised their estimation of energy “from 10MT TNT down to 6MT TNT”. Nothing more. No data, no names of that scientists. Nothing. They may have something to do with NASA or not. For sure it is not an official NASA claim. And even if it were: just show data and a calculation on how to expand 500km^3+ of gas into the atmosphere, within that energy budget. Because without doing so, the observed pressure wave could not be explained. It is quite simple at that point.
“We come up with a number that’s around 10 megatons of TNT equivalent,” James Garvin, the chief scientist at NASA’s Goddard Space Flight Center, told NPR.
Concerning history this might be a good object to take into consideration. Paper says little sulfur, eruption possibly in one single day, no famine, paper by Clive Oppenheimer et alii:
https://www.sciencedirect.com/science/article/pii/S0277379116305017
About Changbaisan, eruption volume estimated as VEI 7, possibly emitted in a very short time, sulfur-poor. The volcano is situated in the area of the green spot on the Chinese-Korean border.
Based on early reported effects in the -87 deg. C. area of the atmosphere (normally around 55 km/Mesosphere) I could not quite believe that to be the case based all all else reported. I started looking for incidents of cooler Stratospheric episodes at lower altitudes to explain, but now it seems those data possibly were correct all along. An overshoot – probably from water – might indeed have travelled up to 55 km. Well into the Mesosphere where those T’s normally are seen at that altitude. With main plume apx at 35 km. That would be really up there. Don’t look up! 😀
Sorry. Link to basis for evaluation made by Eumetsat-team;
https://www.eumetsat.int/hunga-tonga-hunga-haapai_2022
Its important to remember that the eruption plume is definitely NOT in thermal equilibrium with air normally found at these altitudes. Using the cloud temperature to estimate altitude by comparing it to the equilibrium air temperature at any altitude will certainly be wrong. What you are seeing is a hosepipe aimed skyward, it will expand as air pressure drops, but (given ash and inertia) probably significantly less quickly than you might imagine.
Bernoulli is not to be trifled with.
I know that it affects T. But when scientists early on reffered to -87 C I could not quite wrap my head around;
Were they stating that as an avg T for the atmosphere at a given altitude (a probability)?Was it according to observed T in the moments before/an avg./seasonally adj.? Were they reffering to an effect from the blast giving that T at a certain alt. ? What was this, as no other info seemed connected to the statement. I commented on this early on. But it is still to be completely clearified. Unless I missed something from their statements in the assessment given in the eumetsat link above.
Amazing videoes of the pressurewave btw. Figure 10 and 11. You can clearly see how the wave closes in on the antipode to re-expand going back. Clearly explains a ~2,7 hPa disturbance seen here in Greece. Would be interresting to have a near antipode reading.
https://www-cdn.eumetsat.int/files/2022-01/Meteosat-11_Shockwave_video.mp4
Run it at 0,25 speed. 😉
Hello everybody 🙂
Here are some very high resolution satellite image sliders before and after the Hunga Tonga eruption: https://sertit.unistra.fr/en/news/volcanic-eruption-in-tonga/
Article from NPR.
https://www.npr.org/2022/01/21/1074438703/nuclear-test-monitor-calls-tonga-volcano-blast-biggest-thing-that-weve-ever-seen
The tsunami seemed to be similar those in the region caused by 8.5 magnitude quakes
Although very rough comparison based on one parameter
An 8.5 quake is the equivalent of 4 gigatons TNT
10 megaton is laughable
“We come up with a number that’s around 10 megatons of TNT equivalent,” James Garvin, the chief scientist at NASA’s Goddard Space Flight Center, told NPR.
Explaining the explosion!
https://www.volcanocafe.org/hunga-tonga-and-the-supercriticality-event/