
Source https://www.cestujlevne.com/pruvodce/spanelsko/tenerife/pico-del-teide
It is sometimes said to be the highest volcano in Europe. There is an obvious problem with that: El Teide is not in Europe. It may be Spanish, but the location is in the Canary Island which politically are included in Europe but geographically are not. A second problem is that there are much higher volcanoes in the Europe, in the Caucasus, but let’s not mention that.
By another measure, Teide is considered the 3rd tallest volcano in the world. This is measured from the sea floor on which it rests, which makes it 7.5 km tall. It certainly sounds impressive. From land, the volcano looks funny. It has an impressive edifice which dominates Tenerife and makes driving up the steep sides an interesting experience. Living on the edge is also not for everyone. But at the summit, the mountain becomes a cone which seems far too small in comparison to the giant edifice.

Source: https://www.globalnationalparks.com/spain/teide/
Teide is the main mountain of Tenerife, the largest island of the Canary Islands, off the coast of Morocco. Before the Spanish colonization, it was inhabited by people known as Guanches (literally ‘people of Tenerife’), originating from northwest Africa and related to the Berber people. When they arrived is not known, but the oldest archaeological sites are dated between 600 and 500 BC. One suggestion is that they came because of the desertification of the Sahara, but this could still be anywhere between 6000 and 1000 BC.
The Canary Islands were well known during Roman times but Roman records suggest the population in those times was sparse. However, archaeological remains of the Gaunchos culture are found across the archipelago. Little else remains, though. The people were largely (or completely) wiped out during the Spanish conquest. Fragments of their language survived, and we know of some of their belief systems. Teide was considered the domain of an evil demon, Guayota. A story quoted on the national park website relates that “Guayota kidnapped the god of the Sun, plunging the island into darkness until Achamán, the supreme sky god, managed to defeat him and free the Sun, sealing the volcano’s mouth with Guayota inside.” (https://www.globalnationalparks.com/spain/teide/) I do not know the origin of this story, but it clearly is based on some significant eruption. Teide is not dead.
The island

Tenerife has the shape of a slightly bent triangle. The tourists are found mainly on the western and southern side, which are the sunniest but far from the prettiest: it is semi-desert, bordering on full desert. The main town on Tenerife is Santa Cruz de Tenerife in the north, and the nicest town to visit is probably Puerto de la Cruz. Teide dominates the southwestern half of the island. A ridge extends from Teide to the northeast, along the Monte de la Esperanza, following an ancient fissure. The northeast tip consists of the Anaga mountains. These mountains are among the oldest part of Tenerife; they formed some 7 million years ago. The Teno mountains at the western tip are of similar age: they form the famous cliffs of the giants along the coast. A third ancient mountain from this era is at Adeje, near the southernmost tip of Tenerife.
At the time, these were three separate islands. They came together 3 million years ago with the growth of Las Canadas at the centre. Las Canadas went through ups and downs, including a giant collapse which formed the Las Canadas caldera surrounding the summit of Teide, around 200,000 years ago. Similar to what is commonly seen in Hawaiian volcanoes, three fissure rifts extended from Las Canadas. One of these formed the dorsal ridge of the Monte de la Esperanza, pointing towards Anaga, and the other two went towards Teno and Adeje. Thus, the three ridges connected the central volcano to the outlying islands.
The current Teide volcano developed after the latest collapse. The 220-meter tall cone on top of Teide formed some 3000 years ago. A satellite cone to Teide is located west of the summit and is called Pico Viejo.

Teide earthquakes
Teide has recently drawn attention because increasing earthquake activity. Not all quaking comes from Teide itself. On February 26, 2026, an earthquake of magnitude 4 hit, strong enough to rattle tourists, but it came not from Teide but from the Enmedio volcano. If that is one you have never heard of, it is 500 meter tall and it located on the seabed halfway to the neighbouring island of Gran Canarias. In 1989 there was an M5 earthquake in the same area.
The proper Teide earthquakes came in two forms. One is that of isolated, weak activity around 10 km below Teide, with locations as in the plot below from March 7. These events have been much too small to be felt.

The other type is in the form of low-frequency earthquake swarms, triggered by ‘fluid pressure’. They have been occurring in the same region in the west of Las Cañadas and at the same depth as the individual events (8-14 km), but consist of thousands of events. The amount of energy in each swarm is small, and adds up to no more than perhaps one M2 earthquake. The swarms are typically associated with migrating ‘fluids’ which could have been magma but in this case appears to be heated water.
The first such swarm occurred on 2 October 2016, almost ten years ago. It consisted of over 700 detected events, and probably many more that could not be separated by the measurements since towards the end of the 5-hour period the swarm became a continuous tremor. One month later, the CO2 emissions from Teide increased. There was no ground inflation. It is plausible the event was related to an overturn in the deep magma system, bringing some hotter magma to the top and triggering a gas escape which slowly made its way to the surface. There were further swarms in later years, most recently in August and November 2024.
But in February this year, the swarms swarmed. There were 7 such swarms in one month, between Feb 6 and 26. A further weak swarm of 90 earthquakes was detected on March 5. The last two events were the weakest, indicating the swarm of swarms is fading.
The most likely cause of the swarming is increased heat entering the magma chamber. There has also been some slow inflation in recent years.
Eruptions
Teide is not very active. It has a relative low eruption frequency, well below that of nearby La Palma. The eruptions also have low explosivity. The last time the summit itself erupted was 1000 years ago. Most eruptions have been around the base of the current Teide volcano, around the rim and edge of Las Canadas caldera. Several such eruptions have been documented since the Spanish conquest. They occurred in 1704-1706, 1798 and 1909.
Little is known about older eruptions. Sailor reports exist (including one by Columbus) but often can be explained by normal summit clouds or forest fires, both of which are far more frequent than eruptions. C-14 dating has shown that the most recent summit eruption occurred between around 650 and 950 AD. Columbus reported an eruption ‘high up’ in 1492. That was probably a true eruption, but not near the summit: it can only be assigned to a lava flow on the west side called the Boca Cangrejo, shown on the map below.

Source: Teide Volcano: Geology and Eruptions of a Highly Differentiated Oceanic Stratovolcano (Spring 2013). Note that the numbers at the red dots and orange (prehistorical) flows are not the year but the age before 1950 (yr BP).
1704-1706
After more than 200 years of dormancy, Teide came back to life on Christmas eve 1704 with notable earthquake activity. It intensified on Dec 27 and 28. There was damage along the northeast rift zone, with buildings collapsing in several towns. The eruption started on December 31 1704 with brief activity at Sieta Fuentes (see the map above). Lava flowed for around 1 km and a small cinder cone formed.
On Jan 6, 1705, a new fissure opened 2 km further northeast. Apparently the magma was pushing along a dike in this direction. Initially this formed some 30 small vents, which eventually merged into two conder cones, now known as Volcán de Fasnia. Lava flows of the individual cones remained short, but eventually one reached 5 km downhill before it stopped. Fasnia ceased erupting on January 14.
But this was not yet the end. On February 2, a new vent opened some 8 km further along the same line. This was at lower altitude of 1500 meter, in the Güímar Valley. It formed Volcán de Arafo, now a 100 meter high cinder cone. The lava flows from this cone were more significant, perhaps aided by the lower altitude. Two flows came close to towns, one of which passed Arafo itself before coming to a stop only 1 km from the coast. The eruption ended on March 27, 1705.
There is a similarity to the recent La Palma eruption, with several vents along the side of the rift zone. The upper vents allow gas to escape, whilst lava mainly opts for the lower vent(s).
But although this was the end of the eruption, it was not the end of the activity. Teide was not yet spent. The northeast rift had not erupted for a long time and perhaps was rather resistant to the magma pressure. It closed too early. Earthquake normally ends once an eruption is in progress and certainly when it has stopped. But this time in Tenerife, it continued throughout the rest of the year and into 1706, with ‘underground rattling’ and ‘shaking buildings’. On the night of May 4, 1706, more than a year after the eruption had stopped, the earthquakes again intensified. But they had been going on for so long that people were not taking it as a warning.
The eruption that started the next day came as a surprise. It was some distance from the previous activity, along the northwest rift, close (6 km) to the town of Garachio. By late afternoon that same day, the lava flows had reached the cliffs above the town and split into several branches. There was damage to the town, but the most important damage was to the harbour. Over the next week it was almost completely filled in by the lava, leaving a cove “impracticable even for small boats’’. This was a disaster: Garachio was the main port for resupply on the way to the Americas. All trade along the route ceased, until a new port was developed which would become the town of Santa Cruz de Tenerife.

The 1706 volcanic eruption of Garachico in an anonymous contemporary painting copied by Ubaldo Bordanova in 1898. The lava flows cascaded down the cliff and partially filled the harbour, the most important trading port with South America in the Canaries. Source: Teide Volcano: Geology and Eruptions of a Highly Differentiated Oceanic Stratovolcano (Spring 2013), Fig 8.1
At first the lava came from a 500-meter long fissure. On May 12 the eruption focussed on the eastern most point of the fissure and a new lava flow traveled along the edge of the previous ones. This flow reached Garachio on May 13 and covered the centre of the town. After this, the eruption diminished. The end date is not fully certain – perhaps people had more important things to worry about than the state of the eruption. The eruption probably lasted until June and perhaps as late as the middle of the month, or 40 days since the beginning. It left a 115-meter tall cone which is now called Montaña Negra, and a lava flow that covered part of the town and much of the harbour.
But why had the harbour been there? The town had originally been built on a flat area at the coast. It turned out, this area had been created by a lava flow dating from some 10,000 years ago. Teide created the town and harbour – and took it away. Typically volcanic.
1798
Almost a century of quiescence followed. In 1795, earthquakes again were felt. The eruption started June 9, 1798. It lasted more than 3 months. The eruption came from a fissure on Pico Viejo, over a length of 1 km downslope. Although in the southwest slope of the volcano, it appears to be an extension of the northwest rift zone, based on the lava composition. The eruption was strombolian with some more intense explosive events. Ash fell over much of Tenerife, and also on the other Canary Islands. There were three vents. As before, each played a different role. A contemporary account states that the first, upper vent produced fume, the second, middle vent stones and lava and the third, lowest vent only lava.
The lava stayed within the Las Cañadas Caldera, well away from habitation. It covered some 5 km2 with a thickness up to 15 meters. The total volume is around 0.03 km3. It ended in October 1798.
1909
The most recent eruption occurred in the early 20th century. There had been 1.5 year of earthquake activity before the eruption started on November 18, 1909. It happened on the northwest rift zone, but formed an east-west fissure. There were 5 vents but they merged into an 80-meter tall cinder cone called Chinyero. Lava flowed in two branches, reaching a few kilometers in this uninhabited region. This was a tourist eruption: boats took people from Santa Cruz de la Tenerife to Garachio (yes, that one) from where they walked up the mountain to admire the lava flows. (It was not the first tourist eruption: that was Krakatau where people went to Krakatau during the early phases of the eruption, before it became too dangerous.)
The eruption lasted 10 days; the lava covered around 2.5 km2.

The Chinyero cone and lava flow. Source: Teide Volcano: Geology and Eruptions of a Highly Differentiated Oceanic Stratovolcano (Spring 2013), Fig 8.13

(a), (b) Chinyero volcano (contemporary photographs, Centro de Fotografía Isla de Tenerife).(c) Map of the Chinyero eruption by Fernández Navarro (1911). (d) People closely watching a lava front of the 1909 eruption near Montaña Bilma (contemporary photograph, Centro de Fotografía Isla de Tenerife)
Source: Teide Volcano: Geology and Eruptions of a Highly Differentiated Oceanic Stratovolcano (Spring 2013), Fig 8.14
There has been no further activity since 1909. That is not surprising, seeing that we only have had four eruptions in over 500 years.
Future
What does this mean for the current phase of earthquake swarms? It appears, nothing much. The events were preceded by much stronger earthquake activity, in two cases lasting well over a year. The current events are nowhere near that scale. Even of this develops into something more, we could be decades away before this happens. There will be time to prepare. And we will have to be prepared, because Tenerife is far more developed now. We will have to quickly fly out the tourists – while the new tourists fly in to admire the eruption.
Teide is not yet awake. But it may be dreaming.
Albert, March 2026


There are reports of damage in Germany from debris from a meteor
It was 9.99 km too small
🤔
Your preferred meteor size would put a sudden end to VC. I vote against
Looking at the Kilauea monitoring data, one graph that stands out a bit is the UWEV-CRIM measurement. There’s a very clear upwards trend for the value at which the next episode starts and it looks very predictable. Using an eyeball extrapolation method (patent pending) on the trigger level for previous events as well as the current measurements, it looks like the trigger level is within reach with two or more data points. The trigger level is not absolute, but the variation is just plus minus a couple of days. I’d say the next episode should start in some 2-4 days from now.
My feeling too. Lava is on the rise again.
Yeah, at 4:17 AM local time, lava overflowed at the south vent…
Yes, it’s already a nice lava fountain that resembles some water founatins of French gardens.
We’ll get the result of a quasi-experiment of Kilauea soon. The deformation since last episode was different (with more up and down) than before previous episodes. We have to check, whether this different deformation will influence the style of the first March 2026 episode.
Thanks for the introduction to this rarely (in human life) erupting volcano!
If we use the cycle of Hawaii’s volcanoes, I think that we can classify Tenerife and Gran Canaria as a mixture of postshield and rejuvenated volcanism. After the shield stage Tenerife had a period of calm “Gomera” stage with extinct volcanism for a while, that ended around 4 million years ago with the reoccurrence of volcanism. Las Canadas was built during the rejuvenated and postshield stage. How large were the historical eruptions compared to La Palma 2021?
La Palma 2021 was similar but larger than average for the historical Teide eruptions. But the sample is too small for drawing conclusions. Remember that the 200-meter cone on top is the result of one eruption, only 3000 years ago or so.
Teide is in a low-activity phase. But it has gone through many phases and has collapsed and rebuild itself. Volcanism in the Canary Island is not moving away as in Hawaii. Teide could well become more active again in the (distant) future
As far as I’ve read, La Palma and El Hierro have more mafic magmas inside the alkali spectrum, while Tenerife and Lanzarote erupt more evolved magmas. However, here is a photo of a Trachybasaltic rock from Tenerife that shows that unevolved magmas are also there: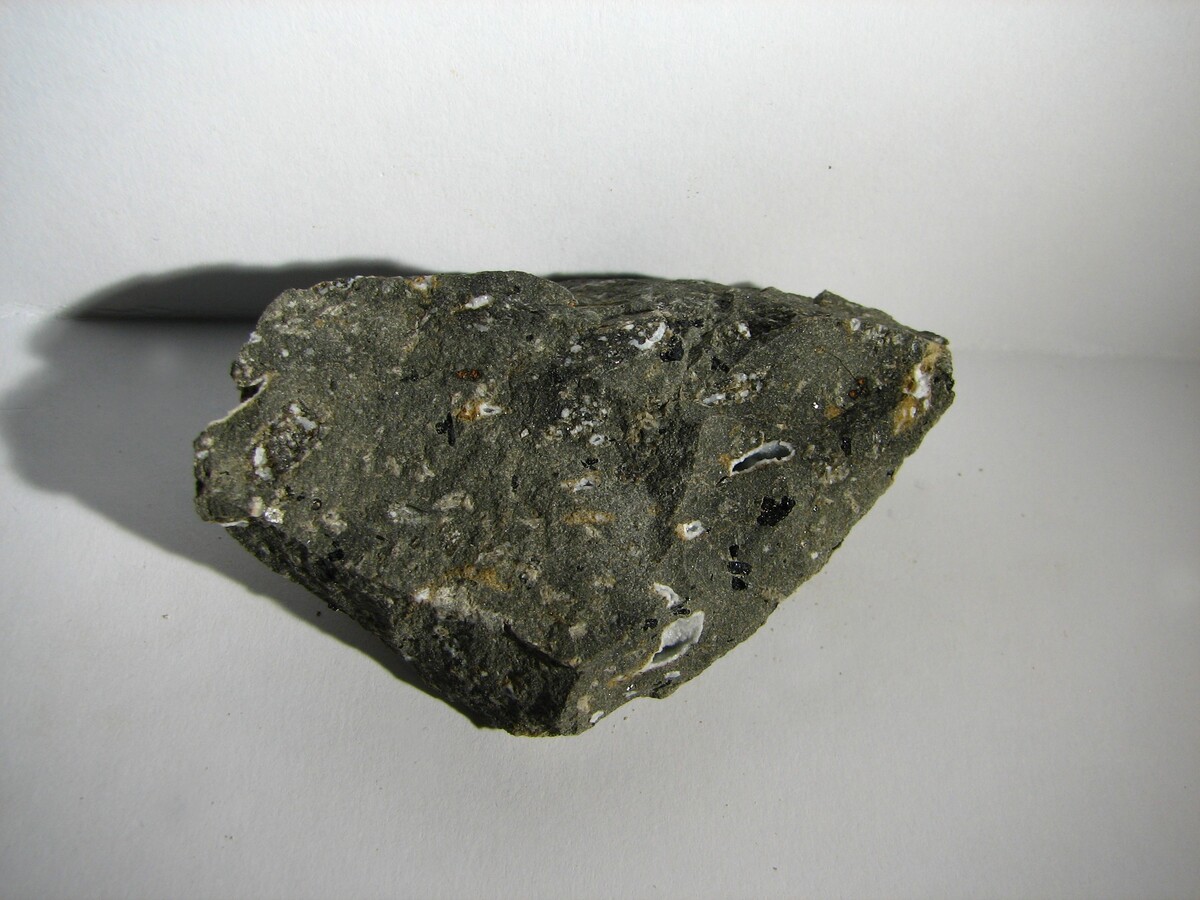
https://www.mineralienatlas.de/lexikon/index.php/RockData?rock=Trachybasalt
Isn’t the African plate slowly moving east? This would mean that hotspot has its new volcanoes in the west and the old ones in the east.
I think there was an article (may have been on the old wordpress site) discussing just this, the rejuvenation stage of these islands. Lanzarote too has had historic eruptions, but theoretically should have died off by now.
It sort of fits with a plume & tail theory, also with a leaky fault theory (betics continuing into atlantic), but neither are fully perfect.
And then there’s Gran Canaria which has possibly not erupted for 1 million years, which seems baffling.
If we look at the lifecycles of Lanzarote, Tenefire, La Gomera, La Palma and El Hierro, we see a difference to Hawaii: While in Hawaii the postshield stage begins gradually during the late shield stage, the Canary islands shut down volcanism suddenly after the shield stage. After a break of millions of years, volcanism continues again with a behaviour that resembles Hawaii’s postshield volcanoes Hualalai, Haleakala, Mauna Kea and the rjuvenated volcanoes f.e. of Honolulu. https://en.wikipedia.org/wiki/Honolulu_Volcanics
On Oahu the pause between the postshield stage and the rejuvenated stage was ~700,000 years: The shield/postshield Ko’olau series ended 1.7 million years ago, and the new Honolulu Volcanics began up to 1 million yeras ago, but is much weaker than the rejuvenated stage of the Canary islands.
Looks like north vent is fountaining pretty intensely now…
*since 8:17 AM local time.
They wrote recently that they exchanged V1 webcam with a new one that has sound. But on Youtube it shows no sound. Maybe only to employees?
I could hear it, but it’s just wind.
I had to turn up my main volume on the PC to max to hear it and it is still faint.
There was barely any wind up there today it was the sound of the fountains. You can hear the clinking of the Tephra falling on the camera too.
The Big Island News Video shows us the eruption with sound (mainly rockfall):
The strength of an episode and the duration of the break afterwards are positive related. Strong episodes are followed by long dormant periods, while weak episodes are followed by short dormant periods: https://www.usgs.gov/volcanoes/kilauea/science/eruption-information
E35 October 18th: Height 479m, 22 days pause
E40 January 12th: Height 250m, only 12 days pause.
E41 January 24th: Height 450m, 22 days pause
E42 February 15th: Height 400m, 23 days pause.
I think it’s possible that the intensity of the episodes is being controlled by the magma ascent rate in the immediate lead-up to the eruption. This may explain why episode 40 was so weak compared to the others. Magma had been stalled close to the surface for a while, given the little change in inflation, so it was rather degassed at the time of the eruption and did not manage strong fountains. By the time the degassed magma had been cleared, the pressure may have been too low. Episode 38 may have instead been boosted by a fast magma ascent leading to the eruption. 38 was the one that I think produced the purest reticulite tephra from what I saw (the large golden spongy clasts that showered the Chain of Craters area) and also destroyed V3 cam, I think if it hadn’t jetted sideways it might have had the tallest sustained fountain height.
This episode had high fountains (400 m) but is seemed to me didn’t produce as much lava (hard to tell though, so perhaps wrong).
Progression of the lava bath:
Seems the North vent is slowly intensifying.
Starting to feel like this is the start of Ep. 43…
HVO has confirmed that episode 43 has started.
South vent is starting to spatter a little.
That is a surprise. It seems to have skipped a few days ahead. Feels too early
And now a third vent is overflowing. Interesting.
V1 camera is in the firing line
Might end up with the same fate as the old V3 camera.
We might find out what its demise sounds like. You can hear the tephra falling, and occasionally hitting the camera
It sounded like a big tick.. at 11:31:50 a stone hit the camera and left it defocused.
Very tall fountains this time
Looks like the overlook has been closed.
The vents were equal high. Previous episodes often had a dominant and a subordinated vent. It’s unique that both vents erupted ~300m high during the same episode.
thanks for the pics. guys.
Appreciated.
V1 camera is hanging on for dear life.
…and Ep. 43 just ended.
There is a video from USGS flying over an avalanche that occurred on August 10th 2025. It shows the destruction the tsunami caused on the mountain on the opposite side of the fall.
https://www.youtube.com/@alaskasnewssource
”
Scientist describes 1st-hand account of landslide, tsunami damage”
USGS Report
https://www.usgs.gov/programs/landslide-hazards/science/2025-tracy-arm-landslide-generated-tsunami#:~:text=A%20landslide%20above%20the%20toe,about%20the%20event%20is%20obtained.
https://earthquake.alaska.edu/major-landslide-southeast-alaska-fjord
“That same morning, Ezgi Karasözen, one of the Earthquake Center’s research scientists involved in developing tools to detect landslides, jumped on the mystery. ”
“The main release was preceded by hours of small mag 1-2 earthquakes Leading up to the slide”
“What she found in the seismic record was a massive landslide in the same area as the tsunami. “Our initial estimate placed the source near South Sawyer Glacier, with a very large volume, possibly larger than 100 million cubic meters,” said Karasözen. ”
Figure 3. The large landslide clearly shows in the seismic record at the bottom right. Prior to the landslide, the smaller, precursory events increase in number leading up to the major landslide. Seismic data from Earthquake Center station S32K. Figure produced using EarthScope Data Management Center tools.
“Figure 5. Seismic records within a thousand kilometers of the Tracy Fiord landslide. Close stations record the signal first. At further distances the seismic waves arrive later and are more protracted in time. The amplitude of this seismic signal hundreds of kilometers away can be used to estimate the volume of the landslide. Initial estimates based on these seismic data suggest a volume of 30-250 million cubic meters.
**Technical details: Plot shows vertical component broadband seismograms that have been trace normalized and bandpass filtered on 20-100s.”
While US Hawaii is back to sleep, the French Hawaii continues: https://www.linfo.re/la-reunion/societe/piton-de-la-fournaise-la-coulee-de-lave-s-immobilise-a-975-metres-de-la-rn2
https://www.linfo.re/public/images/2026/3/11/piton-de-la-fournaise-:-la-coulee-de-lave-s%E2%80%99immobilise-a-975-metres-de-la-route-2d28__182934_w-620.webp
The eruption has slowed down today, but Piton is still inflated and will supposedly be able to continue its eruption.
I’ve been thinking about how this eruption compares to other past episodic fountaining eruptions of Kilauea, namely Pu’u’o’o and Mauna Ulu, and have encountered some differences in its fundamental eruption dynamics:
1) The way fountain height evolves throughout the eruption: The Pu’u’o’o eruption had fundamentally different ways of behaving. Fountains during Pu’u’o’o would have an initial stage of growing fountain height that generally increased in length throughout the eruption. We are now perhaps similar to what Pu’u’o’o was doing in episodes 20-25 where this stage was brief and quickly evolved into the tallest fountains, but past episode 29, Pu’u’o’o fountains would take several hours to build up in height. Even though the current Kilauea episodes resemble the later Pu’u’o’o episodes in terms of intensity, the fountain growing phase is nowhere near as long, with the tallest fountains being reached an hour or so into the episode I think. Then there’s the fountain height decreasing phase, both eruptions do have them (past the short-lived peak), but in Pu’u’o’o the fountain would rarely decrease by more than 25 % compared to the maximum height, while in the current Kilauea eruptions the fountains end up more than halving by the end… For example, at the end of this episode, the sustained fountain heights were around 150 m only, while at the peak, they were at least 400 m, probably more at the exact climax when dust was obscuring the tops. Pu’u’o’o fountain episodes, particularly the ones after 29, also behave a lot more like Etna paroxysms in that the fountain height grows throughout the eruption and reaches max or at least stays close to max towards the end of the episode, which is very unlike what this eruption is doing…
2) The way the erupted volume evolves throughout the eruption: This is perhaps the most dramatic difference, and here each of Kilauea’s episodic eruptions behaves fundamentally differently. We are seeing a rather striking increase in episode size since the initial fissure opening stage ended. Volume of episodes has increased by an order of magnitude, since episode 5 or so of the current eruption, and this growth in size seems to have been rather sustained, starting at 1-5 million cubic meters per episode, we are now having some that have 12 million cubic meters. Pu’u’o’o eruption size was slightly variable from one episode to another but relatively constant throughout the eruption, generally between 8-10 million cubic meters, both in the early and the late fountain stage of the eruption, with no overall progression. Mauna Ulu was quite constant for the first 8 episodes, which all were 3-4 million cubic meters, then there was an abrupt change with episodes 9, 11, and 12 having volumes of 10-12 million cubic meters, separated by a much weaker pseudo-episode 10 that I don’t think can be considered a high fountain (only 30 m).
3) The jetting events: The jetting events of the current eruption can probably be considered the same phenomenon as the ones Pu’u’o’o had, but they manifest in a somewhat different way. Pu’u’o’o jetting events were a characteristic of the final six fountain episodes, where they would often happen about 4 times towards the end of the eruption, each lasting some 1-2 min. They would yeet lava up to 550 m, and always over 400 m, and produce black clouds of ash. The current eruption’s ones while when from south, can reach similar heights but seem much more short-lived. 20 seconds or so? They are also just the final gasp of the eruption; each vent does it once and once only. And the north ones seem much less tall than those of Pu’u’o’o.
These differences probably boil down to some plumbing aspects that are different between these eruptions. At present, Kilauea is drawing magma for the Halema’uma’u magma body to a vent that is directly above (2 km above). In the Mauna Ulu and Pu’u’o’o eruptions, the magma had many kilometers to travel laterally through the connector conduit of the rift, and there was also a height difference involved. Pu’u’o’o is located inside the MERZ sill complex too, which is more areally extensive than Halema’uma’u and may have been involved in feeding its episodes.
The last episodic summit eruption of Kilauea was Kilauea Iki 1959. It only lasted a mont, but in this short time had some aspects in common with the current longterm episodic eruption. The first episode of Kilauea Iki was relatively effusive and hesitant similar to the first five episodes of the 2024-… eruption.
The tallest lava fountains (580m) of Kilauea Iki happened during the 15th of 17 episodes in the final stage. https://www.usgs.gov/observatories/hvo/news/volcano-watch-a-look-back-episodic-kilauea-iki-eruption-1959
Kilauea Iki had explosive lava fountains until the very end of the eruption. E16 had a 1500 feet (~500m) tall lava fountain. After E16 Kilauea Iki decreased sharply with E17 being mainly a Strombolian spattering eruption. https://pubs.usgs.gov/pp/0537e/report.pdf
This could also be the future of the current eruption. It may continue to be an explosive lava eruption until the last day, maybe with a weak spattering episode in the end.
Compared to Kilauea Iki the current eruption sits on the SW side of the caldera. Kilauea Iki was on the E exit of the caldera. Both Kilauea Iki and the current eruption are summit eruption which lean towards one side of the caldera. They resemble independent voters who lean to one or other party during elections.
Kilaiea Iki E17 was probably weak because magma started going to the ERZ, earthquakes started showing up on the Pahoa seismometer immediately after the end of the Iki eruption. With E15 and E16 going to 500m it might have even started right after that and E17 was just a last gasp of the vent really. However it happened its pretty likely the Kilauea Iki vent would have lasted WAY longer if the ERZ wasnt accessible.
Kilauea iki is/was likely close to the central vent of the Ailau’au eruption, that sent lava along present Volcano Village towards the east. Were the three historical Kilaua Iki eruptions failing attempts to renew the Ailau’au eruption?
In an alternate timeline I guess theres a lava shield where Kilauea Iki is now, and no Mauna Ulu or Pu’u O’o
Timelapse of B1 Webcam shows the lava flood during E43 and the tiny eastward progression of the lava lake/field by this episode:
Ramping up activity on the lava front of Piton de la Fournaise with the lava flow expected to cross the closest national road in the upcoming hours/days. I wonder if this will have any influence on the turnout for the Sunday’s elections!
Torfajökull with strong earthquake activity at shallow depth today: “Today March 12th at 11:48 an earthquake M3.7 was detected around 3 km West of Landmannalaugar. The earthquake was at 1.3 km deep and was likley felt in the viccinity. Several aftershocks have been detected. This is the largest earthquake since January 2019 and August 2018 when earthquakes of M3.7 was also detected. Only 20 earthquakes over M3.0 have been detected in the area of Torfajökull and Landmannalaguar since 1991.”
The green star of the strong 3M.7 quake sits on the northern Caldera Ring Fault of Torfajökull.
https://www.usgs.gov/observatories/hvo/news/volcano-watch-episode-43-new-fountain-height-record-and-tephra-fallout
E43 reached 540m, equal to the highest from Mauna Ulu, and only 40m shy of the hostorical record, which has a good chance to be beaten this year
I hadn’t realized it was this high. The episode started 1-2 days early, and skipped the overflow phase. Not sure why that was. Overflows come from having not enough gas to break through the magma in the conduit. It pushes it upland then escapes during the high stand. Fountains come from having more gas relative to the magma, with a stable mix. The jet-phase at the end is when there is too much gas for the magma and the magma becomes blobs carried by the gas. Perhaps the extreme height was because the first phase of gas escape hadn’t happened?
I think its just following a trend. Fountain heights and eruption rate has been generally increasing, along with generally longer repose periods between. Magma supply hasnt changed much or at all since at least 2024.
My theory is the magma under Pahala started getting into the volcano in 2023, first refilling both rifts to an eruptable state within a year (crazy by itself) then causing this eruption, which is about twice the output of before 2018. Its also erupted more lava than Svartsengi, too, at least as this comment is posted.
The only problem, HVO has not released data for geochemistry on the current eruption. So its hard to say anything for sure.
Can a switch to an effusive steady style happen on the same location, where until now the episodic eruption occured?
1986 Pu’u O’o switched the location, when the eruption style changed.
1969-1970 Mauna Ulu stayed very much on the same location with both eruption styles.
1959 Kilauea Iki didn’t switch to a steady eruption style, but stopped the eruption before a change was able to follow.
Regarding chemistry of the lava, it accords with the magma source being the Halema’uma’u chamber (https://www.usgs.gov/observatories/hvo/news/volcano-watch-handling-pressure-what-gases-trapped-inside-crystals-tell-us, final sentence). That chamber has also seen an increase in pressurization, while the south caldera chamber has been depressurizing since the eruption started (https://volcanoes.usgs.gov/hans-public/notice/DOI-USGS-HVO-2026-01-23T03:39:44+00:00).
It thus seems that the south caldera chamber is now acting like a feeder for Halema’uma’u (and a good one, for that matter – I recall HVO noted elsewhere the supply to it is nearly double what Kilauea usually does). I believe the chamber has, in the past couple of months, come to be depressurized enough to now partly draw from the ERZ; note how tilt on ESC (ERZ, west of Maunaulu) changes rapidly during an episode with what appears to be primary movement around 315° (extrapolating from the blue line showing positive deformation at 0°, and the green line negative at 90°, i.e. towards 270°). This wasn’t the case beforehand I recall, and indicates to me the eruption moving to the ERZ anytime soon is unlikely at best – HVO themselves noted the upper SWRZ has a greater chance for the eruption to move to, if at all, than the ERZ. Guess it needs a good sleep after being the primary eruptive focus for 70 years.
It will be interesting to see what the more recent samples say about lava chemistry, the fountains before July generally werent that tall, and eruption rates were lower. Especially the last few episodes since the south vent reactivated with a vengeance and both have reached immense height in tandem.
The actual magma supply from depth has increased too. It was evidently very high from late 2023 onwards, given both rift zones were refilled to an eruptable state within a few months.
I also noticed that at least on the IRIS Earth Browser the deep earthquake activity at Pahala drops off very conspicuously about a week before this eruption, and only recently recovered to anywhere near the typical post 2018 level. While not proof of anything its pretty hard to ignore unless its an artefact, but it really doesnt appear to be.
If only HVO would release the geochemistry data itself instead of just saying what it means 🙁
Lava has also crossed the road on Reunion, first time in almost 19 years
https://imazpress.com/selection-de-la-redaction/volcan-22
Less than 700m to the ocean from this point
The current speed of the lava flow allows the prediction that it will do an ocean entry today or tomorrow. The lava tongue is only 150m away from the Indian Ocean.
https://www.linfo.re/la-reunion/faits-divers/volcan-la-coulee-figee-a-120-m-de-l-ocean-depuis-12h?fbclid=IwY2xjawQiccRleHRuA2FlbQIxMABicmlkETA3bW9iajhMRzBLOERGSXFBc3J0YwZhcHBfaWQQMjIyMDM5MTc4ODIwMDg5MgABHo5m7k7ulGm3AmS3y3fanC5E9OHA_CEWMx3TE4R2BZA7C5OCABI68KrbODpx_aem_4NIpmunhOsuk3bULz9o6Lw
The Indian Ocean just got a little smaller, finally.
Pu’u O’o had all in all 47 episodes until June 1986. E47 of Pu’u O’o had lava founatain “maximum heights of 225 m” and jets up to 550m height. This graph shows the deformation of “E48” that in fact turned out not to be an episode, but the beginning of the calm, steady longterm shield eruption of Kūpaʻianahā:
https://volcano.si.edu/volcano.cfm?vn=332010#bgvn_198601
Oh…. that has a happy suprise :). I live on Arafo…. If need some photos about actual Arafo 1705 eruption I can put some about them.
That would be really interesting. If you have some photos to share, we can add them to the post
For Jesper and other Io-files: https://www.youtube.com/watch?v=8pXlYhE6254 (Once Around Io)
Two scenic stills from the Kilauea – USGS cams (today).
Yes, it’s an example for the topic “Rain and Volcanoes”, a normal hydrothermal reaction of the hot lava field to strong rain. Did this event influence the tiltmeters of the summit?
The Hawaiian Islands are experiencing a weather phenomenon they call a Kona Low. All the islands are experiencing heavy rain and winds for several days now. Wind guests have been reported to 135 miles per hour. Some places have up to 20 inches of rain so far. Damage reported on many of the islands. Maui seems to be hit the hardest. Hana on the far east shore of Maui has been reported as cut off from the rest of the Island due to land slides and flooding. Possibly could see some snow on the peaks of Mona Loa and Mona Kea when the sun comes up
Yes, I saw a satellite photo yesterday with the impressive cyclone, it looked stronger than some tropical cyclones in the Hawaii region during summer.
The Kona Low explains some crazy variation of the tiltmeters. Sometimes it not the magma (and not the economy) but the weather.
Shiveluch with big ash plume (8km high) today:
https://www.volcanodiscovery.com/shiveluch/news/297662/Shiveluch-volcano-Kamchatka-yet-another-massive-eruption.html

Piton is taking a bath:
https://www.lequotidien.re/article/societe/2026/03/16/le-fascinant-spectacle-de-la-fusion-des-elements?fbclid=IwY2xjawQlBfhleHRuA2FlbQIxMABicmlkETBrY3Focm50eWpDRkJ3RlB1c3J0YwZhcHBfaWQQMjIyMDM5MTc4ODIwMDg5MgABHgFQ3nBdzEQIF-tKWV0gOegk_Dl9GESnR4zHNb4Mz2ANDFMGzNGN_ktCKo3p_aem_nEV1tlKlnD1tt2I6yhceNg

There is a cliff that allows the formation of a lava fall. Is it the greatest ocean entry since Pu’u O’o collapsed 2018?
Looks beautiful. What determines whether or not lava delta becomes new land? Does it have to pile up on the seafloor to the height of the crust, or is it just really floating?
In November 2021 the Cumbre Vieja eruption also reached the ocean and created quite a bit of new land. Not sure how much of that is still above the surface, but I would expect quite a bit may survive to this day…
Yep most of the delta still exists and the entry was very likely also larger than piton’s based on flowrate. Perhaps svartsengi could beat it if a massive flow manages to reach the ocean next time (whenever next time will be -.-)
Cumbre Veija likely had a higher speed/rate and a steeper slope than Piton/Reunion. But I have the feeling that Reunion has more endurence to erupt for a while.
Here is a video, where you can see some pictures of the eruption and can practice some French language skills … :
https://www.linfo.re/la-reunion/societe/la-reunion-la-fusion-entre-la-lave-et-l-ocean-pourrait-donner-naissance-a-la-plus-jeune-plage-du-monde
https://www.bbc.co.uk/news/videos/c23zj1e0lxmo
The speed of the lava flow/fall is more that of an A’a flow, although it is Pāhoehoe. The small rate and shallow landscape brake the speed much.
Update from an IMO lady:
More magma could mean a larger eruption (RÚV, 17 Mar)
Still doesn’t seem to be many tremors occurring around the Svartsengi area though. Which I would’ve thought would be occurring if the reservoir pressure is at its upper limit.
I think we can say that the Icelandic volcano with the highest probability to erupt next is Svartsengi. All other volcanoes have at the moment less inflation than Svartsengi.
I’d put it at 99% likely this year. Hengill has been noisy last 2 days, that’s currently having a nice bit swarm. Be interesting to see that rift activate as it looks to stretch as far as Skjaldabreid.
I had wondered if the swarm is due to water pumping for the big Hellisheiði geothermal plant which is about 10 km north of there. But from what I can see the geothermal field is northeast of the power plant, not south of it.
When the geothermal people do water injections that part of the IMO earthquakes map lights up like Las Vegas.
The new and improved Skjálftalísa tool has a lot of interesting map layers. One is jarðhitaborholur, geothermal boreholes. The nearest injection well is 6km away.
With Svartsengi, I think people are a bit too focused on just the accumulated volume. There’s also the plate motion to consider. Here’s my speculation:
The November 2023 earthquakes introduced a large shift in the plates. In such an event, the strain release is largest near the dyke, but over time, the viscoelastic response will spread the effect over a larger area. As that happens, the strain near the dyke increases again and creates the conditions needed for another dyke. Rinse and repeat.
At one point, there might not be enough strain for another dyke to happen, even if the magma volume in the sill is large. The plate spread that had accumulated over the last centuries has been all used up. The whole thing might stop, but there is another scenario. The sill sits between two historic eruption rows. One is of course Sundhnúkur, the other is Eldvörp. If there’s no longer room for another dyke at Sundhnúkur, could the sill find another weakness in Eldvörp and erupt there instead? There was a small swarm in line with the Eldvörp crater row a few weeks ago.
Don’t get me wrong. I still believe the most likely scenario is another eruption at Sundhnúkur.
I have to correct myself a bit, it seems my memory failed me. I went back to check the data and the swarm I mentioned was not directly in line with Eldvörp, but rather to the south.
The second Svartsengi graben formation (what label is correct?) of 1st April 2024 ocurred, when the accumulation of magma was very high, similar to the present situation. So it should be considered a possibility that the current state leads to a third graben formation.
The sill/dike of April 2024 was the magmatic base for the following actual eruption in July 2024. Maybe something like this is going to repeat with a new sill/dike now and an eruption over the location later.
A worst case scenario is, that this time it may happen in the SW close to Grindavik and do an eruption like Eldfell 1973. While the graben of April 2024 escaped to the NE, a new one could happen on the other side.
The question “what label is correct?” applied to sill or dike. I wasn’t certain about the decicion what label was correct for April 2024.
After 11 years one of the Vatnajökull volcanoes should be able to erupt again, although the deformation is to low now, but Iceland can change quickly.
Potential Hengill intrusion?
It’s been extremely noisy (and somewhat focused) for the past 3 days now.
Majority of the quakes are 5-8km down but there are a few deeper ones, and 5(?) less than 4km.
Here’s what IMO says:
Earthquake swarm near Raufarhólshellir (RÚV, 19 Mar)
Talking about volcanic islands here is some imagination.
FUN placing Iceland and the hotspot at latitude 13 – 17 N in the atlantic ridge. Iceland is the largest volcanic island in the world so at a tropical latitude in the trade winds a bit north of the equator you would get an incredible amount of different climate zones depending on altitude and wind direction in different parts of Iceland.
I think a little over latitude 10 maximizes climate variation through the trade winds outside the ITCZ but placing a bit south of latitude 20 prevents Iceland from getting too dry everywhere and too dry on the dry side while still maintaining the hot tropical heat and a wet and a dry side. The latitude of the area of Iceland then becomes 13N to 17N in the Atlantic I think. This maximizes climate variation without the dry side getting too dry? so a wet and dry side with several climate zones in between and within them. I want biology in both the dry and wet side.
The Wet Zone
I assume that the eastern part of Iceland near Vatnajökull and Myrdalsjökull would have the wettest climate in all of Iceland where the trade winds force up the sea air. There the lowlands would be covered by huge tropical rainforests (tropical lowland rainforest) with 70 m trees fed by orthographic precipitation. Large rivers at the Laki area fed by the highlands would feed large mangrove swamps on the coast where very rich endemic fauna. Very hot and humid during the day and hot and humid at night in the lowlands. Basically impermeable jungle vegetation
The rainiest would be the volcanoes in the highlands of Vatnajökull and Myrdalsjökull (Katla, Grimsvötn, öræfajökull and Bardarbunga which would get around 10 meters of rain in a year on the windward side. Here you will find the tropical cloud forest (tropical highland cloud forest) eternally foggy and mossy with 30 – 40 m trees and wet with millions of flowers and orchids and tropical birds. Warm and nice during the day and cool sometimes chilly and very humid at night.
The Dry Zone
I know that other parts of Iceland that lie west or north of the Vatnajökull – Myrdalsjökull area will have completely different climate zones compared to the wet side. When the air flows down from Vatnajökull and eastern Iceland it will warm up and it will have lost much of the water vapor it had on the leeward side. The dry zone will have several types of vegetation zones depending on altitude and wind direction or location by the sea. The dry sunny zones will be very varied and have a rich fauna. The dry side will be very varied and the largest zone
The inner plateau will be largely a sparsely populated ( tropical dry – savanna forest ) ( tropical dry forest ) with tall yellow grass during the long dry season and dense clusters of drought-resistant trees and bushes with occasional grass fires in the long dry season in winter. Hot and dry sunny during the day and comfortable and cool at night. This is on the high plateau below Vatnajökull. The rivers from the highlands will be able to feed gallery forests bordering the open forest savannah. The slightly wetter places on the dry side will feed (dense dry monsoon forest that loses its leaves in the dry season). Many of these forests also have Sclerophyllous features.
The driest areas on the lee sides of the plateau perhaps behind Langjökull and Hofsjökull highland forests will become savannas (tropical forest savannah) with scattered drought-tolerant trees but even here there is enough rain during the rainy season for a rich drought-tolerant fauna and flora. Hot during the day and mild and nice at night and quite windy. These strange tropical savannahs cover large parts of northwestern Iceland. They are dry enough for an almost Mexican savannah – dry forest with cacti and thorny trees. This zone will be a true paradise for reptiles and able to house/evolve giant tortoises, giant iguanas
Highland forests ( sky islands ) in the dry part of Iceland can be found in Langjökull and Hofsjökull.
While the lowlands around Reykjavík and on the northern plateau transform into a golden, dry Australian savannah forest landscape during the dry season, the higher volcanoes and mountain peaks of Langjökull and Hofsjökull and the highlands of the fjords remain intensely green oases called “sky islands” that host their own tropical cloud forests. Here, huge stands of Canary Island pines and, at the highest points, other trees such as Japanese cryptomeria that the islanders brought there would thrive in the wind and moisture and the mild heat.
Sandur plains with its soft lava sand woud host millions millions of coconut palms in this case in a line many 100 s of kilometers long and a few km wide. Imagine a drive along the Ring Road (Hringvegurinn) through miles upon miles of swaying 30 m – 40
tall slender palm trees with dramatic, mist-shrouded 1,000-meter cliffs covered with waterfalls and steamy vegitation as a backdrop. It would be the world’s most iconic road trip.
This was just recommended to me in my YouTube feed
https://www.youtube.com/watch?v=rK00tvzJ1Yc
”
149,462 views Feb 16, 2026
We went on an expedition to capture Kavachi, one of the world’s most active underwater volcanoes, erupting beneath the Pacific Ocean in the remote Solomon Islands.
This short cinematic piece showcases selected field cinematography captured during an expedition to the Solomon Islands
Steam explosions, sulfur-rich plumes, and superheated seawater collide in one of the most extreme environments on Earth.
Filmed and independently edited by Devon Massyn.
Shot on Sony A7S III and DJI Mavic 3.
Underwater volcano eruption | Kavachi Volcano | Solomon Islands | Pacific Ring of Fire | Submarine volcano documentary”
Is eastern Iceland having a fit or something?
The AI seems to have some problems with it. All over the place, really
There’s no AI (in the common sense of the word) involved.
IMO have recently switched to using the SeisComP software suite for earthquake analysis (and I am an experienced SeisComP operator) and I suspect they’re simply still fine-tuning the autolocation algorithm – looks like it may be accepting too many noise picks or marginal picks.
Thanks Mike. It looked to me like a problem with correlating events seen at different detectors: if two simultaneous spikes at different detectors are assumed to be one event that will be located midway between them. But I don’t know how the algorithm works. This particular swarm, could it be weather related?
“weather related” – bad weather – storms, heavy rain, high winds etc – tend to reduce the number of earthquakes detected, due to the increased background noise suppressing the detection of smaller events.
The algorithm is entirely user-configurable, both in terms of ‘what is an autopick?’ and in terms of ‘how many autopicks have to associate for an event to be created?’
The way we have implemented the system, it needs ten autopicks to associate to create an event; IMO’s setup may be different.
None verified
looks like Semeru had an eruption with a pyroclastic flow yesterday https://www.youtube.com/watch?v=kkw6sMUV3OY
Great new video of the ocean entry at Reunion (March 21, 2026):
On Kilauea’s summit the Kilauea Iki tiltmeter station has had the highest inflation after the recent episode. Did the recent storm falsify the data of other summit tiltmeters or is there an actual positive development in the Kilauea Iki region?
Show me the link to that tiltmeter the others in the caldera seems broken
The excursion on the ides of March will be from the rain
New post is up! America First?
https://www.volcanocafe.org/monte-verde-the-village-the-volcano-and-the-peopling-of-the-americas/