This is a repost from the archives, an older post by Henrik which has been updated to reflect more recent findings. Did you know there are 255 volcanoes or volcanic features listed in the US?

Sunrise at Mount Shasta with the satellite cone Shastina to the left (Wikimedia Commons)
Volcanic activity in North America is surprisingly infrequent. In spite of there being no less than 255 volcanoes or volcanic features such as maars or volcanic fields listed for California (20), Oregon (65), Washington (21) and British Columbia (149), situated on or adjacent to the Cascades Range and above the subduction zone where the last dregs of the Farallon Plate is disappearing beneath the main continent and the Juan de Fuca plate knocking on the door, there have only been some 20 eruptions or periods of eruptive activity over the past 1,000 years. This is a surprisingly low number for the Ring of Fire and if we compare with Alaska, Japan, the Philippines or Indonesia, we can only surmise that the entire Cascadian Arc with its associated volcanic fields is in a quiescent phase.
Located at the southern end of the Cascade Range in Siskiyou County, California, the 4,322 metres high (14,179 ft) Mount Shasta is ranked as the second highest peak of the Cascade Range, after Mount Rainier. It rises 2,994 metres (9,822 ft) above the surrounding landscape and has an estimated volume in excess of 350 km3 (85 cubic miles) which makes it the largest of all Cascade volcanoes, ahead of the similarly sized Mount Adams and the imposing Mount Rainier which towers above Seattle. It is mainly composed of silicic andesite to dacite.

Shasta, Shastina and in the foreground, Black Butte, tiny in comparison in spite of rising more than 600 m above the surrounding landscape itself. (summitpost.org)
Mount Shasta is composed of four overlapping cones, or five if you count the destroyed cone of ancestral Shasta, which together form the main peak Shasta and the satellite cone Shastina. At 3,760 metres (12,330 ft), Shastina would rank fourth of the Cascade peaks if it were recognised as a separate mountain. Nearby is a 9,500 year old dacite lava dome associated with Mount Shasta, Black Butte. In it’s own right, it could be considered to be a large mountain as it rises more than 600 metres above the plains to the NNW of Shasta, even if it is dwarfed into insignificance by Shasta and Shastina in the background.
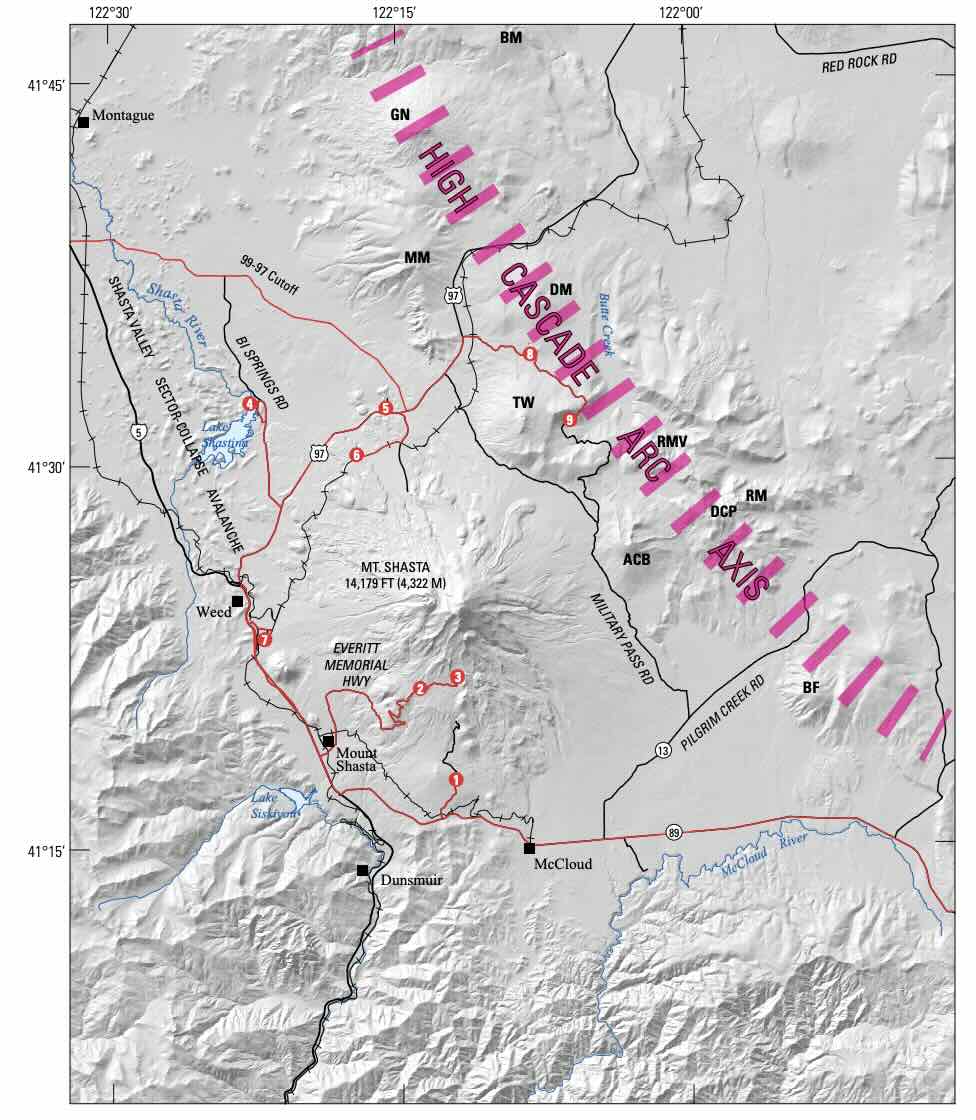
Mount Shasta located west of the High Cascades, a volcanic arc 100 km long and 15 km wide with many individual volcanic features such as Deer Mountain and Rainbow Mountain. These are mainly monogenetic vents (erupting only once) or short-lived shield volcanoes which were active for no more than 10,000 years. Mount Shasta is surprisingly different. It lies no more than 10 km from the High Cascades but has been active for half a million years. It shares this with nearby Medicine Lake Volcano, 1 million year old and still going strong, on the opposite side of the High Cascades. It is curious that there are such different volcanic styles so close together.

Mount Shasta often experiences strange weather phenomena. Here, Shasta is hidden by lenticular clouds whereas the cone of Shastina is clearly visible. Visible also in the foreground is the remains of the absolutely massive debris avalanche dated to between 300 and 380 kA that resulted from the collapse and total destruction of the ancestral cone. (summitpost.org)
Before we move on to have a look of the geological history of Shasta, it is worth noticing that because of the meteorological conditions, quite often a difference of 60C or more between the valley to the north and the mountain peak, Mount Shasta is often accompanied by strange cloud formations. Is it surprising then, located in California as she is, that she is a favourite with UFO-ologists with claims such as the one that there is a portal located on Mount Shasta from which alien spacecraft appear periodically…

The landscape left by the gigantic flank collapse and subsequent debris avalanche dated to between 300 and 380 kA. The peaks of Shasta and Shastina tower above the landscape and to the right Black Butte right at the foothills of Shasta is clearly visible. (John Scurlock, pbase.com)
Even if there is evidence of much earlier volcanism in the area, activity at Mount Shasta is thought to have begun about 590,000 years ago and is divided into four distinct periods. The first cycle, which lasted about a quarter of a million years, saw the building of the ancestral cone from mainly andesitic lavas and ended with its destruction somewhere between 300 and 380 thousand years ago. The cone of ancestral Shasta, which was probably similar in size to the current mountain, was almost completely destroyed by a sector collapse of truly epic proportions. The total volume of the collapsed sector is estimated at 45 km3 and covers an area of about 675 square kilometres with a maximum extent of 49 kilometres to the north. Some of the “boulders” carried down by the avalanche still protrude more than 100 metres above the avalanche deposit floor! As a comparison, the debris avalanche from the 1980 sector collapse of Mount St Helens had a total volume of about 2.5 km3 and reached 23 km down a river valley. There is no evidence of contemporary volcanic activity, thus the cause of the avalanche remains unknown.

Shasta’s peaks: SR – Sargents Ridge 250kA, MH – Misery Hill 130 kA, Sh – Shastina 9.5 kA. The current summit, the Hotlum cone is younger than Shastina.
After the sector collapse that destroyed ancestral Shasta, there seems to have been a hiatus of between 50 to 130 thousand years after which the oldest of the four cones that make up modern Shasta, the Sargents Ridge cone, began to grow less than a quarter of a million years ago. Today, what remains of this cone which has undergone two periods of glaciation is visble on the south side of the mountain. What today is the main edifice of Shasta, the Misery Hill cone, began to grow about 130,000 years ago and has suffered one period of glaciation. The final two cones are both Holocene. The truly massive satellite cone Shastina was formed over a period of merely 300 years between 11,00 and 10,700 years ago while the present summit, the Hotlum cone is younger even if it may overlap Shastina in age. A small craterlike depression in the summit dome contains several small groups of fumaroles and an acidic hot spring. The extrusion of these domes was accompanied by pyroclastic flows which extended more than 10 kilometres south and 5 kilometres north of the domes. The oldest pyroclastic flow from Shasta is dated to 11,000 years ago. It formed the red banks just below the summit, and is of course called the Red Banks eruption. The debris from this extends across much of the current mountain.

“Mount Shastina”. As is clearly visible from this picture, Shastina is a highly impressive volcano in its own right. Notable is that it grew in a very short period of time, 300 years, just under 10,000 years ago. (lakeshastina.org)
Shastina is a stratovolcano composed of silicic andesite flows and dacite plugs and has a topographic prominence of over 137 metres (450 ft) as measured from the saddle that connects it with Shasta. This easily exceeds the typical mountaineering standard (91 metres or 300 ft) for a peak to qualify as an independent summit, yet for some peculiar reason, this is not applied. As Shastina towers at 2432 metres (7979 ft) above the surrounding landscape, I personally feel that Shastina is hard done by. In comparison, Vesuvius is no more than a 1,281-metre midget of a volcano. The most amazing aspect is that this entire cone of 15 km3 grew within 300 years (immediately after the Red Bank eruption). It ended with the formation of a number of dacitic domes, each of which self-destructed explosively.

The impressive dacite lava dome complex Black Butte as seen from Interstate 5. Anyone fancy a ride? (geocaching.com)
The next major feature of the Shasta complex is the parasitic dacite cone complex that makes up the 600 metres high Black Butte, 13 km northwest of Shasta. This formed immediately after the end of the period of activity that created Shastina, and finished within 150 years. The period is so short than C-14 dating can’t resolved it, but we know from the magnetic field orientations that Black Butte formed just after Shastina. The Hotlum Cone formed after this, some 9½ thousand years ago, although its oldest eruptions may have been at the same time as Shastina.
Over the last 10,000 years, Shasta has erupted on average once every 800 years. The most recent eruption at the Hotlum cone, the present summit of Shasta proper, was thought to have occurred as late as 1786 A.D. based on a report of an eruption cloud seen by La Perouse for a sailing ship off the coast. However, no ash has been found that could be dated to this period. It is now thought that Perouse saw a grass fire: the eruption has therefore been removed from the volcanic record. The most recent eruption is now thought to have occured
3200 years ago. Shasta seems to erupt in phases of frequent activity lasting perhaps 1000 years, followed by quiet periods lasting 3000-5000 years.
The more recent eruptions appear to have been small, something that cannot be said for the eruptive period of c. 9,500 years ago – andesitic lava flows, dacitic lava dome extrusions accompanied by large pyroclastic flows that reached up to 20 km from the volcano and formed the current summit complex, the massive Shastina as well as Black Butte. Mount Shasta is now rated as number 5 on the list of most dangerous US volcanoes. The main danger may be from mud flows which could travel far and fast. Often, the danger of volcanic eruptions are dwarfed by their side effects. And do remember that we do not know what caused the collapse of the ancestral Mount Shasta.
Henrik
Suggested further reading:
Shasta geology – Geologic Field-Trip Guide to Mount Shasta Volcano,
Northern California
Shasta volcanic hazards – https://www.usgs.gov/volcanoes/mount-shasta/science/hazards-summary-mount-shasta
Black Butte – http://www.soest.hawaii.edu/GG/FACULTY/JHAMMER/documents/McCanta_JVGR_2007.pdf
Henrik – Henrik Lovén 1958-2019


Well, I just found this video concerning Mt. Shasta: https://www.youtube.com/watch?v=kf–E29ScbU But the approach is not very geological… The presenter misses the point that surely it has been the active volcanoes in Mediterranean region that have inspired the idea of “hell” with its ever-lasting fire.
It is not clear where this idea of ‘hell fire’ came from. It wasn’t Hebrew or Greek and appears first in later Roman times, 3rd century or so. That could indeed mean it was based on a volcano, as Italy has some fiery ones. The closest lava lakes are too far, in Afar, but Stromboli can be pretty impressive. The Greek Hades is never associated with fire and neither is the Jewish Sheol.
Vesuvius has probably had lava lakes in the past 2000 years, it did in one video filmed in the early 20th century I remember seeing. It was well recorded after 79AD but maybe only significant events got mentioned separately, I wouldnt be surprised if it had more persistent activity between those sometimes.
Etna also has probably had lava lakes at times. Today it has massive fountains and cone building but far as I know it was rarely like this historically to the point it was awe inspiring when it happened. Theres also many records of historical vents opening way further out from the summit than typical recently, as well as being entirely effusive. That sounds a lot like a volcano with a lava lake. Especially before 1669 there was very likely something up there and probably something massive going on how big and unusually fluid the start of that eruption was.
Theres also the Underworld, and Hades/Pluto. Not hard to draw the connection, even if theres not much in common in the lore.
I also expect there is very likely an element that is entirely original
Hades is a fairly well-behaved god in greek mythology. His domain is depicted as gloomy but there is no heat or fire. Pluto is actually a god of wealth – mineral wealth. So no, that connection is far from obvious. It is more obvious that there is no connection. That takes it back to Rome, but I am not aware of any claim for lava lakes in any of the Italian volcanoes. There is heat, obviously and volcano and refinery are closely linked. But that does not go with hell, an entirely different concept. The Middle Ages were very good at it (see Dante’s divine comedy) but the source seems to be in the 3rd century. There are some claims for older Persian connections but Persia had no obvious volcanoes either. Bit of a mystery. But perhaps one of our readers knows more!
Theres lots of less direct reasons why a god of the underworld might be viewed as a demon, even if much less malevolent in original context. Christianity often demonized the older faiths either by law or by making it taboo, and what else in Christianuty us also taboo…. Eventually this was worldwide just the Romans were the first to adopt it widely. Also the ones who accidently created it too…
I only bring it up because most people literally think Hades and Satan are the same, it doesnt take much research to find otherwise but most people wont do that research.
I am a bit astonished. It came clearly from the Bible:
https://www.openbible.info/topics/hellfire
And Christianity became the state religion under Emperor Constantine in the fourth century.
The original idea therefore might come from Sodom and Gormorrha which might have a real background.
In case the authors had seen or heard of lava lakes it might have been in the Afar Triangle – Erta Ale.
The Egyptians might have been there at the time of Moses:
https://www.oasiscenter.eu/en/moses-pharaoh-and-the-dam-the-dispute-between-egypt-and-ethiopia
Different terms. Sheol, the place of the dead, is not associated with fire, e.g. the story of Lazarus. Gehenna is, but is a place of cremation. (The origin of the term is not fully clear.) Both terms can be translated as ‘hell’ but they are very different. The ‘lake of fire’ is only found in later writings and may have an origin in Egyptian mythology. The three terms were connected only in Rome in the 3rd century.
Zoroastrianism (Persia) was probably a root for the idea of “Hell”. During the Exile of Jews, they got some inspiration by Zoroastrianism.
Hekla’s being noisy.
Not really Hekla, but the south Iceland seismic zone (SISZ). This spot, near 20°W, is one of the prime candidates for the next large quake, with possible magnitudes up to between M6-M7.
Thank you for the correction. Too starved volcanic goodness
Does the SISZ react to the awakening of West Iceland’s volcanism?
No, not really. It is too far away
Reykjanes fault transitions directly into the SISZ, its hard to say they are not influential on each other. Even a casual look at the earthquake maps shows they are almost industinguishable.
But that is a tectonic connection, not a volcanic one.
I agree with Albert, it’s too far away to be directly linked. Any direct stress transfer is only local. Look at the quake distribution during the dyke intrusions to get a hint. You get the obvious intense swarm along the dyke, and then you get trigger quakes some 20-30km away. Go beyond 50km, and the effects are diminishing.
Im not implying a short term connection but with Reykjanes being so active after a couple decades the movement could be compounded. Its still pretty early, and the two volcanoes to erupt so far dont have the longest fissure swarms. Krysuvik is probably the biggest rifting volcano, while Brennisteinsfjoll is the biggest volcano in general. Hengill might do the biggest fissure eruptions if it actually joins in but it skips most cycles.
If any or all of those 3 erupt there could be much greater movement.
What other signs can indicate that the Western volcanism (Reykjanes peninsula, West Volcanic System, Snæfellsnes volcanic belt) enters a period of high activity? The last eruptions of WVZ and SVB happened during Reykjanes Fires. This looks like a positive correlation.
Its different really, Reykjanes is the primary plate boundary, but south of Þingvellir it goes over to the east volcanic zone. So they arent really similar. Most of the Wesyern zone is pretty old and either dying or in a liminal period between more productive times, while Reykjanes is the youngest part of Iceland and, with rare exceptions, the only place lava flows actually reach the ocean. Its the youngest part of Iceland. Though still well over a million years old in many parts, but flat surfaces are almost all Holocene lava.
Open question: Is there a solid way to calculate volcanic strain in relatively precise numbers? How would we quantify it?
Higher than Matterhorn! That’s a lot for a volcano. The non-volcanic base is around 3500 feet high, that’s around 1066m. So the volcanic cone is more than 3km above the original landscape.
Ash Creek Butte (2,554m high) is the next major extinct volcano near Mount Shasta. Here is a 3D 360° view from Ash Creek Butte peek, including Mount Shasta: https://peakvisor.com/peak/ash-creek-butte.html?yaw=-96.33&pitch=-11.65&hfov=89.98
Really?
Mount Shasta height: 14,179 ft (4,322 m)
Matterhorn height: (14,692 ft) 4,478 metres
Lewotobi Laki-Laki had a big eruption today with an ash column reaching 18 km in height. https://twitter.com/badangeologi_/status/1942080904551436398
I’m wondering what this volcano is capable of in terms of VEI. Will this escalate (this centainly isn’t the first eruption in the last year) or slowly die down?
That could be a big one. Luckily the area had been evacuated already. The main risk is that people may have gone back into the evacuation zone, for instance to care for their crops
After a cursory glance, can’t find any known eruptions exceeding VEI 3 on Volcano Discovery, GVP, or LaMEVE. We may be looking at the largest known to date. Would be able to admire it more if it weren’t in a populated area.
Still, mighty impressive.
It looks like a short-lived explosion; vulcanian style may be an appropriate description. I’m guessing most of the material was ejected in less than a minute. It seems to have done a bunch of these already, although this is the first time I’ve seen such a neat video of it:
https://x.com/RenderNature/status/1942095492344844458
Woooah Black Butte, bam-ba-lam
Thanks for reposting this. I remember it well…any info on Shasta etc. is greatly appreciated…and I learned a lot from this.
Every morning I get the privilege of gazing on Shasta from my back deck. She is the soul and heart of far northern California, though Mt. Lassen and Medicine Lake are closer. Having spent considerable time hiking/camping/fishing all around her, I’ve never climbed to the summit. But the real “draw” is the inescapable “energy” that is associated with the mountain. Native American’s built entire cultures around the mystique and “energy” that the mountain generates…and I for one have experienced that energy on more than one occasion. Mindyou, I’m not religious (in a classical sense) and tend to discount tales of weird forces, gods, and such…but there are distinct locations where the mind is released and a sense of clarity and well-being envelopes the conscious and subconscious mind in ways I can’t explain. Only one other place have I felt that kind of energy was near Sedona in Arizona. But for some reason, that energy was quite different in that I actually got sick and disoriented until I left the immediate area then quickly returned to normal. In a way, it was frightening and still is to this day since I have no explanation whatsoever for what happened.
And of course, there are the equally mysterious Lemurians. Why they chose Shasta as their home, I don’t know…but they must have had a good reason! Those who are in the know say Shastina is actually a pile of debris made by the Lemurians when they were clearing out the middle of Shasta to live in.
But that’s a different story.
“it was frightening and still is to this day since I have no explanation whatsoever for what happened.”
Aliens.
Inner ear infection.
Mundane, but …
People are affected by their surroundings in different ways. I remember seeing the little penguins coming on to the beach on the Great Ocean Road once, deep into twilight. Loved it, and no ear infection required.
Have we crossed the first tipping point? A not-so-good-looking situation at the south pole.
https://www.pnas.org/doi/10.1073/pnas.2500440122
Anyone want to buy a house with a view?
Insane asking price for Hawaiian home on active volcano (8 Jul)
Although from the photo it looks like you’ll need a jackhammer to mow the lawn.
https://www.realestate.com.au/news/wp-content/uploads/2025/07/capi_eaef837f91a1ac3e49407c655c23fe3c_ca9f9d8b7815b53919b2f4cd1827e977.jpeg
109K USD is not *insane* in the US market. I think it’s reasonable that I could get a 50-year lifespan out of it before it’s inundated again, because the insurance premium is what would kill you.
Myself, I’d love Ocean View, hard by ML’s SWRZ. Too many drug dealers, though.
It is insane compared to our Aussie house prices. Insanely cheap!
You’d need more than a million US to buy a basic house in Sydney. Even my city Newcastle is getting pricey. You’ll be paying US$400,000 for a house in my street, and mine is one of the cheapest suburbs in what has historically been a grotty industrial city.
But build prices for stick built are very reasonable.
Australia is weird, the cost of living isnt cheap, but an income of 50k AUD as an individual is easily sufficient to be comfortable. But equally, at that income its absolutely impossible to buy a house in any slightly desirable or convenient location…
Somehow we have a situation where you can live like a king but still be at risk of homelessness…
Source, me, right now… I have a car I fully own, and no shortage of access to all sorts of luxuries, even considering going to Hawaii next year again. But a house is a distant goal, even a shed in a field outside a capital city costs more than that house on Kilauea after conversion…
With so many electric and PHEV large vehicles in Australia now, many fast becoming very affordable, I think the ‘van life’ thing will take off again. Carry around solar and it is cheap off grid.
https://bydautomotive.com.au/sealion-6
Take the back seats out of this and it is basically a van, lots of these around now too so get one for 20k in a few years 🙂
So is there a shortage of land with permission to buikd?
I wish I knew the answer. To be honest, I think its just cashed up people who sold land in Sydney and Melbourne and overpaid on cheaper accomodation elsewhere, paying 300k for a 250k house is cheap if you have 1 million at hand.
Problem is, no one wants the market to crash, most people are on loans, so imply building a million new houses isnt possible without political suicide unfortunately. Also, car centric urban sprawl is another way to say Australian city design… And we have an obsession with huge vehicles as private cars now too, at least most new ones are electric so the air is breathable but still.
The Great Dividing Range is a driver of a lot of this, since people like living on the coast. The coastal strip along the whole coastline of eastern Australia is quite narrow, and that means limited land for housing. We also have a high immigration intake, and immigrants tend to like living in the cities like Sydney. Which puts more pressure on real estate prices.
I think in the long term this will change, because of the move to internet enabled work. With Elon’s Starlink you can theoretically work from anywhere. And here in Australia the house prices in the center of the continent and places like western Tasmania are vastly cheaper than in the popular cities of Melbourne, Brisbane and Sydney.
If I was a Sydney houseowner I’d sell up, move to the west coast of Tassie and put the couple million I got from selling my house onto the sharemarket and never have to work again. Surprising that not many people seem to want to do that.
(I own my house by means of having bought it 34 years ago. I don’t want to move since I have turned it into a hobby. This fine morning I am being entertained by the musical sounds of many birds. It’s nice.)
Bruce, West Tasmania is very isolated. It takes longer to drive to Strahan (only place on that side that might be worth living in lol) than to cross the whole island on the main highway, the road is 100 km/hr but only possible to go over 70 for half of it, and at times it is impossible to go over 50 km/hr. I know because I did it last year and drive to the north of the state every other month… I have considered buying a house there one day but its only viable if you have mobile work or no need to work in general, if you want to go to Hobart it is a full day trip minimum.
I would prefer not to have more people pricing the entire state out of the market for its local residents, to be honest
Chad – I’ve lived in Hobart and done work in western Tassie. Pretty place. Wet.
Speaking of tipping points…Here is the June 2025 update from dell’Osservatorio Vesuviano at https://www.ov.ingv.it/index.php/monitoraggio-e-infrastrutture/bollettini-web
“During the month of June 2025, 513 earthquakes with a maximum Magnitude = 4.6 ± 0.3 were recorded in the Campi Flegrei area. Of these, 444 events (86.55% of the total) had a magnitude less than 1.0 or not determinable due to the low amplitude of the signal not clearly distinguishable from the background noise, 54 events (10.53% of the total) had a magnitude between 1.0 and 1.9, 11 events (2.14% of the total) had a magnitude between 2.0 and 2.9, 3 events (0.58% of the total) had a magnitude between 3.0 and 3.9 and 1 event (0.19% of the total) had a magnitude ≥ 4.0. In total, 370 events were located (~ 72% of those recorded), mainly located between Pozzuoli, Agnano, the Solfatara-Pisciarelli area, Bagnoli and the Gulf of Pozzuoli, with depths concentrated in the first 3 km and maximum depth of about 4 km.
Since August 2024, the mean value of the uplift velocity in the area of maximum deformation has been about 10±3 mm/month at the RITE GNSS station. Between 15 and 16 February 2025, a maximum uplift of about 1 cm was recorded at the stations in the area of maximum deformation, with values rapidly decreasing away from the center of the caldera. Data following the seismic swarm of 15-19 February showed an increase in the ground uplift velocity, with a monthly mean value of about 30±5 mm/month until the end of March. Since the beginning of April, ground uplift has continued to be recorded with a monthly mean value of about 15±5 mm/month.
The uplift recorded at the RITE GNSS station is about 148 cm since November 2005, of which about 29.5 cm since January 2024.”
If you look back at the 1984 “seismic swarm”, Campi Flegrei has currently blown way past that level with sustained earthquake activity and deformation since 2005. June’s 4.6 Magnitude Earthquake is the largest since she woke up from her 406 year slumber following Vesuvio’s last gasp eruption in 1944 ending the open conduit era with 313 years of almost continuous activity since 1631. 2024 set a record with 4900 earthquakes in the area. Only halfway through 2025, Campi Flegrei has had 3977, or over 97% of the 2024 number.
In 2023, I stared down into Solfatara at the baked vegetation and then looked out at all the buildings and thought that this is the next “big one” considering it is right smack dab in the middle of a large population center. I am not saying it will have a caldera forming eruption that may have been the final nail in the coffin of the Neanderthal 39,000 years ago. But with activity clearly accelerating, a VEI 4 or 5 in the Gulf of Pozzuoli would smother the greater Naples area in ash.
I will leave the commentary to the experts here at VolcanoCafe and would welcome thoughts on the subject.
Campi Flegrei is pretty scary, recent studies have shown that crust covering the volcano is reaching it’s limit and with these escalating pulse-swarms and ever-increasing deformation, I’d imagine it’s getting close to erupting now. The main cause of the current unrest is widely considered to be a relatively small shallow sill with only 0.04-0.06 km3 of magma, with a larger shallow chamber at 7 km depth. Long and intense unrest periods are standard for Campi Flegeri, even for smaller eruptions, and given this volcano’s history, I’d say a VEI 3 is the most likely event for this volcano.
BUT, as the shallow and even deeper chambers have been restless in the 5,000 years with the whole volcano rising 60 m, it’d be disingenuous to dismiss the possibility of a VEI 4 or 5. If the shallow chamber throws a large enough dike with the crust weakened, things could quickly go bad for this volcano. It’s a serious possibility. Thankfully, unlike some other(!) agencies, the INGV is on top of this volcano and Campi Flegrei is probably the most well-studied caldera on the planet right now, so I am cautiously optimistic about it’s future and I doubt anything would sneak through us.
In the dense populated neighbourhood, even a small Phreatic or hydrothermal explosion (VEI1-2) can be a disaster. Small events like this are likely less predictable than bigger eruptions.
Differing view of the situation.
https://wattsupwiththat.com/2025/07/06/ocean-reversal-hysteria-facts-not-included/
“And when I got to the study, what do you know? The study doesn’t mention “tipping point,” “collapse,” “current reversal,” “Southern Ocean current” or even “overturning circulation.” The only “reversal” in the paper refers to satellites detecting a reversal in surface salinity trends from decreasing to increasing, not a reversal in the the direction of the Southern ocean’s most complex circulation shown above.
So what did the study actually say? Here’s the paper’s abstract:
“For decades, the surface of the polar Southern Ocean (south of 50°S) has been freshening—an expected response to a warming climate. This freshening enhanced upper-ocean stratification, reducing the upward transport of subsurface heat and possibly contributing to sea ice expansion. It also limited the formation of open-ocean polynyas. Using satellite observations, we reveal a marked increase in surface salinity across the circumpolar Southern Ocean since 2015. This shift has weakened upper-ocean stratification, coinciding with a dramatic decline in Antarctic sea ice coverage. Additionally, rising salinity facilitated the reemergence of the Maud Rise polynya in the Weddell Sea, a phenomenon last observed in the mid-1970s. Crucially, we demonstrate that satellites can now monitor these changes in real time, providing essential evidence of the Southern Ocean’s potential transition toward persistently reduced sea ice coverage.”
“In any case, let’s translate the actual science: For decades, the surface of the polar Southern Ocean (south of 50°S) was getting fresher—a little less salty—thanks to melting ice and increased precipitation, which the climate modelers assured us was exactly what a warming world would do. But then, around 2015, the trend did a U-turn. Suddenly, the surface started getting saltier, not fresher, and sea ice coverage dropped like a rock. The study’s main points? Satellites are now good enough to watch these swings in real time, and the ocean’s surface salinity is a lot more jumpy than either the models or the scientists predicted.
Mac
https://en.wikipedia.org/wiki/Watts_Up_With_That%3F
In reality, the paper does use the words ‘critical transition’. The issue is that the sudden change in salinity indicates more mixing of surface and deeper water. That brings warmer water down, and increases ice melt. Indeed, we have seen a change in this. The paper indeed states that we need the data, that these effects are not well accounted in the climate models and that satellite data can monitor this. It makes no prediction how this will develop in the future but adds data that the models need to be able to fit. So it does not predict imminent disaster, but it does flag warning signs. The watts blog conveniently ignores that part of the paper.
Squonk
Did you read the article? Willis did acknowledge that the satellite information was important, and the changes in salinity were important, but some of these changes also occurred in the 70’s . He was mostly addressing the hype in main street news on what the paper did not say. Wattsupwiththat.com is an open forum, you can comment in any article that is posted there. I will enjoy your opinions.
https://wattsupwiththat.com/
Macusn
The primary function of that site is to deny that human produced CO2 is responsible for global warming and will twist everything to fit that narrative. Analysis and debunking of claims made at WUWT have appeared regularly over the years at https://www.realclimate.org/ which I would highly recommend over Watts blog.
You’re both right. This was discussed extensively on Bluesky.
“Watts Up With That? (WUWT) is a blog promoting climate change denial” – this is correct, which makes it irrelevant to us. I advise you not to mention it here again if you wish to be taken seriously.
The PR release which accompanied the paper under discussion was… poorly derived from the paper (and I’m being charitable here).
Ruapehu is a bit lively – 90 events over the last ~12 hours, and many many more not triggered in the system. Appear to be VT, not especially shallow – mostly ~20km-30km depth, and not under the edifice – mostly under the east and northeast flanks, between the Desert Road and the maunga, for those who know the area.
Probably a deep intrusion, likely a precursor to an eruption in the nearish future.
The area could be one to watch, Tongariro erupted frequently until the 70s but only once since and it was barely involving magma. There is clearly a strong magma supply, but nothing erupting for almost 50 years.
Ruapehu also hasnt erupted all that much, not magma anyway. Yet the two appear to be peaks along a huge fissure, like Hekla but 10x bigger. The next real eruption could be a big deal, maybe a VEI 5 mixed explosive effusive fissure eruption, probably with massive lava fountains.
Nonsense. There’s no such fissure – they’re two separate magmatic systems. And Ruapehu hasn’t done anything bigger than a VEI 3 in the last few thousand years; the considerable majority of eruptions have been VEI 1 or 2.
If there was a “strong magma supply” we would be recording corresponding deformation and seismicity. We aren’t.
Its not a fissure that connects them, its a tectonic trend, probably should have clarified.
Tongariro is most certainly very north south aligned though, I made a map of the vents a while back on google earth though it is now lost. Its not a neat fissure volcano like Mauna Loa or Hekla, but its very directional. Historically for as long as records were kept it was an open volcano erupting frequently, not the case now, we dont know how a longer interval ends and its reasonable to expect the trend to deviate a lot.
The comment on magma supply is that it had to be high enough to keep erupting most years historically up to the 70s, and the mantle isnt just going to stop melting, it is accumulating somewhere. If it is deep then deformation will be very minimal at the surface, likely undetectable if there is any other variable, and extending over a huge area at the same time.
Everything in that area is SE-NW aligned as it’s all caused and controlled by the Taupo graben – that’s the controlling structure for the entire TVZ:
Your comment on magma supply presumes that magma generation occurs at a constant rate; is there evidence for this in the TVZ?
I had presumed it did have constant magma generation. With possible exception of the Andes, large rhyolitic volcanoes dont seem to be possible without high magma flow to provide the required heat. Tongariro and Ruapehu arent at that point (yet?) but it seems likely there is rift propagation in the TVZ which would probably involve strong magma generation.
I might well be wrong, but I havent seen anything saying magma generation isnt constant in powerful rifting arcs like this. If there isnt significant sinking of the ground it would imply magma below keeping it up, I guess.
I havent read all of it in detail but this paper has some good info.
https://www.naturalhazards.govt.nz/assets/Publications-Resources/4633-The-volcanic-and-magmatic-evolution-of-Tongariro-volcano.pdf
Its not a rifting fisdure exactly but its also not exactly a standard stratovolcano either, and seems to be more mafic in general than tbe typical quick answer Google gives, its variable though.
The fact the last eruption,tiny as it was, happened at Te Maari craters instead of Ngaurahoe might have implications on future activity, more northerly focused activity perhaps.
Heat and magma generation are related but not quite the same thing. Heat comes up with the updraft in the mantle. That may cause some melt (normally a very low melt fraction) some of which percolates up. In a rifting situation, the mantle flow turns sideways, away from the rift. As it flows sideways, the melt refreezes. At depth, the magma generation will be fairly constant. But only a fraction of that moves up in the crust, and much may solidify there. In the crust, magma supply becomes episodic and can be negative.
Interesting! Is this behaviour similar to that before the 1996 eruptions? I guess the crate lake temperature will be monitored. Is the volcano-cam (you see I read wikipedia) still active?
I wasn’t in NZ back then, but I don’t believe it’s similar to 1996 – mostly on the grounds of the depth and location of the events. And there’s nothing to suggest magma is involved, they’re pure VT events AFAIK (I’m off-duty right now). I skeeted the earthquake locations earlier today:
https://bsky.app/profile/eruptionchaser.bsky.social/post/3ltg7oryi322h
We have a collection of webcams, some of which are pointing at Ruapehu:
https://www.geonet.org.nz/volcano/cameras
There was a scheduled sample collection flight to Ruapehu crater lake just today – great timing! – no chemistry results yet, but the lake had extensive sulphur slicks, and a strong smell of sulphur – not unusual. No disturbance to lake surface. The lake temperature is currently cool, and cooling. Perfect conditions for the flight, and some beautiful pictures of the lake.
Fun! Of course if both the depth and the location are different, then there could still be a connection as long as it is not vertical! As you say, it is known for minor eruptions and there seems to be a good warning system in place. I am curious how it would take (if it does) to reach the lake. It seems quite deep though
Here’s a couple of papers to whet your appetite:
Analysis of seismicity in quiet versus eruptive periods by my colleague Steve Sherburn: https://www.sciencedirect.com/science/article/abs/pii/S0377027399000141
And an illustration of a conceptual model of Ruapehu:
https://www.researchgate.net/figure/Mt-Ruapehu-volcano-conceptual-model-on-two-scales-A-South-to-north-cross-section_fig4_361119048
Which I like to look at every day! I was amused that Geonet wrote an activity bulletin about White Island yesterday saying it is quieting down. Then this morning I looked at the cameras…she’s hottened up again. No ash but quite a decent plume of steam. Volcanoes never do what you expect them to do.
When you see a difference in the appearance of a steam plume, the number one suspect for the cause of the difference is ‘atmospheric conditions’. The appearance of the same plume can change quite radically with the wind, the temperature, and the humidity – with no change in source conditions.
So it’s possible she’s “hottened up again” – but it’s far from the likeliest explanation!
Do they still measure the temperature of the crater lake?
On 7th July was a Magnitude 6.3 quake south of Southern Island. Probably independent from the volcano on the Northern Island.
Yes, we do – in fact the equipment got a major upgrade this summer:
https://www.geonet.org.nz/news/2ZnLCu2YGOAEiv3l55SYJy
And absolutely zero connection between the Snares Island event and the volcano; they’re several hundred miles apart!
Kilauea is starting another episode
Looks like one of those precursory episodes that usually come before a true fountaining episode. However, this would mean it could start in little as half a day to a max of 2 days (48 hours). Since this started about almost 3 hours ago, I will bet it’ll either start today or Thursday…
Yes its gas pistoning, fire, and strombolian eruptions. E28 might be tomorrow which is the 8th locally.
Shallow swarm at Rainier. (If it were deep to intermediate, I’d be concerned…)
If it decides to wake up now it would sum 2025 up perfectly lol.
MOUNT RAINIER (VNUM #321030)
46°51’11” N 121°45’36” W, Summit Elevation 14409 ft (4392 m)
Current Volcano Alert Level: NORMAL
Current Aviation Color Code: GREEN
On July 8, 2025, the U.S. Geological Survey Cascades Volcano Observatory (CVO) and Pacific Northwest Seismic Network (PNSN) detected a swarm of earthquakes at Mount Rainier starting at 01:29 PDT (08:29 UTC). So far, hundreds of earthquakes have been detected with event rates up to several per minute, ranging from depths of 1.2 – 3.7 miles (2-6 km) below the summit. The largest earthquake located thus far is a magnitude 1.7.
Currently, there is no indication that the level of earthquake activity is cause for concern, and the alert level and color code for Mount Rainier remain at GREEN / NORMAL.
Recent activity
Beginning at about 1:29 AM PDT (8:29 UTC) on July 8, a swarm of small earthquakes began near the summit of Mount Rainier. The Pacific Northwest Seismic Network is locating earthquakes with the largest so far being a M1.7 at 04:52 PDT (11:52 UTC), ranging from depths of 1.2 – 3.7 miles (2-6 km) below the summit. There are hundreds of small earthquakes occurring at rates of up to several per minute at times. No earthquakes have been felt at the surface.
Instruments do not show any detectable ground deformation at the volcano, and no anomalous signals have been seen on the infrasound monitoring stations. Mount Rainier does not have a dedicated continuous volcanic gas sampling capability.
Typically, earthquakes at this volcano are located at a rate of about 9 earthquakes per month. Swarms typically occur 1-2 times per year, but are usually much smaller in terms of number of events. The last large swarm at Mount Rainier in 2009 had a maximum magnitude of M2.3 and lasted three days. The 2009 swarm had over 1000 earthquakes, of which the PNSN officially located 120 earthquakes. Past swarms have been attributed to circulation of fluids interacting with preexisting faults.
What we are doing
Mount Rainier is monitored by a dense network of seismometers, infrasound sensors, GPS stations, and webcams. The U.S. Geological Survey Cascades Volcano Observatory (CVO) and Pacific Northwest Seismic Network (PNSN) will continue to monitor earthquake activity and release further updates as the situation warrants.
Interesting, a post about Mt Shasta, and suddenly a minor swarm at Mt Rainier.
It’s become quite warm up here in the US Pacific Northwest. Maybe some of that snow melt is trickling down into warm rock in the dome?
It is called ‘me too’
The process of monitoring/observation can indeed change a system in some cases. But it’s unkown to macro-physical objects like volcanoes.
Flames have started at Kilauea
Do H2-flames accompany the emission of Helium? We know that volcanoes release Helium, but it’s invisible.
Here is study about Helium isotopes at Kilauea’s Sulfur Banks: https://appliedvolc.biomedcentral.com/articles/10.1186/s13617-023-00132-7
They say in the introduction that “3He/4He variations result from injection of mantle-derived magmas that have undergone limited mixing with radiogenic crustal components into a shallow magma chamber.”
If mantle-derived magmas transfer certain Helium isotopes (He3) into the magmatic system, then it seems credible, that also Hydrogen takes the same path. In December 2020 they measured high levels of He3 four days, before the eruption began.
Not really it probably leaks out deep down and is never very concentrated. The H2 is probably created by chemical reaction of water with the lava (probably Fe2+) it isnt primordial.
There is a lot of flame visible though. Much more than I have seen before.
The flaming is indeed very strong this time.
Looks like there might’ve been someone close to the vents. I thought it was a new vent opening, until I looked back and it shone in a way that wasn’t natural. Don’t know if I’m going crazy, but if it is a person, I hope it is USGS staff looking at the vents…
Update: the person might no longer be there. They climbed down the cone at 3:57 AM Hawaii time.
You are right! That was a flashlight. I am afraid their chances of survival are not high.
The person first walks into the V3 camera frame at 3:48:45
Tried to look at other cameras for the person, but V1 only focused on the crater and V2 was darkened, so that we couldn’t see the person’s comparatively tiny flashlight. I mean, to get there, you’d had to cross rugged terrain, deal with volcanic gasses, let alone have to run away from a episode that us gearing towards large lava flows and towering fountains. That is why I hope it is USGS, but if not, I hope he’s okay but also another potential Darwin Award of this year. At least that one guy from 2019 (early 2020? No idea) fell into there without any lava.
Also, there seems to be another incident in June of this year where a tourist fell trying to get a closer view of the eruption.
https://www.cbsnews.com/boston/news/kilauea-volcano-eruption-hawaii-boston-man-rescue/#:~:text=The%2030%2Dyear%2Dold%20visitor,Service%20said%20in%20a%20statement.
Luckily, a tree saved this guy…
Not USGS: they would know better. And comparing the speed of his withdrawal to the speed of the eruption, the person is in serious trouble.
I took a look at the cams about 6AM CT and I saw two to three lights where there shouldn’t have been any, either way up on the wall behind the vents or more likely on the cinder pile. I was wondering ‘why in the hell is someone adjusting cameras this time of night?’
Not the most exciting video in the world, but it may be the only documentation we have for the Darwin Award
The floor inside the 2018 caldera is only accessible easily by going down the side of the new cone, which is now in the act of creation so not an option. Other than that it would involve climbing a lot of cliffs at some point, not impossible but very dangerous.
I did wonder how the person got down – and how they were planning to get out again – in the pitch dark!
Maybe Pele mesmerized them and led them down for a front row seat of the volcanic action, the reason quite as mysterious as the plumbing system of Kīlauea. On the plus side, they got what they wanted…
Speaking of people, less than 10 minutes later, Ep. 28 might be starting…
It has definitely started, soon the small hole will blow put as the north vent clears.
I wonder if the strong flaming before E28 will have any bearing on how high the fountains might get. Even early on right now the fountain looks lime a spray, very gas rich, E28 might cross the 400 meter mark.
I wo der at what point will the tephra hill growing on the rim be given a proper name.
Definitely going now!
It looks like the lava doesn’t flow far from the source. The volcanic hill is growing fast:
https://www.youtube.com/watch?v=BqmpkUdMtyA
B1 looks from the east over the whole 2020-2024 lava lake towards the eruption site:
The thermal webcam also shows that lava stays on the growing volcanic hill:
Volcano Watchers are gathering:
This view shows the long shadow of the lava/tephra/steam cloud towards the southwest.
It was the wrong link. I wanted to show this:
It’s building a short, but tall curtain (by a single vent) of fire like Pu’u O’o and Mauna Ulu did with tall and massive fountains. Usually the label “Curtain of Fire” is used for long chaines of lava fountains. But sometimes a single lava fountain can do its own special type of a “Curtain of Fire” that goes both vertically and horizontally some 100m.
This video shows at 2:25 the famous view with a helicopter in front of Pu’u O’o’s lava fountain that gives this feeling of a tall curtain of fire: https://www.youtube.com/watch?v=Kr97gGmSdts
At 4:00, is what happens if the vent gets blocked. The next episode will force its way out anyway but exactly how is unpredictable.
This was in either E11 or E12 of the eruption, still back in late 1983. E11 opened as a curtain of fire going through Pu’u O’o and beyond both up and downrift. E12 had more random vebt location, from GVP. So this is probably E12. That episode ended with a dike intruding several km east and almost erupting, in hindsight a preview of both the end of the high fountaining 3 years later, and the whole eruption 30 years after that.
E29 or E30 of the current eruption might well end up behaving similar. Even though it is powerful now, a few months ago the south vent was buried by the north vent, and still returned. Who knows maybe the cone will build up tall, only for the vents to switch up , the south vent then erupting at the top of a cone far above the rim, exiting the caldera or sending lava flooding down into it.
Glitch on Iceland gps stations…
Is it a glitch or an adjustment? Nearly every station is showing some type of uplift.
most likely a glitch
Another Jokuahallap starting at Katla, the timing is impeccable…
Geohub has made a video and talked about inflation: https://www.youtube.com/watch?v=N5ODKf4vD1k
AUST-Station one year: http://brunnur.vedur.is/gps/katla.html
http://brunnur.vedur.is/gps/eldfjoll/katla/AUST-plate-yearpng (enter a point before png to get the correct address)
Just a little bit of a brag but I caught on before geologyhub published his video. Just being patient now. *wink*
IMO has a write up. It’s in Icelandic but my browser translated it for me:
Glacier race from Myrdaljökli in Leirá south and Skálm
Ok maybe I should have said “translated”. The AI doesn’t much like Icelandic! But the conductivity and sulfur smell suggests it’s volcanic not seasonal.
I dont know specifics but I remember the condictivity and H2S is just because there is hydrothermal activity and probably a lake under the ice in the caldera. Its volcanic and seasonal, but not a sign of eruption. If it did erupt most or all of the times there was a flood it means we have a big misunderstanding of Katlas behavior.
To be honest I think its pretty unlikely for a flood to trigger an eruption, it was proposed at Grimsvotn because its lake is apparently pretty deep and voluminous, but even that is only for one eruption as I understand, and not a confirmed cause just speculation. I might be wrong. Its probably one of those things like earthquakes or tidal forces that could technically trigger an eruption but only one that probably would have happened soon anyway.
I have wondered what eruptions at Katla would be like without the ice. Probably mostly effusive, but the intensity could make it pretty spectacular, probably some really huge lava fountains.
This article in RUV (Icelandic) reported a prediction about a possible Jökulhlaup in July: https://www.ruv.is/frettir/innlent/2025-06-27-eldgos-undir-jokli-i-kotlu-mogulega-orsok-jokulhlaups-447183
They assumed that remaining water of a minor subglacial eruption in spring 2024 might be released in July. Can an escape of this water cause an inflation? A loss of a big volume and mass of water reduces the weight of Myrdalsjökull and may lead to an upward isostatic adjustment.
At 08:47 HST, Jul 9, and a few minutes around that time, the lava fountain was going higher than the top of the screen on the V1 cam. Is this a new record for the eruption?
It was a very tall jet,i guess we’ll have to wait and find out later. A few minutes later at 08:55 there was a big surge of lava and it changed back to a fan shape, was cool to see.
Looking at cam c that is.
08;56:02
The current “Epsilon” swarm might be the long prequel before what could be the biggest swarm for Chiles-Cerro Negro, potentially surpassing that of the 2014 seismic crisis.
It’s WAY too complicated for me to put in the comments as so many things have changed but I think we are getting close to a tipping point with this system. This is the thing that would warrant an article. It may not be today’s seismic spike or tomorrow’s
The swarm near Rainer is continuing. Seismo shows signs of hydrothermal activity and possible tremor…but it’s very shallow. Given a dearth of recent deeper quakes (some, but not a lot) would suggest magma is not currently on the move towards the surface. We shall see.
https://pnsn.org/seismogram/current/rcs
The cinder cone behind the north vent is slumping as quick as it can be built up, lots of circumferential cracks. I bet material is sliding into the vent and altering the vent area dynamics–material is fountaining in all directions, even defying the trade winds.
Yes this is probably how it will actually build itself up. The south vent didnt participate but its too early to say it is dead, it could well reactivate if the north vent elevates itself again. I can see either this coming week or after E29 the south vent getting blocked off by the cone slumping into it, which could result in significant changes. Most likely the vents erupting higher up than before. Kilauea Iki did this at one point in its eruption.
And… Kīlauea Ep. 28 has ended.
Shaky stuff going on in Tanzania.
M 5.0 – 13 km SSE of Basotu, Tanzania (USGS, 9 Jul)
Not especially notable, but the whole African Rift system is fascinating. A continent being torn apart in real time! I’ve put up the link since the USGS have included a really nice blurb with the standard report, which VC denizens might like reading as much as I did. And don’t miss the graphic which is behind a small-font link titled “Map of Tectonic Summary Region” since it is nice too (it’s a PDF so I can’t insert it).
The cone is definitely sliding down, the north vent (maybe now the only vent) is still glowing brightly as the rootless spatter flow moves down over it and starts falling down into the open vent, exposing the interior. Its like a massive blocky a’a flow. It will be interesting if it is able to plug the vent,
V3 cam shows that the upper flank of the cone has reached to the caldera rim, and fumaroles are emitted there:
https://www.youtube.com/watch?v=BqmpkUdMtyA
In my view the “northern vent” has indeed become the main crater of the cone. To become stable the growing cone needs to build a base on the east side. As long as the lava fountains only go in the southwest direction, the crater will sit on the northeast flank of the cone and risk a collapse. Pele needs to study some architecture lessons …
It’s cool how it’s moving around a big older rock, behind the vent as seen from V3.
The Cascades host two active shield volcanoes that only sleep and are going to continue their eruptions:
Newberry Volcano: formed about 600,000 years ago and has had several thousand eruptions; the last 690 AD (Merovingian dynasty in Europe)
Medicine Lake Volcano: active since 500,000 years, last eruption around 1080 AD short after the Normans took over England. The last eruption did a “slow effusion of thick, glassy-looking lava flows” that built Americas Monte Nuovo called “Glass Mountain”. https://www.usgs.gov/media/images/glass-mountain-obsidian-flow-medicine-lake-volcano-ca
https://www.usgs.gov/volcanoes/medicine-lake/science/glass-mountain-obsidian-flow-medicine-lake-volcano
Here evolved magmas did big effusive eruptions. “Glass Mountain first erupted dacite containing mafic magmatic inclusions and last erupted rhyolite without inclusions.”
I’ve driven by both of those shields. You don’t appreciate how large they are until you start to get close.
“Halemaʻumaʻu crater is the home of Pele, the Native Hawaiian elemental force associated with lava, and numerous eruptions have taken place in the crater. With permission from Hawaiʻi Volcanoes National Park, USGS Hawaiian Volcano Observatory scientists landed briefly on the crater floor on Wednesday, July 9, to collect lava samples of episode 28. Here, two scientists are walking across earlier, cooled lava searching for a safe point to access the active episode 28 flows for a molten sample. Analyses of molten lava samples provides information on magma storage conditions, which aid in ongoing hazard assesssments. USGS photo by M. Zoeller.”
HVO published the saw blade shaped deformation since December 2024:
Krafla had a similar shape, but lower frequency:
https://volcano.si.edu/volcano.cfm?vn=373080#bgvn_197710
This photo reminds me of something: do they even know that, minutes before the episode even started, a person was down there? Are they trying to look for said person? Even though the mistake made by the person was quite idiotic and dangerous, I hope there is at least some closure to this case, dead or, in a very unlikely sense, alive, for those close to the person down there.
I am not sure whose job that would be. Not USGS, I guess. The park authority may do this but wouldn’t put its own personnel at risk for an impossible search. Perhaps something was caught by the other webcams, but if the person didn’t get out in time there is not much chance of finding them.
That was what I thought. Not to get too morbid, but I could only imagine that they were going slow to maneuver over the blocky flows that would cut the soles of the shoes without protection and falling over would’ve been nasty, resulting in cuts and bruises. Once the episode began and the flow caught up to them, it would’ve rolled over him like a tank tires and melting them alive, encasing them in the lava forever.
I could only think how impossible it is to find the body under a pile of cooled lava and combined that with fund cuts (if that’ll even help this very impossible situation). All that I would hope for is that someone knew that someone was down there and, to further this, someone out there knew this person. Otherwise, all that we would know him (or her) is that person who might’ve got killed by Kīlauea for the first time in maybe over 200 years and hold the only Kīlauea Darwin Award that we know so far.
Wasn’t someone reported missing during the 2018 eruption? Like a lot of stories reported in what passes for the news these days, there’s a decided lack of follow-up. And East Puna has more than a few people who are homeless by choice. It’d be horrible to be stuck in a rapidly closing kipuka.
And during the Puu O Oo / Kupianaha eruption, I seem to remember at least one person died due to a bench collapse, one due to inhaling superheated gases, and maybe one due to lightning.
The person moved away and out of the frame some 15 minutes before the eruption started. That may have been enough, and the wind was away from them. But I wouldn’t want to get away from flowing lava over broken ground in pitch dark. And where was the way up and out?
Albert the only way down without scaling the cliff is down the cone. That way is also pretty easy to get to, following crater rim drive. Ignoring the terminal option they would have spent a night in the caldera and had to climb the tephra hill.
If I had to guess, they probably turned the light off after actually seeing show it on the livestream, the caldera has fast internet all over, and possibly just ran for the exit when they saw it starting. Scaling a 150 meter sand hill in 10 minutes is easy in fight or flight…
The fact no track is visible means their final resting place is there or they did actually climb out but before dawn and most likely will never mention again it if they got out unscathed.
I guess, theres a chance in the future whoever it was releases their video, maybe in a decade when the whole area is no more, lots of video taken in 2018 released much later.
There were some initial comments about it in Hawaii Tracker and other local FB groups, but haven’t seen any follow-up. The lady who runs We Love Kilauea might be the person to ask, she probably reported it to the authorities. Incidentally, I’m a former U.S. Park Ranger, and I’ve noticed that Hawai’i Volcanoes National Park isn’t particularly forthcoming about incidents like that, compared to other parks.
Made a post on the Hawaii Tracker FB group and is pending at the moment. Sent the Vimeo link on the post.
Is there phone reception in the crater? That should be enough to find out who the person was..
Try messaging these people.. https://www.facebook.com/InvestigativeServicesNPS
Yep, reported to them, along with video link just in case.
And sent the thing to the official NPS site, too.
Phone reception assumes they were connected. Its a dangerous area but not exactly super remote, dont need google maps to find the glowing hole in the side of the hill at night.
I dont know for sure, but Keanakako’i has fast internet ( even 1 bar in Leilani Estates is very fast if you are used to Australian speed… ), and evidently all the livestreams use it so its hard to believe the area between them is a dead zone. I feel like its a question with no answer though, if the caldera is covered.
finding a glowing hole in the dark is easy, finding your way back out is not. And seeing where you are putting down your feet while looking at a glowing light is impossible, which is presumably why the phone light was used which the webcams picked up. Anyway, I do hope the person made it. Yet, I did wonder about coming down the tephra hill, but climbing back up on loose sand is very hard and of course this would have been downwind of the fountaining.
https://m.facebook.com/groups/hawaiitracker/permalink/3176338602531936/?comment_id=3176736219158841
Potential update on situation: it might be one of those guys. Now, it is possible it might not be the guy, but these are strong contenders for the person below. If that is the case, at least they are fine, but sould be reprimanded for their actions as this is very dangerous and risky…
Official update from PNSN and CVO…
CASCADES VOLCANO OBSERVATORY STATUS REPORT
U.S. Geological Survey
Thursday, July 10, 2025, 9:25 AM PDT (Thursday, July 10, 2025, 16:25 UTC)
MOUNT RAINIER (VNUM #321030)
46°51’11” N 121°45’36” W, Summit Elevation 14409 ft (4392 m)
Current Volcano Alert Level: NORMAL
Current Aviation Color Code: GREEN
This is an update on the ongoing seismic swarm at Mount Rainier that began at 1:29 AM PDT (8:29 UTC) on July 8th.
Seismicity is continuing at low rates. As of 9 AM PDT (16:00 UTC) on July 10th, the Cascades Volcano Observatory (CVO) and the Pacific Northwest Seismic Network (PNSN) have located 334 events since the start of the swarm, although many more have occurred but cannot be located. The largest event of the swarm so far was a magnitude 2.3 on July 8th at 2:56 PM PDT (21:56 UTC). Seismicity has decreased from 26 located events per hour at the swarm’s peak on Tuesday morning to a few events per hour as of Thursday morning. The earthquakes are mainly spread between 1.5-4 miles (2-6 km) beneath the summit. There have been no changes in ground deformation or other monitoring data.
This swarm now surpasses the 2009 swarm in terms of magnitude, total events, event rate, and energy release. The cause of the swarm remains consist with the circulation of fluids along preexisting faults beneath the volcano, which is considered background activity at Mount Rainier. There is currently no indication that the swarm is associated with magmatic unrest.
PNSN and CVO will continue to monitor activity, locate earthquakes, and provide additional information as needed.
For more information, see: https://www.usgs.gov/observatories/cvo/news/monitoring-stations-detect-small-magnitude-earthquakes-mount-rainier
About Mount Rainier
Mount Rainier is an active, ice-clad stratovolcano geographically located within the Mount Rainier National Park. Mount Rainier is located about 45 miles (73 km) southeast of Tacoma and 60 miles (97 km) south-southeast of Seattle in Washington State. It is the tallest peak in the Cascade Range and is covered by the greatest concentration of glaciers in the contiguous United States.
Hazards and Normal Background Activity
The most hazardous phenomena from Mount Rainier are volcanic mudflows called lahars, many of which reached as far as the now densely inhabited Puget Sound lowland. Other hazards include ash fall, pyroclastic flows, and short lava flows, however these stay well within the present limits of the National Park. Mount Rainier is considered a Very High Threat volcano according to the USGS National Volcano Warning System (NVEWS) based on many factors including the types of hazards and distance to people, property and infrastructure. The volcano has a widely distributed network of monitoring devices. Normal background levels of activity at Mount Rainier include steam and gas emissions, and low levels of seismicity.
Holocene Volcanic Activity (activity in the last 15,000 years)
Nearly all of Mount Rainier’s far-traveled lahars formed during times of eruptions, but one contains a large volume of altered rock that avalanched from Sunset Amphitheater on Mount Rainier’s upper west flank about 500 years ago with no known triggering eruption. A lahar with no known trigger is known locally as a “no-notice lahar.” Future eruptions are likely to produce lahars that could descend river valleys on any side of the volcano, but a “no-notice lahar” is also possible from the upper west flank of the volcano and could feed into the Puyallup and the Nisqually River systems. No physical evidence exists to confirm a reported but disputed eruption in 1894, nor eruptions earlier in the 18th and 19th centuries. The most recent eruption with strong geologic evidence was about 1,000 years ago.
The U.S. Geological Survey Cascades Volcano Observatory and the University of Washington Pacific Northwest Seismic Network continue to monitor Washington and Oregon volcanoes closely and will issue additional notifications as warranted.
Website Resources
For images, graphics, and general information on Cascade Range volcanoes: https://www.usgs.gov/observatories/cvo
For seismic information on Oregon and Washington volcanoes: http://www.pnsn.org/volcanoes
For information on USGS volcano alert levels and notifications: https://www.usgs.gov/programs/VHP/volcano-notifications-deliver-situational-informatio
This $#!{ is so funny. Chiles-Cerro Negro probably just had 3,000-4,000 earthquakes today and my first thought was that the activity is pretty moderate. Just few years ago, this would be a big deal but not anymore.
How are other volcanic “symptoms” developing, f.e. inflation and geothermal data?
The uplift shifted location and speed, geothermal stuff is relatively normal. Article pending.
Inflation is rapid after E28. Its not even 2 days since it ended, there is still lava flowing slowly near the vent and the glow is intense, yet over 5 microradians out of 14 have recovered. At this rate E29 will be in only 2-3 days, or 5 total interval.
Deflation during E28 was a bit smaller than during E27 and 26. The minimum point (end of eruption) of 28 was one microrad higher, and the maximum point of E28 was one microrad deeper. So the deflation was ~2 microrad smaller and the episode a bit smaller, if we only look at the microrads. I don’t know whether the actual volume applies to this deflation. The height of the lava/tephra fountain was like the previous ones, but the growing cone supported it probably.
It seems credible that after a slighlty minor episode the path for inflation until next episode is shorter.
V1 cam shows that there is still some kind of glowing lava rockfall between the cam and the vent. There are many spots that continue to glow after the eruption: https://www.youtube.com/watch?v=oG5zz9Sjw3E
It looks as if there is a side-vent on the northern side of the cone, that continues to release a’a lava. I don’t know whether it’s buried “old” liquid lava from E28 that’s puring out or fresh magma/lava from the shallow magma source. The side-vent lies a bit deeper than the crater rim of the cone. So it’s possible that the exit of magma is easier here.
If it’s fresh magma that finds a way out here, this is a first step towards a continuous eruption.
Its not a vent, its welded tephra that fell on the caldera wall still flowing down. You can see it move slowly by scrolling through the livestream.
Maybe the more interesting part is that unlike last episodes the vent has continued to glow very bright without a pause, usually by the second night it was dark and only returned 1-2 days before the next episode.
Still I think the eruption is trending the opposite direction to continuous flow, and will maybe only be able to transition to that if pressure is high enough to send a dike down the SWRZ.
But even that isnt reliable at all, the same video of 1980s Pu’u O’o you linked before actually has a shot of it in full high fountain mode simultaneous with a curtain of fire on its east flank. What happened in 1986 was something like attempt #20 to break the conduit… It takes a lot to kill a lava geyser, its not a fragile metastable situation.
Did Kilauea prepare the current episodical eruption 2024? Hector mentions in his Volcanocafé article a great uplift in June-July in the summit region: https://www.volcanocafe.org/one-year-of-kilauea-activity-enormous-inflation-rates-five-dike-intrusions-and-the-awakening-of-the-erz/
” During those 49 days, the OUTL GPS station, close to the inflation center, uplifted 38 cm, at average rates of nearly 0.8 cm per day. The uplifting area was about 20 kilometers long and over 10 kilometers wide. The scale of this inflation was such that had it lasted one full year the summit of Kilauea would have uplifted almost 3 meters, all this while pushing the south flank away too. I’m not sure if anything of this size has ever been documented in volcanoes as a whole. I believe that during this event all three, SWRZ, Halema’uma’u, and Keanakako’i, sill complexes were activated at the same time. Earthquake distribution may support this.”
Was the magma, that was deposited in the summit in June-July 2024, used for the intrusions in ERZ afterwards or has it been used for the since December 2024 ongoing summit eruption?
GPS stations around Svartsengi have jumped up suddenly last two days: http://brunnur.vedur.is/gps/reykjanes.html
ORFC station had uplift of 40mm, even Keilir station (Fagradalsfjall) and Krisuvik station jumped up 30mm. Also RVIT (west end of Reykjanes peninsula) moved up around 40mm.
Is it a geological movement or a data error? The same sudden movement appears on Askja’s, Grimsvötn’s, Hengill’s and Katla’s GPS. Was there a satellite problem?
If it’s across all of them it’ll be some sort of GPS recalibration. The inflation has remained largely consistent since June, actually appears to be refilling quicker than the last few times, roughly 10cm per month above the sill at HS02
Hard to ignore the dearth of earthquakes over the last month on the Big Island. Of note is not a single >M3 event near Pahala..which in reality is continuing a “general trend” of reduced seismicity since the summit eruptions began.
https://ibb.co/gZQMRpX7
Does this mean that the deep intrusive activity since 2019 has decreased or that it continues more silently? The ongoing eruption indicates to me that the supply must continue. Something must push the magma up and out.
Can we estimate the volume of magma that entered Kilauea through the “Pahala Gate” since 2019? If it was around 0.2km³ per year, that we read sometimes, this would apply to around 1.2km³ until today. A lot of it was deposited in the caldera 2020-2023 and the rift zone intrusions 2024 with two minor eruptions.
Supply of 0.12 km3 a year was standard for Pu’u O’o, the supply today is much higher, E28 erupted 5.3 million m3 of lava and in only 2 days is about 40% recovered, which is a supply of about a million m3 a day or 360 million a year rate. So far the current eruption total is up to 130.4 million m3 of lava in 200 days, or an average about 0.65 million a day, which is probably more like 0.7 counting the tephra. So about 0.25 km3 a year based on actual undeniable physical proof. I would have to make a chart of cumuative volume to scale, but I think the discrepency is because the supply has increased since the start, noticeably so with the recent huge fountains.
The unknown is how much of that is from what source. It could be speculated the magma comes from deep under Pahala but it also might be decompression from 2018 on other parts of the magma system, or an unrelated surge. The actual earthquakes at Pahala themselves mostly occur parallel and directly below south flank faults bounding Kilaueas SWRZ, so might not necessarily display magma location the way we think.
Tgere is ine really critical detail that makes this situation different though. Mauna Loa has recovered pretty quick from its 2022 eruption, enough that it erupting again before 2030 is plausible and 2040 near certain. Actually Mauna Loas supply now is probably its highest sustained rate since the 40s. While usually given as the central reason for activity peaks at the two volcanoes, the evidence shows that this has not happened now, at all. Adding Mauna Loas supply brings the conservative estimate of total supply up over 0.3 km3 a year, and the high end to close to 0.5 km3 a year.
The simple but very legitimate answer is that the melt generation rate in Hawaii, absurdely high as it already was, has probably doubled or more. That implies a plume origin, which also means this is most likely the new normal for the rest of our lives….
2024 began with this voluminous intrusion into SWRZ that was accompanied by a deflation of 35 microrads on UWE station. https://www.volcanocafe.org/the-kilauea-dike-of-2024/
Hector in another article estimated the volume as 40 million m³: https://www.volcanocafe.org/one-year-of-kilauea-activity-enormous-inflation-rates-five-dike-intrusions-and-the-awakening-of-the-erz/
July to September 2024 had three voluminous intrusions into ERZ with the Napau eruption. How much volume did the intrusions have here?
It’s impressive that after the two voluminous intrusions in winter and summer/fall 2024 Kilauea could produce the current major eruption since Christmas 2024.
Those intrusions didnt start directly at the summit magma chamber so the scale of tilting at the summit will probably be different to the summit eruption now. The ERZ intrusions including the eruption was probably similar to the SWRZ intrusion volume.
The total of all intrusions and eruptions into the rifts last year was maybe up to about 100 million m3.
The 2018 caldera collapse was anywhere from 90% to only about 60% of the DRE of the eruption, with more recent data going at the high end it seems. Thats a range of 0.1 to 0.6 km3, and in 2024 basically ALL of the 2018 subsidence at both the summit and SWRZ, where maybe most of that broad subsidence happened. So last year the supply was temporarily extremely high at maybe 0.7 km3 in a single year, a surge for sure but it has stayed high since with no sign of letting up soon.
My thinking is it’s a pressure drop that’s curtailing seismicity, so the magma flow(s) are advecting rather unimpeded.
Yes with an open vent the pressure limit is the weight of the magma not the strength of the roof, so in theory much less than enough to cause earthquakes.
Another lame attempt to post an image? This try from imgBB.

 [/img][/url]
Any help is appreciated!
[url=
It worked the first time. WordPress would only display the link, not the image, because you are linking to the page that holds the image, not to the image itself.
This is the link to the image, and it works.
Albert, so how do I link to the image? What should I paste in the comment box?
Thanks a million for advising!
I clicked on the image to save the link to the image, opened it in a different window to check it was just the image and put it in the comment. The link should end in ‘.jpg’ or something similar. Yours didn’t
Kilauea’s big sister popped off 6 microrads of tilt at the Mauna Loa MOK Titlmeter in less than a month. That was a big deal in the lead up to the 2022 Eruption. I noticed when Episode 28 kicked off on July 9, the MOK exhaled with a small drop in tilt. No increase in earthquakes yet, but is Mauna Loa absorbing the excess surge at Kilauea like Chad suggested?
Just an update from CVO, and PNSN, about the ongoing ‘swarm’ at Mt Rainier! The swarm is getting smaller and smaller, as expected!
CASCADES VOLCANO OBSERVATORY STATUS REPORT
U.S. Geological Survey
Friday, July 11, 2025, 9:12 AM PDT (Friday, July 11, 2025, 16:12 UTC)
MOUNT RAINIER (VNUM #321030)
46°51’11” N 121°45’36” W, Summit Elevation 14409 ft (4392 m)
Current Volcano Alert Level: NORMAL
Current Aviation Color Code: GREEN
This is an update on the ongoing seismic swarm at Mount Rainier that began at 1:29 AM PDT (8:29 UTC) on July 8th.
Swarm event rates continue to decrease. As of 9 AM PDT (16:00 UTC) on July 11th, the Cascades Volcano Observatory (CVO) and the Pacific Northwest Seismic Network (PNSN) have located 391 events since the start of the swarm, although many more have occurred but cannot be located. The largest event of the swarm so far was a magnitude 2.3 on July 8th at 2:56 PM PDT (21:56 UTC). Seismicity has decreased from 30 located events per hour at the swarm’s peak on Tuesday morning to a few events per hour as of Friday morning. The earthquakes are mainly spread between 1.5-4 miles (2-6 km) beneath the summit. There have been no changes in ground deformation or other monitoring data.
This swarm surpassed the 2009 swarm in terms of total events, event rate, and energy release. The cause of the swarm remains consistent with the circulation of fluids along preexisting faults beneath the volcano, which is considered background activity at Mount Rainier. There is currently no indication that the swarm is associated with magmatic unrest.
PNSN and CVO will continue to monitor activity, locate earthquakes, and provide additional information as needed.
For more information, see: https://www.usgs.gov/observatories/cvo/news/monitoring-stations-detect-small-magnitude-earthquakes-mount-rainier
About Mount Rainier
Mount Rainier is an active, ice-clad stratovolcano geographically located within the Mount Rainier National Park. Mount Rainier is located about 45 miles (73 km) southeast of Tacoma and 60 miles (97 km) south-southeast of Seattle in Washington State. It is the tallest peak in the Cascade Range and is covered by the greatest concentration of glaciers in the contiguous United States.
Hazards and Normal Background Activity
The most hazardous phenomena from Mount Rainier are volcanic mudflows called lahars, many of which reached as far as the now densely inhabited Puget Sound lowland. Other hazards include ash fall, pyroclastic flows, and short lava flows, however these stay well within the present limits of the National Park. Mount Rainier is considered a Very High Threat volcano according to the USGS National Volcano Warning System (NVEWS) based on many factors including the types of hazards and distance to people, property and infrastructure. The volcano has a widely distributed network of monitoring devices. Normal background levels of activity at Mount Rainier include steam and gas emissions, and low levels of seismicity.
Holocene Volcanic Activity (activity in the last 15,000 years)
Nearly all of Mount Rainier’s far-traveled lahars formed during times of eruptions, but one contains a large volume of altered rock that avalanched from Sunset Amphitheater on Mount Rainier’s upper west flank about 500 years ago with no known triggering eruption. A lahar with no known trigger is known locally as a “no-notice lahar.” Future eruptions are likely to produce lahars that could descend river valleys on any side of the volcano, but a “no-notice lahar” is also possible from the upper west flank of the volcano and could feed into the Puyallup and the Nisqually River systems. No physical evidence exists to confirm a reported but disputed eruption in 1894, nor eruptions earlier in the 18th and 19th centuries. The most recent eruption with strong geologic evidence was about 1,000 years ago.
The U.S. Geological Survey Cascades Volcano Observatory and the University of Washington Pacific Northwest Seismic Network continue to monitor Washington and Oregon volcanoes closely and will issue additional notifications as warranted.
Website Resources
For images, graphics, and general information on Cascade Range volcanoes: https://www.usgs.gov/observatories/cvo
For seismic information on Oregon and Washington volcanoes: http://www.pnsn.org/volcanoes
For information on USGS volcano alert levels and notifications: https://www.usgs.gov/programs/VHP/volcano-notifications-deliver-situational-information
A big threat of Mount Rainier is a major debris flow without an eruption like 500 years ago.
A minor steam explosion like the uncertain 1894 event would probably be without harm.
New post is up! Tallis’ vixen
https://www.volcanocafe.org/katla-my-first-love/
CASCADES VOLCANO OBSERVATORY STATUS REPORT
U.S. Geological Survey
Saturday, July 12, 2025, 8:06 AM PDT (Saturday, July 12, 2025, 15:06 UTC)
MOUNT RAINIER (VNUM #321030)
46°51’11” N 121°45’36” W, Summit Elevation 14409 ft (4392 m)
Current Volcano Alert Level: NORMAL
Current Aviation Color Code: GREEN
This is an update on the ongoing seismic swarm at Mount Rainier that began at 1:29 AM PDT (8:29 UTC) on July 8th.
Swarm event rates continue to decrease. As of 8 AM PDT (15:00 UTC) on July 12th, the Cascades Volcano Observatory (CVO) and the Pacific Northwest Seismic Network (PNSN) have located 464 events since the start of the swarm, although many more have occurred but cannot be located. The largest event of the swarm so far was a magnitude 2.4 that occurred on July 11th at 12:23 PM PDT (19:23 UTC). Seismicity has decreased from 30 located events per hour at the swarm’s peak on Tuesday morning to a few events per hour as of Saturday morning. The earthquakes are mainly spread between 1.5-4 miles (2-6 km) beneath the summit. There have been no changes in ground deformation or other monitoring data.
This swarm surpassed the 2009 swarm in terms of total events, event rate, and energy release. The cause of the swarm remains consistent with the circulation of fluids along preexisting faults beneath the volcano, which is considered background activity at Mount Rainier. There is currently no indication that the swarm is associated with magmatic unrest.
PNSN and CVO will continue to monitor activity, locate earthquakes, and provide additional information as needed.
For more information, see: https://www.usgs.gov/observatories/cvo/news/monitoring-stations-detect-small-magnitude-earthquakes-mount-rainier
About Mount Rainier
Mount Rainier is an active, ice-clad stratovolcano geographically located within the Mount Rainier National Park. Mount Rainier is located about 45 miles (73 km) southeast of Tacoma and 60 miles (97 km) south-southeast of Seattle in Washington State. It is the tallest peak in the Cascade Range and is covered by the greatest concentration of glaciers in the contiguous United States.
Hazards and Normal Background Activity
The most hazardous phenomena from Mount Rainier are volcanic mudflows called lahars, many of which reached as far as the now densely inhabited Puget Sound lowland. Other hazards include ash fall, pyroclastic flows, and short lava flows, however these stay well within the present limits of the National Park. Mount Rainier is considered a Very High Threat volcano according to the USGS National Volcano Warning System (NVEWS) based on many factors including the types of hazards and distance to people, property and infrastructure. The volcano has a widely distributed network of monitoring devices. Normal background levels of activity at Mount Rainier include steam and gas emissions, and low levels of seismicity.
Holocene Volcanic Activity (activity in the last 15,000 years)
Nearly all of Mount Rainier’s far-traveled lahars formed during times of eruptions, but one contains a large volume of altered rock that avalanched from Sunset Amphitheater on Mount Rainier’s upper west flank about 500 years ago with no known triggering eruption. A lahar with no known trigger is known locally as a “no-notice lahar.” Future eruptions are likely to produce lahars that could descend river valleys on any side of the volcano, but a “no-notice lahar” is also possible from the upper west flank of the volcano and could feed into the Puyallup and the Nisqually River systems. No physical evidence exists to confirm a reported but disputed eruption in 1894, nor eruptions earlier in the 18th and 19th centuries. The most recent eruption with strong geologic evidence was about 1,000 years ago.
The U.S. Geological Survey Cascades Volcano Observatory and the University of Washington Pacific Northwest Seismic Network continue to monitor Washington and Oregon volcanoes closely and will issue additional notifications as warranted.
Website Resources
For images, graphics, and general information on Cascade Range volcanoes: https://www.usgs.gov/observatories/cvo
For seismic information on Oregon and Washington volcanoes: http://www.pnsn.org/volcanoes
For information on USGS volcano alert levels and notifications: https://www.usgs.gov/programs/VHP/volcano-notifications-deliver-situational-information
[img]https://i.imgur.com/jm9ZxXb.jpeg
Mt. Shasta from Lake Shasta
https://i.imgur.com/jm9ZxXb.jpeg
another try
WordPress likes .jpg, .png or .gif but for some reason doesn’t like .jpeg
Correct. .jpeg is not displayed but shown as link. It is a mystery. By the way, [img] tags are not needed. Just the link will do
testing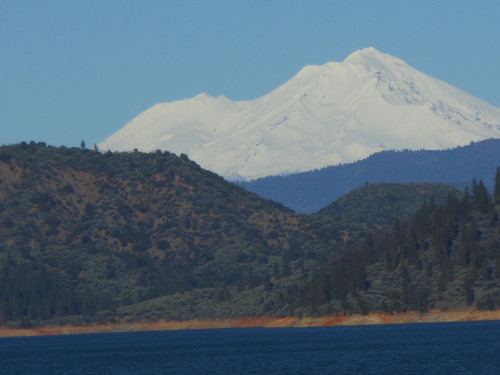 " alt="FMX4g0N.md.jpg
https://freeimage.host/i/FMX4g0N“><img src="