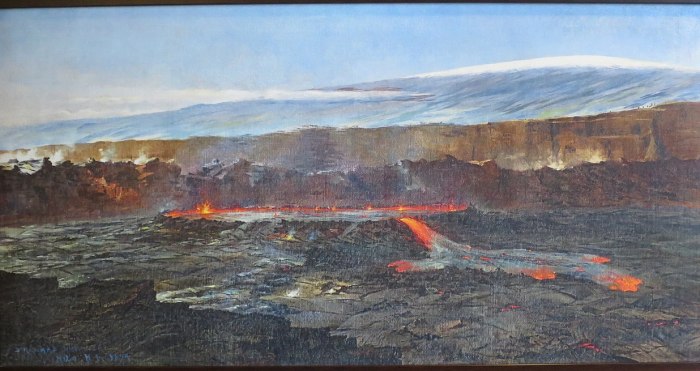
2023 has been a lively year for Kilauea volcano. While the arguably most active volcano in the world is always doing something, this year has been particularly dynamic. So far it has produced 3 brief but spectacular eruptions at the summit crater: the January 5, June 7, and September 11 outbreaks. Apart from the eruptions, this year has also featured a few small non-eruptive intrusions, the ubiquitous deflation-inflation events, and episodes of rapid uplift and earthquakes shifting between the summit crater of Halema’uma’u and the upper Southwest Rift Zone (SWRZ). It is this rift zone that since August has dominated Kilauea discussion in the chat. This is an article where I talked about the August-September SWRZ activity that has continued afterwards:
With Halema’uma’u not far from returning to the inflation level it had before its last eruption and the very intense ongoing unrest along the SWRZ, I can’t help but wonder if 2023 will have a final event at Kilauea. It is about time, and it feels like things are reaching their breaking point. It might be Halema’uma’u or it might be the SWRZ, it might be tomorrow or in a few months, but I doubt Kilauea will stay put for much longer. It has been a little over 40 years since the Southwest Rift Zone of Kilauea last produced a dike intrusion and about 50 years since its last eruption. So I think it is a good time to explain the SWRZ, and why there are actually 3 of them.
The earthquakes
The plumbing of a volcano runs below the surface where we cannot see what’s happening. So how do we know what’s there? Seismology can give us a hand here, earthquakes happen along faults, which are often related to magma structures within a volcano. Kilauea is a great example of this. And in particular, the SWRZ is very seismically active. Kilauea can undergo periods of a few months where unrest happens along this rift zone, usually consisting of a combination of inflation and earthquakes. The ongoing unrest is an example of this. The USGS earthquake catalog includes 1300 SWRZ earthquakes since August of this year, which have been concurrent with up to 25 cm of ground uplift southwest of the caldera, and affecting an area several kilometers across. Another important episode of unrest, that shares similarities to the present one, preceded and followed the last dike intrusion (rifting event) of the SWRZ, which happened in 1981. Below I show the located earthquakes this year since August 13, and also the earthquakes from the beginning of 1981 until just before the SWRZ dike intrusion of August 10 that year.

Earthquake data comes from the USGS catalog.

Earthquake data comes from the USGS catalog.

Schematic map of the earthquake clusters that are regularly active, and some of the important volcanic vents in the area.
Most of the earthquakes in the SWRZ occur in clusters 2-3 km deep below the surface. This is more or less the limit between the deep, permanently molten plumbing system of Kilauea, and the solid rock cap above this plumbing that is often intruded by dikes. I believe many of the clusters might be earthquake swarms within the rock cap just above quasi-perpetual dike-like magma bodies that form the internal magmatic architecture of the Kilauea volcano. The reason that the three different parallel rifting sections exist in the SWRZ would be due to this complicated architecture.
The northern strand, the Volcanic SWRZ, or the Halema’umau’u dike swarm
The first subsection of the SWRZ is usually known as the Volcanic SWRZ. I think this name can be a little misleading though, since it is not any more volcanic than the others. Robin T. Holcomb described in his article, Eruptive history and long-term behavior of Kilauea Volcano, the three “strands” of the SWRZ, the same ones I’m writing about here. In this article, he refers to it as the northern strand since it is the most northerly one.
I like to think of it as the Halema’uma’u dike swarm. Given that it is a group of dikes fed from Halema’uma’u, the central vent of Kilauea, that often forms a crater or lava lake at the summit. There have been four eruptions in this swarm historically, in 1823, 1868, 1919-1920, and 1971. The 1919-1920 eruption formed the satellite shield volcano of Mauna Iki, some 10 km downrift of Halema’uma’u. The 1971 eruption rifted right across Mauna Iki, and produced a near-continuous 8-km long eruptive fissure, but only lasted 5 days in total. The 1868 eruption erupted downrift of Mauna Iki along roughly the same line and was triggered by a M 7.9 earthquake under the south flank of Hawaii, it caused much of the summit caldera to sag in dramatically. The 1919-1920 Mauna Iki eruption is a good example of how this swarm functions and was well observed.

The events of 1919-1920 occurred with a long-lived lava lake at Halema’uma’u. Before rifting, the lava lake was perched 2 meters above the surrounding ground, contained by levees, short overflows spilled over the levees and slowly built a shield around the lake. Events took a turn on November 28, 1919. It was around 2 AM in the morning when the lake started to quickly drain away, 70 earthquakes were felt in a 2-hour time span as the lake quickly receded to a depth of 180 meters, leaving a cylindric crater up to 370 meters wide. Two cracks in the lower 100 meters of the SW and NE pit walls appeared. In light of later events, the conduit walls had ruptured and magma had drained into the rift.
Halema’uma’u lava lake in Kilauea Caldera in 1894. It would have looked similar in 1919. 1894, Howard Hitchcock.
For the next 17 days, the lava lake surface rose again in the pit. By the morning of December 15, the lava lake had refilled almost entirely and was 11 meters below the rim. At 11.25 AM that day, lava erupted from fractures near the SW caldera rim that had opened on November 18. These fractures were 15 meters below the elevation of the Halema’uma’u pit rim and the lava could be seen flowing through fractures from the lava lake towards the SW caldera rim. The eruption ended but the lava lake continued to drop, about 45 meters down in a day. The lava lake started to refill again, while at the same time, cracks started to propagate down the Southwest Rift Zone for several days. Some of the cracks emitted steam and others had visible lava flowing through them. On December 19, the Halema’uma’u lava lake had risen to the elevation of the SW caldera vents and they started erupting again.
On December 24, lava broke out from the area that was to become the Mauna Iki shield volcano, 10 km downrift from the lava lake. Mauna Iki erupted until August 1920. It developed a summit lava pond, overflows constructed a shield around the this, and lava tubes channeled lava over long distances from the shield into expanding fields of tube-fed pahoehoe. The Halema’uma’u lava lake remained high throughout the Mauna Iki eruption. Because the lava was previously degassed by the summit lava lake, Mauna Iki did not produce lava fountains nor build a cone.
Eruptions from the northern strand of the SWRZ are fed from Halema’uma’u. Some eruptions happen at times when there is no summit lava lake and feature lava fountains with the construction of spatter ramparts or low pyroclastic mounds, like in 1971, or the prehistoric eruption of Cone Peak which is aligned with the 1971 fissures. Mauna Iki instead erupted degassed lava from the summit lake. There is another very similar-looking shield 6 km downrift of Mauna Iki, that is thought to be several centuries old and must have formed in a similar eruption.
In 1822-1823 a complex episode of dike intrusions and at least two eruptive outbreaks took place, which formed a system of cracks over 30 km long down to the sea, in places a collapsed chasm 20 meters across known as the Great Crack. In 1823 lava broke out from the lowest part of this crack, draining out a massive caldera-wide lava lake that existed at the summit. It was a massive flood-like eruption that ran into the sea over a 6 km long strip of coast making submarine lava deltas offshore. The lava was completely degassed, with no trace of sulfur or pyroclastic material in the vents. It was a large event, although I don’t know exactly how much, but probably more important than any other historical SWRZ eruption. This is a story to be told in more detail some other time, along with explosive eruptions, colossal lava lakes, and rift drainouts that plagued the 1790-1840 years of Kilauea.
The middle strand, the Seismic SWRZ, or the Puu Koae dike swarm
To the south of the Halema’uma’u swarm runs another line of fissures which has only erupted once historically, in December 1974. The middle strand of Holcomb has been intruded by dikes 3 times in the past several decades, in 1963, 1974, and 1981. It is also characterized by frequent seismic swarms, hence it is often called the Seismic SWRZ. I think of it as the Puu Koae dike swarm, because the most prominent cone here is known as Puu Koae.
The December 1974 eruption was preceded by 3 months of rapid inflation. During this time earthquakes were also recurrent along the SWRZ. In the Upper SWRZ, SE of the future 1974 fissures, and in the Kulanaokuaiki area. These earthquakes were probably triggered by magma seeping below the surface into satellite magma bodies of Kilauea. On the evening of December 30, microearthquakes were occurring every minute in the SWRZ. Just after midnight, the summit tiltmeter began to show a precipitous deflation, something had broken, and magma was draining from the summit storage into the rift. Earthquakes sharply increased in the Upper SWRZ, 2-3 km south of Halema’uma’u, at this time. Just before 3 AM lava fountains were first sighted. Fractures opened ahead of the fountains along with sharp cracking sounds, they started to steam and within minutes lava fountains bursted out of these cracks. A fire curtain was developing, and by 5 AM a 3-4 km long section of the rift had unzipped and was spouting lava to heights of up to 100 meters, with many parallel en-chelon erupting fissures. Fast-flowing pahoehoe lava was spreading out over the landscape, eddies played in the currents, and crustal places were constantly forming and breaking up over the thin glassy skin. Fountains started to decline, by 8:50 AM the eruption was over. The eruption formed a 13 km-long braided channel system, with fluid lava mostly less than 1 meter thick consisting of sheet pahoehoe as far as 9 km from the vents, and thin aa lava with glassy crustal plates near the flow tip and along the main lava channel.
The flow bears a flood-like appearance due to the fast emplacement and high fluidity of the lava. December 1974 lavas contain about 13 wt% magnesium oxide, which is much higher than normal basalt and one of the most primitive lavas to have erupted from Kilauea, which may explain their fluid appearance. The dike may have drawn magma from deep sills that run from the summit to the SW and which often experience inflation, for example, the 25 cm inflation since August of this year is focused near the 1974 fissures, these sills contained more primitive magma that the shallower sills under the caldera that fed other less primitive eruptions that year. The magnesium oxide had also been rising for years beforehand and had been very high during a 1968 upper ERZ eruption, and the Mauna Ulu eruption of 1969-1974. This increase in the primitiveness of Kilauea’s magmas perhaps climaxed in 1974.

The 31 December 1974 eruption. Photo by Robin Holcomb, USGS.
The dike continued to grow after the December 31 eruption and at 4 PM earthquake activity had reached 15 km downrift from the starting location of the swarm, achieving its full length. For more than 10 days the summit continued deflating and earthquake activity happened mostly along the distal parts of the dike intrusion, also triggering faults down to the coast of the island along the western boundary of Kilauea’s mobile flank, as the rock adapted to the newly arrived material. From its size, I expect the volume of the 1974 dike greatly surpasses that of the “small” 6 million cubic meter lava outbreak, so that it was a dominantly intrusive, endogenous event.
On August 10, 1981, another dike intrusion started from the same area as that of the 1974 event, followed a very similar path, and reached the same 15-km length. This was another important rifting event that drained a substantial amount of magma from the summit of Kilauea but did not erupt onto the surface. Another dike intrusion occurred here in May 1963 and cracked the ground for a distance of 5 km. It was associated with a smaller deflation of Kilauea’s summit and poorly located seismic activity. The 3 events affected the same middle strand of the rift and probably originated from magma storage in the Upper SWRZ. The map below shows earthquakes, ground cracks, and fissures associated with the three intrusion. The fissures of 1974 are offset from the earthquakes to the northwest. This often happens with Kilauea eruptions because the dikes can be inclined, they dip southwards, but the earthquakes happen along the base, so what you get is the deep earthquake expression of the dike happening along the base to the south and the surface eruptive fissure expression of the dike showing up to the north.

Green squares are earthquakes of the 1974 dike intrusion, the star shows the location of the initial swarming and lines the eruptive fissures. Pink squares are August 1981 dike earthquakes and the first events location. Light blue lines represent surface cracks of the May 1963 intrusion from HVO reports.
There are at least 4 prehistoric eruptions that have affected this same area between about 1500 and 1790 AD: two unnamed spatter ramparts, and the eruptions of Cone Crater, and Puu Koae. Puu Koae is the largest eruption here, it was a slightly long-lived eruption that formed a pyroclastic cone and several sluggish flows of aa lava. From its appearance, I get the impression that its basalt might be a little evolved compared to other Kilauea lavas.
The southern strand or the Kamakaia dike swarm
Three earthquake clusters, the ones I dubbed in the map at the beginning of the article as Kulanaokuaiki, Kamakaia, and Puu Kou clusters, are aligned with the direction of SWRZ dikes and they also match with a series of surface fractures and eruptive fissures that have not been active historically.
The Kulanaokuaiki cluster is located just SE of a large north-facing scarp, probably formed from inclined dike intrusions that lifted a block to their south and did not reach the surface. Some similar scarps further east have been historically ruptured by dikes from the East Rift Zone. Collectively these scarps form the so-called Koae Fault System. It is a vast area of failed dike intrusions that are seemingly doomed to never see the light of day. Summit overflows regularly add elevation to this region, so it is a bit higher than it would be if it was just a rift zone, dikes that form here from the rifts are apparently not pressurized enough to reach the surface. I believe the Kulanaokuaiki earthquakes cluster may have fed dikes in the past, akin to those of 1963 or 1981, which do not erupt.
The Kamakaia earthquake cluster is located right below the Kamakaia Hills, a curious group of 9 cones that is relatively isolated. The timing of the last Kamakaia eruption is known from stratigraphy: the Kamakaia Waena eruption overlies ash from 1790 but must predate the arrival of westerners in 1823, so it was erupted at some point between the two years. Kamakaia Waena was a sizable eruption that produced 0.1 km3 of lava, it lasted somewhere between a few months and a year, and eruption rates were low, making fields of tube-fed pahoehoe, and more rare aa and toothpaste lavas. But the rarity of this eruption is that lavas have a basaltic-andesite composition, with 4 wt% magnesium oxide, some of the most evolved lavas known to have erupted from Kilauea. The Kamakaia Hills are 14 km away from Halema’uma’u, and it is possible that the earthquake cluster under the cones shows the magma body that supplies the vents. The distal location of the magma body might allow the melt to evolve, similar to eruptions from the Lower ERZ and Puna Ridge which produce evolved basalts, but more extreme due to the lower activity of the SWRZ.
The youngest Kamakaia eruption has a few cones, one of which is a beautiful 40-meter-tall symmetrical cone formed in strombolian activity due to the sluggish lava, Kamakaia Waena. The Waena feeder dike rented a graben across an older cone Kamakaia Uka which has a remarkably identical appearance to Kamakaia Waena and was formed in an earlier long lived eruption. Kamaia Uka lavas overlie a cone formed during high lava fountains, perhaps 200 meters high or more, which is probably associated with a long fissure that runs downslope and features three other cones sticking out of younger lavas one of which also featured powerful lava fountain. A flood-like flow of aa lava with braided lava channels mostly buried under Kamakaia Waena lava shows up downslope, it is the result of what must have been a powerful fissure eruption which I suspect is the same eruption that formed the high fountain lava cones. In turn, the braided lava channels overlie summit overflows from the 15th century.

The blue squares represent earthquakes from the USGS catalog for the current unrest and that which preceded the 1981 dike. Lines show the various fissures and fractures associated with the southern strand of the SWRZ.
While the Kamakaia Hills have not experienced any historical (post-1823) eruptions, there was an unusual unrest episode in 1981, six months before the SWRZ dike intrusion. In February 1981, for a period of about 10 days, the summit of Kilauea started to gradually deflate, and at the same time, many earthquakes flared up the seismic clusters under the Kamakaia Hills and Puu Kou, while the rest of the volcano was quiet. Most likely magma accumulated beneath these areas. The Puu Kou cluster however included unusually deep events, with earthquakes up to 7 km below the surface, down to the base of of the volcanic pile and decollement fault, unlike the other much shallower swarming areas, This later area is also at the western limit of the mobile flank of Kilauea. The seismic area beneath Puu Kou I think is a triple junction between the vertical magmatic plumbing of the SWRZ, an area of faulting along the west end of the mobile flank of Kilauea, and the horizontal plane of the base of the volcanic pile on top of which the flank slides. It might also serve as an area that originates dike intrusions which might feed some low-elevation fissure vents dowrift of Puu Kou that belong to the southern strand of the SWRZ, like the Black Cone eruption, a small viscous-looking eruption that might have formed around the same time as Kamakaia Waena and is aligned with it but is 8 km further downrift. The Black Cone lava is a little more evolved than typical Kilauea lava, with a bit below 6 wt% magnesium oxide, if it drew magma from the same storage area as Kamakaia Waena it must have happened afterward so that the more evolved stuff had erupted out.

Map of Kilauea’s triple SWRZ
The next SWRZ eruption
The Southwest Rift Zone of Kilauea has been producing numerous small earthquakes for over 3 months now. Earthquakes have gradually extended downrift, first near the caldera rim, then lightning up the middle strand, the 1974 fissures area, and in recent weeks, the seismic clusters located beneath the southern strand of the SWRZ have become increasingly active. Halema’uma’u on the other hand is not having earthquake activity and the state of inflation is not yet that before the last eruption. So I think it’s possible that we will see an eruption or dike intrusion in the middle or southern strands of the SWRZ sometime soon. The area of Puu Koae and the 1974 fissures is higher in elevation than the caldera of Kilauea, so I don’t think a dike there will have enough pressure to erupt, and if that area snaps then we will have a non-eruptive dike like those of 1963 or 1981. The Kamakaia and Puu Kou clusters are however lower in elevation than the caldera floor, and an eruption there would be possible. In fact, it was a Kamakaia eruption the first flank eruption to occur on Kilauea after the large 1790 caldera collapse. If history repeats itself then the 2018 collapse could end up having a Kamakaia Hills eruption follow-up too. If this comes true then we would probably see an eruption that lasts months and produces lava that is more viscous than usual, with probably some Fissure 17-like strombolian activity. That said, if the SWRZ takes too long then Halema’uma’u will be the next place to erupt and the SWRZ activity will be delayed for another few months at least. Halema’uma’u will probably erupt in somewhere between a few weeks or a few months if the SWRZ does nothing.
References
Holcomb RT (1987). Eruptive history and long-term behavior of Kilauea Volcano. U.S. Geol. Surv. Prof. Pap. 1350
Hazlett, R. W., Orr, T. R., & Lundblad, S. (2019). Undocumented late 18th- to early 19th-century volcanic eruptions in the Southwest Rift Zone of Kīlauea Volcano, Hawai‘i. Scientific Investigations Report. https://doi.org/10.3133/sir20195010
Lockwood, J. P., Tilling, R. I., Holcomb, R. T., Klein, F. W., Okamura, A. T., & Peterson, D. W. (1999). Magma migration and resupply during the 1974 summit eruptions of Kilauea Volcano, Hawaii. U.S. Geological Survey Professional Paper. https://doi.org/10.3133/pp1613
Rowland, S. K., & Munro, D. C. (1993). The 1919?1920 eruption of Mauna Iki, Kilauea: chronology, geologic mapping, and magma transport mechanisms. Bulletin of Volcanology, 55(3), 190–203. https://doi.org/10.1007/bf00301516
*** Important – Dragon Breath Incoming ***
Dear all,
As we’re all aware, the IMO stopped providing the beach ball data to the https://vafri.is/quake site. There has been speculation as to the reasons for this, with one VC regular contacting the VC mailbox regarding this. While some of us found this data useful, I’m assuming the majority of visitors would not assign as much weight to this, if at all, with regard to satisfying their reasons for visiting the blog. We have had complaints from other VC regulars, about the ongoing speculation and displeasure at the IMO in the comments, from other commenters. Those who disagreed with the IMO, and their retraction of public data, have had their say, and no amount of grumbling on the blog is going to change that, I’m afraid.
The VC dragons have had a chat and we think this subject has reached its limit now – could we all refrain from any more discussion on it, please?
More details on this will be added to the next post.


Very nice indeed, I never knew that SWRZ coud be divided into three volcanic sub- rifts, you are now probaly the world leading expert on Kilauea at current and overall yes it maybe the most intresting induvidual volcano on the planet.
Im also working on an article, but will be about other stuff
Thanks, Jesper. Looking forward to your article.
I remeber the old Jaggar photo showing the lava pond in the caldera wall that was the tip of the dyke conduit feeding Mauna Iki eruption, Kilaueas magmas have souch a very low viscosity that even the tinest weakness fault becomes an escape route If the magmatic pressure is there
Great post, Hector. Lot’s of background info that I was not that clear on…but there is still one super-basic question I have:
Where exactly does the magma in the SWRZ come from? Is it drainage coming downhill from under Halema’uma’u, or is the magma being injected towards Halema’uma’u n the form of sills then dikes that originate from near Pahala? To me, it seems most logical that the central conduit under Halema’uma’u and the SWRZ are being fed by independent feeds at depth?
If so, then the SWRZ is not that strongly teleconnected (hydraulically) to the Halema’uma’u main conduit, thus allowing for each to behave as entirely separate systems.
Thanks Craig Heden.
This year we’ve had intermittent inflation and earthquakes along the SWRZ, during these episodes the summit has usually deflated. Instead, during quiet phases of SWRZ, the summit rapidly inflates. This happened just now in fact, several hours ago SWRZ earthquakes ceased, and inflation southwest of caldera in the SDH tiltmeter also paused. As soon as this happened, Halema’uma’u started to rapidly uplift (visible in the UWE summit tiltmeter). This has been a recurrent pattern and we will probably have more of it in the coming days/months, as long as the situation doesn’t take a turn. The way it looks magma builds up under the summit and then travels sideways into the SWRZ. This has caused the UWE tilt to sometimes show a sawtooth pattern, like 10 days ago, as long as the DI events don’t mess too much with the tilt.
Thanks Hector for the clarifications!
From the data, the correlations (in time) that you point out seem to indicate there is more direct linkage between Halema’uma’u and the SWRZ than I thought.
A good model for this system is probably to liken a chamber below Halema’uma’u to a bladder and the two southern strands of the SWRZ to a pair of trouser legs. Somewhere in between there’s a sphincter that will fail if the bladder gets pressurized enough. 🙂
This model probably also works for the Krafla fires, which had a similar sawtooth pattern, and perhaps the current sill (bladder) and dike (trousers) near Grindavik also.
Its tought its travelling upwarfs from the pahala sill complex but thats a theory ) But from the central summit conduits from there it goes up to Kilaueas summit stoorage and later goes into the rift zones, the magma is flowing both east and west from the central conduit at Kilauea, the rift zones themselves are not connected with the pahala sill complex or the deep conduit .. thats more accepted in models.
Yes as Hector says the Halema’uma’u is the central magmatic heart of Kilaueas edifice system that feeds the difftent parts of the rift zones and sub – summit systems
All
Found this document (PDF) that lists historical activity of Kilauea from 2018 and older. It does have active links to some of the reports for further reading.
https://volcanoes.usgs.gov/vsc/file_mngr/file-243/HVO_website_Kil_historical_activity_table_20200604.pdf
Mac
Please forgive me for making yet another Grindavik comment.
I don’t know much about Hawaiian volcanics! Interesting as ever nonetheless.
Today’s earthquake swarm could be from the pathway between the sill and dike reopening. Most quakes are at the right sort of depth for that. Would be interested to see the inSAR data to see if the sill has begun to deflate again.
In terms of Kilauea – why does the ERZ tend to take preference? Is the terrain lower on the east than the west?
The ERZ is more active long term, but on shorter timescales it can be variable. From the late 18th century (nominally around Cooks landing) up to 1955 there was only a few ERZ eruptions on land to be observed, and only 1840 was large. There were probably big submarine eruptions in 1790, 1832 and 1924 but little is known about that realm. Post 1955 up to 2018 saw 6.5 km3 of lava erupt, about 1 km3 a decade on average… Now it will probably be more quiet again but 2018 was a much smaller collapse than in 1790 so I doubt ut will be another 200 years. It wouldnt surprise me to see another LERZ eruption before 2050 unfortunately, though another lavashield of significant size is not too likely let alone another Pu’u O’o, the summit is most likely where that would be but Pele is full of surprises so expect the unexpected 🙂
I have the impression that for Grindavik the show is over … for now. Maybe 2026 they get something new. It took more than three years since the first intrusion 2020 until November 2023. The intrusions and eruptions of Reykjanes/Svartsengi system happen more infrequently than Fagradalsfjall. Historically there were breaks of at least two years between eruptions. Fagradalsfjall erupted more often. It hat a different behaviour.
It’s kicking off now Phil
Depends on whether the dike that formed on the 10th emptied all of the recent sills or only the one formed immediately before. If the latter is the case then things might get going again sooner than later.
Back to Iceland, is there an explanation for why the blue tremor line at GRV, MEH, and LSF made an abrupt drop at around 1800 on Nov 25? Other stations do not show anything similar.
Weather? perhaps the wind direction changed
I don’t think that the weather changes that abruptly and only at stations along the Grindavik rift.
I would expect weather changes to show up at different stations at times separated by minutes or hours, versus tremor changes (from a single source) at times separated by seconds or less, because weather fronts and boundaries move much more slowly than the speed of sound in rock.
And then all three stations show a rebound about 24 hours later. It almost looks like a giant calibration mark.
growing orange on Husafell camera?
oops. my bad.
Thanks Héctor! The high Mg unevolved lavas are really interesting – whilst not being a geologist I’ve worked with many nickel ores containing Mg-rich serpentine and olivine. They can have quite a lot of nickel – 2% or more sometimes.
OT – I read this one today, from Italy:
Recurring Supereruption Discovered Near Italy Could Blow Again (Science Alert, 25 Nov)
Don’t let the headline put you off, it’s actually a very interesting sonar investigation of the sea floor between Naples and Sicily. They identify four thick layers of what they call ‘megabeds’, which they think came from the Campanian Ignimbrite eruptions. Since Campi Flegrei has been acting up lately the findings are quite topical.
There was another one of those tilt offsets visible in the summit tiltmeter, I think the magma system might be reaching breaking point soon. Both of the rift connectors are showing intense seismicity, even showing tiny quakes that are usually filtered out when it is quiet, I wonder if those are tremors that get interpreted as small quakes by the system?
If it can be assumed the area with the strongest seismicity will be the part to break, then that is probably the Pu’u Koae section, meaning an eruption might not be on the cards although who knows really. The Kamakaia section is very seismic too though and appears to be discontinuous anyway, maybe locating areas magma is stored. Whether the magma is located at the seismic points (more above or below rather) or is located in the quiet gaps between, I guess is an unknown. But even with a repeat of 1974-5 or 1981, I cant see pressure being relieved for long, the ERZ isnt active to take up slack like it was in those years. Most likely we will see a lot of lave there before 2030.
Hector I noticed you put the Kealaalea flows with the lava of 1823. The lava from Kamakaia Waena overlies the lower Kealaalea flow, so if the latter is from 1823 the Kamakaia flow is necessarily younger? Or, that the two eruptions occurred at the same time or in close succession, with the Great Crack opening immediately after.
Perhaps the rifting of the Kamakaia eruption secondarily induced the opening of the lower part of the SWRZ, allowing for the Great Crack to open while also itself intruding down the rift to create the Black Cone. Perhaps this rifting also destabilized the south flank enough to make tge whole thing slide and open up tge ERZ. This all might be a bit of a stretch but if Ellis saw steaming cones above the Great Crack lava then they were necessarily recently active. It does make things interesting given the Kamakaia ruft seems to have had a lot of small eruptions before getting properly started.
This also could have some implications for the near future, if this us true then eruptions may be quite unpredictable for the coming years.
There is this one flow, an aa flow with a central channel whose edges and parts of the floor are coated in pahoehoe. The USGS maps put as being part of the Kamakaia eruption and it overlies the tube-fed Kamakaia lavas as well as some of the Kealaalea flows. But which eruption it belongs to I’m not so sure, Kealaalea has other similarly looking flows with pahoehoe channels, while Kamakaia does not. Kamakaia is either a very viscous early aa and toothpaste lava or late tube-fed pahoehoe lavas that don’t have channels.
I was thinking about the reports from the Hawaiians to Ellis about the 1823 eruption. A group of fishers from Puna told Ellis that it had erupted five months before, about March I think. The eruption carried a large rock into the sea and destroyed 5 canoes, so it clearly refers to the Keaiwa eruption that entered the ocean. About 2 months before Ellis’s visit there was an estimated M 7 earthquake under the south flank and parts of the Great Crack reportedly collapsed. However, three weeks before Ellis’s visit, about 10 July, a Kapapala inhabitant told Ellis that he found newly erupted lava from fissures as well as a small “flame” and burnt smoking trees. So I’m thinking the Keaiwa flow may have erupted in March, and then the Kealaalea flow erupted around June-July. Not sure, but the historical reports make more sense this way.
So your timeline has the Keaiwa flow first, followed by the Kealaalea flows that occurred basically immediately before the quake. It sounds like possibly the Keaiwa eruption didnt drain the lake at the summit, instead that happens during the quake like in 1868. Im not sure how this would work though, Keaiwa is rather voluminous, and the Great Crack isnt exactly in line with the Kealaalea vents, which are also broken by it in places.
“which are also broken by it in places”
That’s a good point. The reports seem to mention the Great Crack collapsed 2 months before Ellis’s visit, during the earthquake, so Kealaalea can’t have formed in June-July. I don’t know then, I might have to go over the reports again, I’m still wondering why the reports give two different eruption dates when Keaiwa seems like a single short-lived event. The volume of Keaiwa would be easy to find because the submarine lava deltas are visible in bathymetry data that I downloaded from PacIOOS Voyager. I will estimate it someday. It will be easy to compare it and find if it was the Keaiwa eruption or rifting during the M 7 earthquake that collapsed the summit, my guess until now was Keaiwa though.
Looking at google earth, the Kealaalea flows seem to be older. Not a whole lot older, but there is a definite age gap. Some of the statigraphy HVO does can leave something to be desired but I would think if the two flows were the same age it would have been recognised already.
That being said, the 2018 publication about how active the SWRZ was in the early 19th century did have in words that before 1868 observation was so irregular that reports are unreliable for many of these eruptions. That Keaiwa is from 1823 seems well established, but Kamakaia Waena could plausibly be younger, it need only be older than 1868. As earlier, the recent vents seen on the 1823 expedition were not given enough description to say they were the hills as opposed to other features.
As a side note, kilauea at present has gone dead silent while the summit tiltmeter is going up like it is trying to reach escape velocity.
Yes, the summit tilt is probably just about to recover all the deflation from the last eruption, if it hasn’t already. At over 1 microradian per day and if the SWRZ doesn’t interfere the summit will rapidly keep climbing and we will have a Halema’uma’u eruption soon. But probably the SWRZ and Halema’uma’u will keep turning each other over the supply like they have been doing for the past 3 months. A summit inflation rate like this would have been nearly unthinkable in previous years, but it seems to have become something recurrent lately.
About Kamakaia Waena, I highly doubt the eruption would have been missed if it happened after 1823. As soon as the missionaries settled on Hawaii Kilauea activity reports became very frequent, a flank eruption would have almost certainly been described, and particularly a large long-lasting event like Kamakaia Waena. So for me Kamakaia is definitely pre-1823.
Im just left thinking about how Mauna Loa was apparebtly missed in eruption in 1832, we all know how bright it gets at the start now. The existence of that eruption is more dubious than that of Kamakaia Waena of coyrse, and probably left no remnant outside the caldera, but still.
Most of the early observations were also at the summit, for obvious reasons as there was actually something to see. But even in 1868 it was only observed that a glow from somewhere out in the SWRZ was seen and it took days to find it, and I recall reading somewhere that the flow from Kamakaia Waena was actually considered to be that eruption at one point, so observation of that area is sparse enough that most of the historic observation seem to be somewhat retrospective rather than literal interpretations of their observations. If Kamakaia Waena was mostly slow and only had lava fountains at its start, or in an irregular strombolian fashion, then it might not have been as conspicuous as eruptions usually are, its probably more intense onset possibly missed due to weather or a lack of observers on that day. I also recall that fissure 17 was not actually all that loud apart from the explosive bursts from the uprift end, the main vent feeding most of the lava was a lot like Kamakaia Waena and sounded pretty much like a normal vent despite the more sticky lava. Given Kamakaia Waena is something like almost 20 km from the Volcano House and probably wasnt throwing lava bombs half a km into the air it probably wouldnt have been audible that far.
I guess, until HVO can get a method of dating to within 10 year timeframes we wont truely know though. Although the way things are going we might get a live reenactment 🙂
This current super high supply coud probaly be the magma mantle sourge thats arriving from the depths, that sourge was discussed just a few years ago just after Leilani stopped. It does takes some time for the magma to rise from the astenosphere until it gets into Kilaueas summit complex reffering to the USGS papers. When it comes to the current eruptions thats been USGS says its due to rapid injection of fresh magma into the shallow system.. but thats pretty much happening all the time at Kilauea, still the ultrarapid microradia thing coud be the deep magmatic sourge that was discussed here a few years ago. Woud be fun If future eruptions coud prove it by chemical studies with even more primitive stuff emerging, but the summit stoorage is huge so will take some time to wash it out from more shallow magma.. but its pretty primitive already as it is in composition
A fine analysis and update on the current development of SWRZ! It is more complex than the lava flows on the satellite images imply. When I saw them I imagined that Kilauea’s SWRZ does something pretty much the same steady eruption style as Puu Oo, maybe a bit shorter timeframe, but similar Pāhoehoe flows, tubes and occasionally ocean entries.
But it’s more complex. The upper (volcanic) SWRZ appears a bit like Mauna Loa’s SWRZ with immediate connection to the summit. An eruption there often is preceded by summit eruptions like 1919-1920.
The middle SWRZ 1974 eruption happened after Mauna Ulu. The connection between the summit and Mauna Ulu was interrupted and the same magma found several alternative paths towards the surface: July 1974 Keneakako’i eruption, September a Kaluapele (the broad summit caldera) eruption and finally the December SWRZ eruption.
The lower SWRZ is the opposite to Mount St. Helens’ basaltic eruptions: The extreme excemption inside a volcano. While the lower SWRZ hosts the most viscous magma of Kilauea, the basaltic eruptions of St. Helens were the most fluid ones of a volcano that is known for its viscous dacite magma (domes and Plinian eruptions).
The dike in Iceland just lit up again.
Yes, the first mag 3 quake for some days. 5 km deep in the spot where the sill feeds into the dike.
This is personally frustrating to me. If we had access to focal mechanisms, the beach balls would help us to understand what is going on. Without them, many interpretations are possible. With the focal mechanisms, we can better determine what is happening.
We probably have most of the info we need to construct the beach balls, (have the high pass drumplots from various seismometers, etc) . For me I am 41 years out of my structural geology class and would struggle with all the intricies of the stereonet interpretation (and I am lazy too)
Not a chance from the drumplots available to us. The resolution is way too bad for that. All you really see is the envelope of the amplitude. There’s no way anyone can tell the direction of motion for the first arriving P-wave from that data.
I haven’t looked, but I would presume that Miniseed data for Iceland is available from IRIS/FDSN?
You can get focal mechanisms simply from picking the sense of the first motion, from the raw waveforms.
Looks significant. Can you imagine the satisfaction that volcano will experience erupting now? Like oh ye of little faith, behold my pretty fountains.
Héctor Sacristán:
Thank you for this very informational article. If I can ask a question, the more that I look at the geophysical information on volcanoes, I recognize that previous rift zones, and dikes, which are buried by subsequent eruptions really do NOT disappear, but play a very important factor in what we see happening today.
It is clear that at least 3 operational modes at Kiliea are functional, but my question is this, are we able to find the primary mode or the mode which will occur next?
Thanks, Randall. I’m not really sure how to know what Kilauea will do next. For example, why is the SWRZ so active while nothing happens in the ERZ that was so active in the two years following the 2018 collapse? Right now magma is alternating between the summit and the SWRZ. Maybe it was just the SWRZ’s turn to recover the magma lost in 2018, after the ERZ and the summit. Or is it something else. Maybe we are just lacking data or the correct instruments. I try to squeeze the data as much as possible but there is only as far as you can go. Kilauea has been monitored in detail for longer than most volcanoes but still, the data is for too short of an interval to understand its full behavior.
The inflationary trend at Svartsengi has been reasonably steady for the past two weeks. The same is true, with minor variations, at ELDC and SKSH.
If it remains so, we would get back to October 25 levels by the end of the month, and to November 10 levels by Pearl Harbor Day. It seems to me likely, though, that something will break by then and we’ll see another outflow from the sill.
Question: do you think it more likely that an outflow would go into the existing dike, or has that dike had sufficient time to harden that another route is more likely?
A question about the nominally negative values in uplift and the base line value of zero.
I can understand an absolute negative value at a site where the graben has formed, as the land has rifted and the surface slumped into the resulting rift.
What however is the cause of a negative value at the power station, in this case the best part of 25cm and which is above the sill, not the graben? If the sill (or a magma chamber) empties, then in a simplified picture the surface would drop back to the level prior to the inflation process, which would be a zero uplift value, not negative.
Is the negative value a result of the ductile nature of rock during the inflation and then graben formation, i.e it gets stretched thin by the inflation step and does not spring back fully because the neighbouring rift/graben means it can stay stretched out? Is it because of momentum of the rock dropping above the sill, i.e the entire rock column bounces up and down because of the rapid decompression? Or is it because the zero baseline value gets adjusted over the years, so older inflation drops out of the calculation?
Any thoughts answers would be welcome, many thanks in advance.
If you look at measurements further east, e.g. GONH, they have gone up even though they are far from the action. The graben/dike is only one part of events. There was also a slip-strike fault that failed, a little east of the graben. This pushed up the land to the east and downed the land to the west, and there was a large amount of west-northwestward movement along the southern peninsula west of this fault, out to Reykjanes, and east-southeastward further east. If it was just a dike, this movement should be smaller further away from it but that is not seen. It seems to me that quite a large block of Reykjanes moved west, perhaps with some rotation
https://www.volcanocafe.org/wp-content/uploads/2023/11/GPS-movements-1.jpeg
Thanks Albert, this fills in something I have wondered about, why the inSAR shows so much movement. Appreciate the factoid.
Swebby, your last hypothesis appears to be correct. The sill has been filling up for quite some time:
What we are looking at now is three years’ worth of inflation in less than three weeks.
This is a little bit worrying. And it’s over a larger area than before, right? We’re going to see some action soon. I was talking to a coworker who lives/lived in Grindavík and those poor people are so traumatized. Their whole life turned upside down and still so much uncertainty.
It is not at all surprising the trauma those poor people have been through and are still experiencing. The experience of those severe quakes almost under your house is bad enough but the continuing experience of not knowing when or even IF they can get back to their homes and possessions can be a major cause of trauma due to the frustrating uncertainty they are dealing with. To be displaced from your own home is devastating, even if it is a temporary time because of flooding but to know it will likely be months, before they even know for sure they could go home at all, makes the situation incredibly hard to deal with. I really feel for them.
Why is there more uplift on the 4 year plot than the short term plot for the same time period?
Which period are you referring to, Merlot? They look pretty much the same to me – perhaps I’m missing something.
Perhaps it just looks more because on the long term plot it is more condensed? Looking at the measurements it looks as if they are the same to me.
Ah Ha!
Many thanks guys/gals – so the baseline of 0cm is an arbitrary value.
Seeing the plot for the two different time ranges – baseline in these representations is simply being determined by the very first data point in the range, not some long term historic measurement. So the negative value in this instance will in part be because of long term inflation prior to the time range that is shown. Now it all makes sense.
Alberts point that a significant chunk of the peninsula has effectively gone for a drunken stroll is also another factor.
It’s basically just ‘ground level’. Whatever that might have been at the start of information gathering.
Its rather incredible how little diffrence there is between Kilaueas basalt and St Helens dacite in terms of composition, as St Helens magma are evolved from a quite fairly similar magma being an non alkaline dacite, althrough subduction zone magmas tends to be somewhat more potassic. But overall the compositions are rather similar with only the Sio2 content thats the major diffrence here, yet its only a 15% diffrence in contents. We all grow up and think they are night and day, yet they are fairly similar.
Amazing in terms of behaviour wise is the diffirence of these two magmas due to they have very varied/ diffirent temperatures and crystal contents, Kilauea is as fluid as any sillicate magma can be on Earth for current, and erupts at near full liquids temperatures, while St Helens erupts extremely evolved crustal rich mushes that can range into near solid. Its also true that a very hot dacite is much more mobile than a cold one, and thats how the puna dacite coud flow up in boreholes, which dome dacites cannot do at all really. Most evolved sillic magmas erupts at very low temperatures so explains their super high viscosity, but once things get over 1000 c and crystal poor even highly evolved magmas loose their viscosity
It shows that they get the same “basic magma” that evolves into Basalt, Andesite and Dacite. The Pacific volcanoes (Hawaii, Galapagos + Ring of Fires) mostly have classical silicic magma, while the Old World (Eurasia, Africa) hosts more alkali volcanoes from alkali basalt over foidite and Trachyte until Phonolite.
The Pelean beginning of St. Helens’ 1980 eruption was caused by an Andesite plug. Occasionally Mount St. Helens does Andesite, and Andesite domes can shut the chimney of a volcano as we saw 1980.
Yes fairly similar.. in composition, the melting oceanic litopshere forms tholeitic melts, that later evolves into andesites, dacites and ryolites feeding the relativly subalkaline cascade volcanoes
Jesper:
What I find fascinating about Mount Saint Helens, is that a big seismic sounding was run, called IMUSH, see https://www.nature.com/articles/511136a and also https://imush.pnsn.org/ . When everything got done, cold rock to the west of the cone was found out, contrary to many geologists speculations, and an apparent eastward connection to possibly a large magma reservoir was found apparently 1/2 way between St Helens and Mt Adams. (maybe both volcanoes draw from the same source?) but elemental/crystal analysis would substantiate or negate this guess.
I live in the Vancouver WA region, and when the ground is scraped from new building contruction, two things seem to emerge, ash or tephra, well weathered, probably from one of the local Boring Field cones, usually an orange red color (especially seen near the banks of Salmon Creek) and glacial rocks dumped on the area from the Lake MIssoula floods. See https://en.wikipedia.org/wiki/Boring_Lava_Field#CITEREFWoodKienle1990 for the Boring vents on the WA side.
I do consider Mt Hood to be important to watch, with the possibility of magma mixing to stir things up, although one paper said that this was not likely.
During one of the initial news broadcasts about St. Hellens,well before the main eruption, there was one brief news clip claiming to show the result of a small ash venting at the peak of Mt. Adams. (I was viewing archives of those news reports, and only saw a few, years after the fact.)
It could have been a bungled news report, but assuming it was accurate, there was a small ash event as the peak of Mt. Adams during the awakening of St. Hellens. I’ve long been perplexed by this event, and have tried to find a reference to it a few times over the years, but so far, nothing. (this makes me think that somebody might have simply made a mistake in the initial report).
If, as you ponder, both volcanoes share the same source, or at least some plumbing, perhaps the Mt. Adams small venting did occur?
Thanks for this, Jesper, bith the explanation and the grapics. I saved tyhe grapic, as it’s something I’ve been looking for for a long time (I knew there was a difference in composition, I just couldn’t find the specifics).
Looks to me (uneducated opinion here) that the temperature difference plays a bigger role than the composition difference in the very different eruptive styles of Kilauea and St Helenes?
The temperature and the water content. The composition chart up there also doesn’t show volatiles. I think water explains the lion’s share of explosivity differences across volcanoes, including whether ones with cool viscous felsic lavas extrude domes and spines vs. go kablam.
So, things formerly mainly attributed to felsic vs. mafic:
Viscosity — more to do with temperature, hot felsic lavas act similar to typical basalt (e.g. Erebus’s lake)
Explosivity — more to do with volatile content, especially water; water-rich basalt goes boom or at least does Etna-like paroxysms while “dry” (or late-emerging-in-the-eruptive-cycle, degassed) felsic lavas just ooze out obsidian and stuff.
Now, those things tend to correlate with the magma chemistry. Subduction arcs and intracontinental tend to have lower production rates, so infrequent eruptions, and magma has a lot of time to sit around and fractionate, so the eruption products tend to be felsic. These also tend to be volatile-rich and erupt cool. Subduction drags in water and intracontinental tends to be alkaline which tends to be volatile-rich. Water is a fluxing agent, so magma becomes liquid and potentially eruptible at a much lower temperature if it is “wet” enough, so eruption temperature is lower as well as explosivity higher.
Divergent boundaries and intraoceanic tend to erupt “dry” basalt and to have high production rates and emit hot, fluid, effusive basalt lavas with low volatile content and low fractionation. When production rates are lower (e.g. Hawaiian post-shield) the magmas can evolve and also tend to be more alkalic, and erupt cooler, with more volatiles, sometimes explosively.
The other way to get a big kaboom is if an outside source of water is involved, even if the magma proper is “dry”. Even usually effusive basaltic volcanoes can go big in that circumstance. Littoral cones on the Hawaiian shores result from small scale examples of this.
Thank you very much for this explainer, it’s great, and helps me understand the factors involved.
CJ
Sentinel-1 phase gradient maps show fractures in Grindavik, Iceland.
https://twitter.com/sandwell_david/status/1728999868247806037
The animated .gif in the comments to that post showing the defensive structures is pretty cool, too: https://twitter.com/birkirh/status/1729092244500807777
The small rifting in the mountains (hills) to the east of the fracture grauben line is interesting too, as it looks like they broke along existing fault lines allowing some transverse motion to the normal Reykjanes rifting.
So the graben is about 2 km wide, maybe a bit more. There isnt anything much smaller or narrowing of the graben anywhere so it seems like the dike stayed at 1 km depth more or less. I have some doubts it was ever as shallow as was claimed at times, 800 meters is plausible in small areas but 400 no, and certainly not the few tens under Grindavik. If it was that shallow there would be copious acidic SO2 steam clouds leaking from the cracks.
Still, a dike formed from 5 to 1 km depth and 18 km long in a few hours, if it is 1 meter wide on average that is about 75 million m3 of magma that flowed in at rates of a few thousand m3/s. Even if my numbers are off by ractors of 2 or 3 its clear eruptions are going to be very different from Fagradalsfjall, and we were lucky to get to see this without it erupting immediately.
Only problem is now the rift is full and when the sill empties it will probably do all of that again but with the old dike in the way, its got nowhere to go… I doubt lava will erupt within Grindavik, an erupting dike probably wont go as far underground laterally, but there is going to be one hell of a curtain of fire playing above Hagafell.
Yesterday Anak Krakatau did a spectacular vulcanian explosion:
https://www.volcanodiscovery.com/krakatau/news/227202/Krakatau-volcano-Sunda-Strait-Indonesia-renewed-eruptive-activity-sudden-powerful-explosions-showere.html
Now that is One volcano that scares me for the future.
Krakatau has been very busy the last five years or so. Building and blowing up what it has built.
It apparently was much bigger before the VEI6 but especially from that photograph there is no shortage of magma under it.
https://earth.nullschool.net/#current/wind/surface/level/overlay=temp/orthographic=-332.72,65.96,3610
Im freezing to death litteraly! we haves an easterly windflow now so freezing russian air is present, and in Northen Sweden its pretty much like that all the winter year too, crisp and beautyful outside but feels cold
Climate change causes sometimes weather patterns that bring cold weather. Decades ago the same weather situation would have been much colder, but it didn’t happen as often as during recent years.
This weather also brings lake effect snow from the Baltic Sea, much like what you get near the Great Lakes in North America. I live right in the line of fire and at the moment it’s snowing like crazy. Cold air from Russia picks up moisture from the still warm (relatively speaking) Baltic Sea, which then precipitates over land (over my head). On the weather radar you see streaks of precipitation coming in from the sea, tens of kilometers long, but only a few kilometers wide. If you happen to be downwind, you can get several decimeters of snow in a few hours.
In Sweden we call this phenomenon “snökanon”, snow cannon, from the similarity with artificial snowmaking.
Snökanon, dont need to translate that one 🙂
Yes those are wintery cumulonimbus clouds that forms over warm waters when cold air is present above, and are common in Baltic Sea and when cold Greenland air blows over the warm open waters of the gulf stream in Norway. And of course the great lakes and japan sea are good examples. Its little funny sometimes how low topped they are, sometimes the anvils are just a few km tall, and sometimes they are just fuzzy blobs, If water strecth is large enough you gets much taller snow showers and even snow thunderstorms
Weird to think that the snowy great lakes are same latitude as Mediterranean, that tells something how cold US winters can get for their latitudes.. Infact not uncommon with snow in northen Florida, when the canadian coldwaves are allowed to flow all way down to latitude 28, there is nothing to stop them in america as they dont have the Gulf Stream flow.
Icelands winters at the coast that sit in the Gulf Stream can be warmer than Florida, IF Florida haves an extreme cold spell, thats true and says something how diffrent these two areas climate and windflow conditions are when compared to eachother….
If Earth spunned the reverse way, we woud always have souch easterly windflow and winters woud get incredibley cold perhaps – 45 c in Finland as an avarge as it is in eastern Siberia today. Europe woud have cold taiga conditions for most of it IF that was the case and it woud not be able to support so much agicultural activity as today so woud end up with a very very very diffrent local human history compared to whats been in reality.
It woud also be a very dry Europe If that was the case, no moisture from the sea blown in with souch windflow comming in from a large continent
And while very cold in winter, Europe woud be very hot in summer with souch a continetal flow, Sweden that avarge 22 in summer coud easly have over 30 c as normal summers with souch a alternative windflow spinn it woud bring the warmth of the asian moonsoon here and continetal summer air as normal setup
Iceland will also get a cold spell in the comming days, perhaps the polar vortex is weak and wavey now so cold dense air spills out, thats allows it to flow almost to the tropics I remeber that south Texas had freezing weather at latitude 29 a few years ago so these coldwaves can go incredibley far down.
Sourthen hemisphere thats populated places, like where Chad is rarely gets any coldwaves at all there is no large landmasses to form cold pools in the south. Everything down there is moderated by the ocean around it. Antarticas polar vortex is too strong for it to be able to spill out too
This latest from IMO has all kings of goodies. My favorite tidbit: “Additional geodetical modelling has been performed to reconstruct the evolution of the dike which formed on 10 November. These newest results suggest that the dike at depth could be wider than initially assessed. The time needed to solidify the magma that intruded into the dike would be therefore estimated to be on the order of a few months.”
https://en.vedur.is/about-imo/news/a-seismic-swarm-started-north-of-grindavik-last-night
all kinds* of goodies.
I also have a bit of an issue with the heat dissipation model used from the dyke.
There was the same claim of solidifying dykes around 81 minutes prior to the start of Fagra 1.
I just do not get the values to add up, and heat dissipation at depth is sort of my main field in life as I work with geothermal reservoirs and heat loss at depth all day long.
But, that would probably be a good subject for an article one day.
The calculation of solidification is fairly simple but with strong assumptions, such as dry unheated rock. It is very sensitive to the thickness of the dike – at 1 meter, indeed you get a solidification of a week. It assumes that the dike has the same thickness everywhere and that there is no convection in the dike from the deeper, hotter (and thicker) layers. It worked for Holuhraun where it fitted the travel time versus solidification, where of course the dike grew thinner over time as the pressure dropped – and it is the pressure that keeps the sides apart. It should work well at the outer tips of the dike. Elsewhere, we may not know enough about a pressurised dike like this.
I know the formula, and it is simple enough.
It is a fantastic formula, it is always delivering fantastic results that are perfectly consequent with the formula.
For some reason it does though seem like nature is not understanding the formula that is forced upon it, and does other things.
Nature is sometimes pesky that way.
During Fagradalsfjall 1 eruption the formula had delivered a wonderful result in the form of the dyke being completely frozen, and IMO declared that there would be no eruption.
81 minutes later the frozen and solid dyke started to squirt out record warm magma…
So, either nature is confused and should go to school and study, or the formula and the theory it is based on is wrong and should not be the basis upon which we decide if dykes are frozen or not.
The formula could perhaps have been saved by adjustment if Fagra had pushed out a gloppy mush that was borderline to solidifying, but since it was record warm something was, and still is, fundamentaly wrong with it.
As you pointed out it does not take into account the rather high heat convection in a kilometer(s) high column.
And as you said, it assumes unheated rock.
But let us start at the beginning.
The rock temperature, it is fairly well know for the region due to the boreholes drilled. If memory serves the heat gradient is about 150C/km…
That would give 300C at the top and 750C at 5km.
Now, let us remember that there is heat convecting into the thermal system at a minimum of 500W/sqm, enough to make a difference.
Then we have the complete unknown, what is the insulating properties at 2 – 5km depth? What does 600 – 1 500bar do to the insulating factor?
The last part is keeping me awake at night when I do not blow things up.
Then we have another unknown, does what is observable short-term on the surface correspond to what reality is below ground? If the calculation giving a one meter wide dyke solution based on surface data, will that truly be what is happening at depth in a spread system.
Here it is good to remember that the surface is cold, hard and less ductile compared to that pesky dyke at depth that is happening in a hotter and more ductile environment?
In fact, you can drive a supertanker through the insecurities, and there is enough “unknowns” here that an army of young strapping Ph.D.-students can build esteemed and steaming careers on this.
But, until those “Younglings” have mentally grunted for a decade or so, I know one thing.
In this region of Iceland that equation is totally unreliable and you should not make public safety assumptions based upon it.
Nature has invalidated it after all, in a record breaking way.
Edit: Not only did the system at Fagra 1 stay open and very hot initially, the same dyke kept open during the interludes between Fagra 1 and Fagra 2, and between Fagra 2 and Fagra 3. And the time frames there is roughly a year in between nature serving up our favourite hot sauce at 1 180C.
This obviously further makes a mockery out of the formula and the underpinning way to simplified theory.
It worked in Holuhraun but that was a flowing dike, with the heat source far upstream. Stationary, pressurised dikes with heat applied below are not the same – they are more like conduits, and these are like lavalamps unstable to overturning. The dike will probably be wedge shaped in which case it would cool top to bottom which is not too helpful. I think the extremities of the dike will be solid by now, like frozen finger tips. This is why I expect that the longer the silence lasts, the more likely it is that an eruption (if it happens) is closer to the centre of the dike.
Didn’t the kola drill project study the thermal properties deep down?
I agree that the tips are more prone to freezing, problem is what constitutes as a tip?
During Fagra 1 the tip was rather short, so I would not in any way, sort, or form presume that an eruption would occur at the center based on this.
Fracturing of overburden is probably more important, and how high the dyke reached at the various positions along its length.
Kola Superdeep just took simple temperature reading, and did not do a insulation analysis of the rock next to the borehole, at least as far as I know.
The KTB-Borehole at Windischeschenbasch (say that quickly 5 times after a few beers) in Germany provided more data, but not that specific thing.
It might though be possible to deduce it from the pumping part of the data collection into the permeable layer.
I think though that the main problem is that sheet-dykes are not uniformly shaped or thick.
By using a 1 x 15 000 x 3 000 meter slab model we miss that parts may be 1cm or nonexistent, while other section close by may be 10 meters wide.
And when you get a wedge-shaped openly scissoring dilating sheet-dyke, all bets are off in regards of how it conforms to the formula.
After all, at heart even the mighty Hekla is a wedge-shaped openly scissoring dilating sheet-dyke that is both rambunctious and a permanent fixture.
Never really thought about how hot the ground is at 5 km deep, 750 C is almost getting molten just be default. It also seems that dikes only really show themselves clearly above this depth, which is probably not a coincidence really.
Seems like maybe below about 5 km deep the crust plastic and deformable, so magma can move around in directions that shallower strains and faults wouldnt allow. I expect some variant of this idea occurs in all of the active areas of Iceland. It also evidently happens in Hawaii too, with how the rift connectors of Kilauea are noticeably offset from the surface faults. There isnt really anything quite like Kilaueas rift connectors in Iceland but I imagine magma movement can be similar.
I guess, we really need to vet some lava from a Reykjanes volcano that isnt Fagradalsfjall. If the lava turns out to be nearly identical at two systems with clear separation in the shallow workings then it would support magma movement between them. That applies outside Reykjanes too.
As far I’ve learned from coal mines, the temperature rises with 3 Kelvin per 100m down and 30 Kelvin per 1km. The heat there was a dangerous threat for workers down there.
The crust on MAR and Reykjanes peninsula is thinner than in coal mines. So it’s likely that the heat progresses much more rapidly if we move 100m / 1000m vertically down.
Chad, the lava has been tested in the region, it is basically the same MORB with just a few minute differences. There is also a tiny hint of plume derived basalt in it.
What surprised us was that it was hotter than expected.
The lava is the same, there is a common production storage situated between the mantle and the crust. It is not magma as such, but it is material that rapidly and easily transforms to magma att even small amounts of pressure drop.
So, yes in a way it is the same magma erupted.
But, it is not interecting inside the crust.
I hope that explains it a bit better.
Its more that the volcanoes are all closer together than the depth of the crust, to me its silly not to consider the possibility that magma movement below the brittle zone is more complicated. Im not talking hydraulically connected as none of the systems are proper central volcanoes but several do seem to build temporary setups that let them act like central volcanoes, Svartsengi demonstrating this very well recently.
The composition of Fagradalsfjall was also a bit weird, even getting articles about its apparent similarity to plume basalt. I dont know enough about its geochemistry to say much on that, seems likely to be some exaggeration and its just MORB with extra olivine. But why we need a second volcano sample is to see if that magma is a result of a change in the mantle affecting all of the volcanoes or just an affect of being out of the cycle for so long, as well as to reveal any potential interaction higher up.
There is a nice compositional analysis of all eruptions in the last two cycles out there.
Google is your friend.
I think that volcanoes are in fact a very complex system like meteorology or social systems. You can scientifically understand some relations, but not the whole thing. It is too complex to examine everything at once. To predict the next eruptions is like to predict the next war (social/political science).
Usually science examines one relation in one work. But it has difficulty to examine hundreds of variables/relations/correlations in one study. There is also a difficulty to sum up the results of all studies. Who shall do this? Modern science often works like assembly-line work. They produce and produce, but don’t really reflect on what they produce.
A 2.54 and 2.58 one right after the other just North of the usual spot on the line that runs through Grindavic. Oh, and both pretty shallow — 1.1 km and 2.1 km depths.
A little more than twenty minutes apart and closely adjacent spatially, without measurable smaller quakes in the cluster.
What’s up with the internet and seismological stations? Google cannot find the LSF FRA seismometer, but does see it listed in the Volcano Cafe one time (from recent discussion), an attempt to go to some station information on the Iris Consortium list is blocked by a potential security flaw (blocked by Mozilla Firefox) and the NEIC station list of the USGS website sits in a non-ending spin cycle.


See
Try changing your search terms or use a different browser.
You can also visit the website of the company that makes the seismometer.
Are you are looking to purchase one or to see the data from one?
Actually I was trying to find out if a list of seismic stations for Iceland exists in a collated manner at one location. The best that I have been able to do is pick up pieces here and there.
*** Important – Dragon Breath Incoming ***
Dear all,
As we’re all aware, the IMO stopped providing the beach ball data to the https://vafri.is/quake site. There has been speculation as to the reasons for this, with one VC regular contacting the VC mailbox regarding this. While some of us found this data useful, I’m assuming the majority of visitors would not assign as much weight to this, if at all, with regard to satisfying their reasons for visiting the blog. We have had complaints from other VC regulars, about the ongoing speculation and displeasure at the IMO in the comments, from other commenters. Those who disagreed with the IMO, and their retraction of public data, have had their say, and no amount of grumbling on the blog is going to change that, I’m afraid.
The VC dragons have had a chat and we think this subject has reached its limit now – could we all refrain from any more discussion on it, please?
I’ll append this comment to the current post so it doesn’t get lost in the other comments. More details on this will be added to the next post.
Thank you Gaz!
I would though like to add that we do like beach-balls, and so do most of the commentators in here.
What we mean is that it is up to IMO to decide if they wish to provide such data, or not.
For the time being at least it is not provided.
The point is more that we have reached any usefulness in grumping about the lack of beach-balls, IMO has made a decission, we have grumped, it is over.
That being said, we would obviously not be sad if IMO put out that data in a form that is safe for them to do, and at a time that is less hectic for them.
In short, IMO are working very hard right now, so let us cut them some slack while they do the important stuff of keeping everyone in Iceland safe, their job is after all not to please us and our insatiable data hunger.
If anything they have been very good to us over the years in providing heaps of data and fun, something that I am very thankful for.
If anything we should give them roses, champagne and chocolate as a sign of appreciation.
Ioto is still erupting and the new island is now horseshoe shaped and is quite a bit bigger than before.
GeologyHub has video.
https://www.youtube.com/watch?v=RKY_tJ4-ZPw&t=66s
Weird shape for a new volcanic island. GeologyHub guy thinks it is because there was a lava flow in the middle.
Saw that video, and looked up on Sentinel there was finally a cloud-free pass yesterday, and you can see the shape, a small steam cloud and colored water: https://imgur.com/a/Rq251JF
The explanation with the lava flow and wave direction sounds plausible I see these shapes on other coasts or just with wind forms in the desert. It’s also a very shallow beach with a lot of sand circling the island from the years of uplift. Guess the new island will soon be a peninsula.
It was a nice picture, but dear lord what an annoying computer voice.
I would still say that the island is to small to survive unless the eruption continues. The sea is a harsh misstress to small wayward volcanoes.
What is interesting with this eruption is that it may be the precursor of future eruptions since it indicates that the pressure has now reached such levels that the pressure is at, or near, equilibrium between magmatic reservoir pressure and the modulus of the bedrock above it.
Carl I am so glad I am not the only one that hates that particular computer generated voice. I looked at the link and less that a minute had to switch it off. If only people realised how dreadful those computer generated voices are to most people then they would never use them. I do though realise that for some people who speak no English it is a necessity. My thirst for knowledge now at my age is a lower priority than listening to a voice that makes my blood pressure rise. In my view AI has gone far enough and I will be happy to shuffle of this moral coil and leave it to other youngsters who have more tolerence for such things.
Haha. mortal coil*
As Jesper said below, this is his real voice, not computer-generated. I agree it *sounds* like it, though.
Yes and he finds it extremely discriminating to be called a robot bot
If that is truly his own voice then he is a very poor choice to do voice over work. I could do a far, far better job of reading off a script that that person. He has very poor modulation, with absolutely no sign of interest or passion for the subject in his voice at all. He really should consider voice training as it could make a total difference to his presentaion of the subject. I did sincerely think that it was a very poor computer generated voice. I home schooled two of my children including instructing them in public speaking, as your verbal presentation of a subject can make a huge difference in whether people become interested in the subject you are presenting or conversely are put off from listening to your presentation.
Do you know him personally then Jesper?
It is not discriminating at all. It is pointing our his poor verbal presentation.
His diction is very clear. But any tonal variation is missing. I have heard people reading out scripts like that before. I can’t listen to it for long. But at least you can understand every word, before you fall asleep.
This is a You tube video of a weather forecast.
This is a perfect example of the way a subject should be presented.
Not because this ia a UK person rather than an American but because of the passion and involvement this person has for their subject.
https://www.youtube.com/watch?v=8IKQv6TkA9s
No-one could ever confuse this presentation with a robotic voice.
It’s possible he’s autistic or otherwise has an impairment that affects his voice, so some compassion is in order.
Was about to say that, I learnt how to speak clearly with autism but many arent so fortunate. Its a shame autism is seen as a disease because it isnt, its a different structuring of the neural pathways, its literally as fundamental of a difference as your ethnicity or the colour of your eyes,or your height… Basically, it has to be said, hating on autism is basically the same as being racist, only there jsnt a convenient -ist word to conjoin with it.
I really dont want to ignite a flame war about an off topic subject but ignorance or the stubborness of age or whatever NOT an excuse.
Given the ongoing uplift, it seems at this point the way the magma pressure will be stabilized is by it getting out. I get a “cracks in the cieling” vibe from this but vibes are not scientific.
All that uplift might have put a strain on the rock. Unless it is very bendy rock.
He coud always train himself up too in verbal communikation, Geology Hub is a very smart and mentaly capable person, much much much smarter than I am that struggle with everything in daily life. I guess my IQ is very low, but IQ tests are extremely controversial and debated and only measure one kind of intelligence anf IF that is intelligence at all and Im strongly neurodivergent as well so is not really usable on souch controversial terms.
But I do have a real working relationship with my girlfriend..so I have some mental capacity too
Structure wise verbaly I performs very well in real life haves no problems, coud be because she have indeed helpt me with that since starting my relationship soon 8 years ago which is very good
And ASD relationships are indeed hard ; ) you needs to really get to learn eachother to the deepest nerve strands to understand how each works as a person. Even after all these years she is still a compete mystery 🤣
Its not a computerized voice .. he sounds like that, its the technology thats also probaly distorting what he sounds like too in real life.
WTF???
How do you even sound like that, and with that contracted and clipped interspacing of the words and phonems?
He must be manually editing every single space between his words, talk about time consuming.
Edit: The other more sane option is obviously that this entity is not human to even begin with.
Aldebaraan, I say that it is a Aldebaraanian.
He was at Fagradalshraun in person so yes he is defentivly real and not any internet AI bot, he have explained himself to other thats it is his real voice, I think his internet recording equippment messes up how voice too a bit when its digitalized, but Geology Hub is not any robot defentivly, he even haves a bachelor degree in geology
So, he is a geologist from Aldebaaran and have a crappy microphone and is to cheap to fork up 10USD for a new one?
Jesper, have you ever seen him speak?
I mean IRL or with his face on video?
https://m.youtube.com/watch?v=dAxt5sVhJhE&list=PLAQJmRWs6m3uBZUvDhMYKoAflTd9adw-Q&index=1&pp=iAQB
He is real .. he is not any machine
Jasper reference understading your partner, I’ve been married nearly 30 years and mine still regularly confounds me so dont feel alone.🤭
Yes they are mysterious I hardly understands mine .. at almost 30 both me and her is getting old 😉
Mine is an open book. One day I’ll find out which language
It is building it hard and fast. Look at size of those bombs.
https://twitter.com/JCG_koho/status/1729070054401343790
Pheratomagmatic/ surtseyan activity water have gotten acess to the still active vent again as the pile eroded during lulls in activity
That looks quite a bit more vigorous than the others. It is also newer.
Keep an eye on this thing, methinks.
Japanese language marine volcano database page about Iwo Jima and nearby volcanos.
Using Google translate because I only know about a dozen or maybe 50 words of Japanese (can say things like “excuse me” and count to ten).
https://www1.kaiho.mlit.go.jp/kaiikiDB/kaiyo22-2.htm
On the latest sentinel image (Nov 27) there is no heat source visible. The steam plume is cold. No evidence for lava
I don’t know about cold…maybe “less hot”. Here is the infrared camera from Nov 23.
https://www1.kaiho.mlit.go.jp/kaiikiDB/video/iou/20231123_1.mp4
I’ve long been hoping for a SWRZ eruption rather than a SERZ one. My bias is pretty simple; the SERZ is partially in an inhabited area, while the SWRZ, so far as I know, isn’t.
I was delighted to see that the SWRZ is is looking more likely lately. Thanks!
Its quite different to see Puna on the footage of the 2018 eruption and then to see it in real life. Leilani Estates is huge, and so lush that I could stay not even 1 km from fissure 8 and a few times I forgot it was there 🙂
You can see why the risk isnt that obvious
The problem is, it does seem like the rifts may have a tendency to wake up by erupting in their lower sections. The first ERZ eruption after 1790 was mostly low down, although it did take 50 years to happen so if that is any consolation it could still be a while. Same thing in 1955. So depending on how easily magma erupts from the SWRZ it could be a while before the ERZ wakes up again. But, 2018 was a lot smaller of a collapse than 1790, so it wont likely be decades, an ERZ eruption does have aplausible chance to happen before 2030.
It’s definitely a very lush area in most places; I was in Puna quite a few years before the 2018 eruption, and remember that quite well – surface level line of sight wasn’t much. Seeing the lava tree molds at the state park there, it was hard to envision a lava flow there, even with the evidence right in front of me.
I did see a few flows (including a few active bits; in a few spots, there was a red glow in some cracks, and it was said to be moving, just too slow for me to perceive) from Puo’oo, and those areas were far less lush, including the untouched parts. Much easier to see the danger in open country, especially with fairly fresh A’a around. 🙂
One thing that worries me is that after the 1955 Puna eruption, it happened again just six years later.
Here is another (Japanese language) article with a video of Iwo Jima erupting. It is recent. I followed a link on volcanodiscovery to get there.
One thing I notice is that waves are breaking next to the new island which means the water is pretty shallow there.
https://www.yomiuri.co.jp/stream/article/22452/
Magnitude 3+ quake at 5 km deep next to Hekla. Dont see those too often 🙂
There was a swarm under the nearby volcano of a name no one heard about. This was maybe year ago? Seems this one is right under this volcano.
Next to Hekla is Vatnafjoll. Carl has said it is a different volcano and has done eruptions as big as Laki but after looking at it myself im really not convinced. To me it looks like it is in the same fissure swarm as Hekla but the mantle source has composition differences. Hekla is also very unusually rich in fluoride which is otherwise only found in low concentration in Iceland. My guess is it has some degree of crustal contamination and possibly there are continental fragments under Iceland of which one happens to be in the firing line.
I also found a map of the Hekla area which does partly map the Vatnafjoll area, there is nothing even slightly comparable to Laki, most are similar scale to the historical flank vents of Hekla, the largest seem similar in scale to Holuhraun to perhaps twice as big but still significantly smaller than the Veidivotn eruptions, let alone Laki which was several times bigger again.
For those who are interested in photos of historical eruptions of Kilauea since 1919, the national park has a nice website about: https://www.nps.gov/havo/learn/nature/kilauea.htm
It includes the 1919-1920 SWRZ eruption: https://www.nps.gov/havo/learn/nature/maunaiki.htm
… and the 1974 Summit eruption with the map below: https://www.nps.gov/havo/learn/nature/july-1974-eruption.htm
The western part of the fissure 1974 is not very far from the fissure in September 2023:
Will the next summit eruption continue to leave Halema’uma’u? I have the impression that Halema’uma’u in fact died 2018 and that we have to wait if it is reborn somewhere somehow.
Halemaumau shows perfectly the evolution of a volcano in its entirety all the way back to stage 1. It started as a vent in the caldera probably in the late 18th century, and matured into an open conduit over the next 70 years. After 1868 it turned into a lava shield, which grew to fill the caldera before collapsing repeatedly and refilling with lava each time until 1924. It kind of stayed an easy path after that, given summit eruptions typically occurred within it. In 2008 the conduit resurfaced, and then in 2018 the once small vent sat within the caldera over 200 years prior turned into a caldera in its own right. No centralized vent has formed since but generally speaking vents have clustered in the southwest end, so that may evolve into something down the line.
The actual name of Halema’uma’u though, is the name of that place. Volcanology gives that name to a feature that was debatably destroyed in 2018 but culturally it is the home of Pele, and what better demonstration of that than a nearly half kilometer deep lake of lava 🙂 HVO kept the name Halemaumau for a few reasons.
Until 2018 Halema’uma’u was a rooted lava lake that actively breathed with the magmatic system below. Since 2020 there has risen a rootless lava lake that is passively filled by fissures and vents all that eceject lava.
The eruption in September 2023 clearly showed a trend towards “general Summit eruptions”. 1974 the eruption flooded Keneakako’i Outlook and Crater. It’s possible that the next eruption will like that flood the Crater Rim Drive area.
Not sure if it would be able to erupt that high above the lake, but then who knows. It seems more likely that the next activity will be on the rift at this point though, there has now been nearly 2 months of mostly intense seismicity and almost none of that has been in the caldera.
I would say I think we will find out soon, but I have said that now for 2 months… so actually I think this could build for a while. But if a rift event does happen there will be no mistaking it, the whole side of Kilauea will probably light up as the sorting system is overwhelmed and lava will be on the surface gushing like a flood from hell within a few hours. Certainly at least the first part will happen.
Hector wrote in his last two sentences: ” if the SWRZ takes too long then Halema’uma’u will be the next place to erupt and the SWRZ activity will be delayed for another few months at least. Halema’uma’u will probably erupt in somewhere between a few weeks or a few months if the SWRZ does nothing.”
At this moment it is still difficult to predict whether the Summit or SWRZ will do the next eruption. 2023 Kilauea did happenings every three months: January eruption, March significant intrusion, June eruption, September eruption. If this is trend continues, the next eruption should happen in December.
During the SWRZ eruption 1919-1920 that began in December 1919, the summit preceded in November to begin a “gradual filling” of the Summit caldera that had a subsidence1919. Both the Summit and SWRZ were active 1919-1920. The summit continued with “gradual filling” until 1922.
Will be very fun to see how deep this lava dam will become
My guess is not a lot more. The question is really more of how long will it be before it drains out. An eruption at the Kamakaia Hills wont do that if it isnt connected hydraulically connected. But if a crack opens up in the side its all going down very fast.
Only question is how big will an outflow really be, its 150 million m3, and a 500 m deep dike as wide as the Great Crack is not exactly small.
IMO is still hesitant to say it’s all over. “In light of the available data and the newest analysis, an eruption along the dike is still considered likely as long as the magma inflow continues. It is assessed that the area with the highest likelihood for an eruption is in the middle part of the dike between Hagafell and Sýlingarfell.”
The likelihood of an eruption according to IMO has decreased, but is still above Zero.
At the same time I notice that the whole western Iceland has some unrest: Blåfjfallaskåli does a swarm, and there was a M3 quake between Hekla and Tindfjallajökull. Some weeks/months ago there was a discussion about Torfajökull; it is only 15km away from this location.
Its in a rift cycle .. so.. will be more stuff soon
Over the past week or so on the GRV unrest plot, I have noticed a curious quasi-rhythm to the blue 2-4 Hz band. Most of the time, it has hovered between about 3000-4000 (I wish I knew the units of the quantity) on the y-axis with a fairly narrow range, but occasionally will dip down for an hour or so at a time at intervals of roughly 6 hours. I don’t recall seeing this particular behavior before during past periods of unrest, but it could just be that I wasn’t looking for it.
Does anyone here have any insight as to what this might signify? Could it be periodic pulses of harmonic tremor, interspersed with brief periods of quiet?
It’s also worth noting, maybe, that during the stormy conditions from the 21-23rd, these dips were not apparent. I suspect they were still happening, but were drowned out by the noise from the wind and waves….
These peaks come almost exactly at the same times of the day. That must be man made; something that has to do with the evacuation? Maybe generators that pause every 6h?
I had seen them but had missed that they were at fairly regular intervals, with one at midnight. Software, I assume
Hmmmm…. good catch. You’re right, they do appear to occur at the same times each day. Too much to be a coincidence, I think. The construction equipment for the berms, then?
I checked it on the plot. The dropouts occur regularly at midnight, at 8 hours, at 12 hours and at 20 hours, so separated by 8,4,8,4 hours. I assume this is two overlapping 12-hour periods.
Another data point. I’m watching the Cambridge University Hagafell spectrogram, and right before 0000 UTC, the persistent low-frequency noise dropped off. I suspect the noise is from the same source as what is showing up on the GRV oroi chart, and if it follows the same pattern, we should see it start to come back in around an hour or so…
Sounds like some sort of watch rotation.
The same patterns are visible (although less pronounced) on the tremor graph for lsf which is pretty far from anything. The only man made thing I can image having such an impact would be the powerplant at Svartsengi. Maybe some process there that causes vibrations with this regular interval. Otherwise I have no idea what it is.
This effect seems most pronounced on the MEH station, which a bit north of the famous super barley greenhouse.
Might be pumps in the greenhouse being switched on and off the.
A slightly out of wonk ballbearing might explain what we see.
Think it’s on too many stations. No idea what the cause is. Is the weather doing something odd?
The weather does not do the same thing every day at the same time. Here is the data of the time of the drop-outs read off from the plot
0.03
0.32
0.51
0.83
1.04
1.32
1.53
4.30
4.51
4.80
5.01
5.32
5.51
5.80
6.01
6.29
6.50
8.30
8.51
8.80
9.01
9.29
9.50
This is units of days. So every day at 0.0, 0.3, 0.5 and 0,8 of a day, something briefly turns off.
The times correspond to midnight, 7:10am, noon, and 7:10pm.
The stations where it is seen are
grv strong
lss weak
lag strong
lsf medium
lfe medium
odf weak
rah weak
vog weak
Here is a map of stations (incomplete)
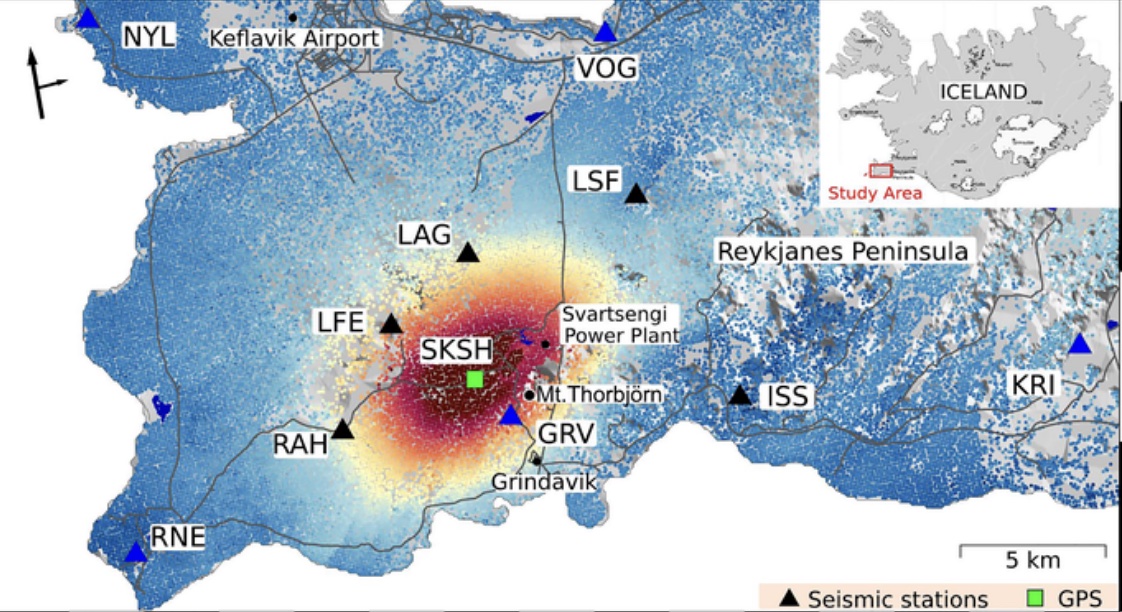
Triangulation suggests that the source of the noise may be the Svartsengi power plant
Yes I can’t really imagine some back-up generators or something in a greenhouse being powerful enough vibrate the ground hard enough to be detected several kilometers away. There are a lot of powerful processes going on at Svartsengi that could plausibly cause vibrations. Lots of spinning bits in turbines and pumps, lots of steam and water rushing through pipes. Seems like the most logical source, but I don’t know.
Here is a plot where the four ‘quiet’ times per day are clearly visible. They last about half an hour
Midnight, 7:00am, Noon and 7:00pm. I don’t know when people on the Peninsula need power most …
My guess is that the Naval Signalling Station has two sets of generators, and that they are offset off each other and alternate.
Start to load battery, when done, shut off.
I do not buy Svartsengi, it is to far away and have not created these patterns before.
The naval station is pretty close to GRV.
It would fit, because previously through the years this pattern was not visible, and during the power outage the station was out of power, so they probably onlined old generators and just let them go “permanently” now.
This from Raspberry Shake R5D8E located in the comms building on Thorbjorn (where camera 4 Live from Iceland is located). Filtered to 2-4Hz
Neat!
Is this publicly available somewhere? 🙂
Yes at https://dataview.raspberryshake.org/#/AM/R5D8E/00/EHZ
Thank you!
Appreciate it 🙂
For those who are strugling to know by heart which gps station is where, quite some new names turned up on Reykjanes Peninsula, IMO has updated the map on its regular GPS site.
https://brunnur.vedur.is/gps/reykjanes.html
Thank-you Rob! I just looked over the Icelandic volcanoes and saw on the SE end of them this one (Öræfajökull):
A clearly positive trend. Some years before Thorbjörn and Fagradalsfjall did the first intrusions, Öræfajökull already had some suspicious development. Likely it’s a longterm trend, but it is a positive trend.
Curious seasonal rhythm to the uplift chart – pauses/dips every spring – I wonder what has caused that?
It potentially can do a Plinian VEI6 eruption like Pinatubo. Would be a major catastrophe for Iceland, Europe and the Northern Atlantic.
Skaftafell is close to the ice cap of Vatnajökull. The glacier adds weight over winter that supresses the uplift. Uplift then resumes during melt season from June through September.
A reply to Bjarki S, not sure where it’ll appear however!?
Many thanks, I was considering the ice cap, just very surprised that seasonal precipitation/melt could have such a clear impact as I assume the measurement is recorded from exposed bedrock? (if it was located on the glacier it’ll be all over shop) Then again a lot of snowfall and then a lot of melt adds up to serious changes in mass.
It’s the same for all of Iceland’s glaciers. The glaciers are melting and the reduced load on the crust causes it to rebound. The oscillating behaviour is correctly from the seasonal variation.
That is probably around the time of an earthquake swarm, causing some concern. That volcano decimated the area during g its last eruption and has the potential for at least European-wide effects..
There is very little uplift at Öraefajökull/Vatnajökull.
What you are seeing is isostatic uplift caused by the melting of the glacier.
You see it both as a general uplift, and as the seasonal variations.
Only Bardarbunga and Grimsvötn has general uplift.
Well, it was an attempt to find something that can fill the news gap after the failed intrusion of Grindavik.
2017 and 2018 Öraefajökull had some seismic and geothermal unrest. How much do we know about the Öræfi Volcanic Belt that hosts Öraefajökull?
I’ve been looking at news on Grindavik. Apparently the evacuation rules have been relaxed somewhat. Residents can come and retrieve stuff and spend some time at their homes, and one or two businesses have reopened.
Some good news for Grindavik.
https://www.icelandreview.com/society/chances-of-eruption-in-grindavik-diminishing/
All well and good til it erupts in their living room while Bargain Hunt is on and they have to play floor is lava for real
As mentioned in the conversation with Chad, the 1919-1920 eruption of the (upper) SWRZ happened parallel to a summit eruption of “Gradual filling” that had begun one month earlier. This shows that both systems can be active: Summit and SWRZ.
2023 the summit did many relative short eruptions: January to March two months; June 12 days; September 6 days. The last two eruptions don’t fit to the label of “Gradual filling” eruptions that happened 1919-1922 on the summit. Will the next summit eruption continue this trend of short term eruptions? Or will some kind of longterm “Gradual Filling” return to the Caldera?
Found a new streaming channel on You Tube. Covers several Iceland webicorders, as well as a couple on the big island, and recent quakes.
https://www.youtube.com/watch?v=Qjd8t_IYwOU
Mac
first
Wednesday
29.11.2023 13:53:26 63.869 -22.405 4.9 km 1.6 99.0 3.8 km NNE of Grindavík
second
Wednesday
29.11.2023 16:16:22 63.869 -22.405 4.7 km 2.5 99.0 3.8 km NNE of Grindavík
Exacly the same place. But the secong one stronger and slightly shallower. Any significance I wonder?
Possibly not. I think Carl mentioned previously that reported earthquake locations are not always that accurate. Those two might have been further away at the same depth, or even the other way round. Or that space travelling tool bag landed and did a couple of good bounces.
LOL Thanks for the reply. I was wondering if those coordinates could cover a larger area than I expected but didnt think about them maybe not being totally accurate So thanks for the info.
Now the season of peace and goodwill has returned to Grindavik, and they are watching Bargain Hunt, I am of the increasing opinion things are on the move beneath their feet. I’ve been looking at the charts and I’m uneasy.
I think this intrusion is now on its way to eruption, and not too far off, either.
Time will tell.
I have the impression that a lot of the current unrest is actually coming from the powerplant. Perhaps they are trying to get the blue lagoon back up and running.
That’s interesting, and good to know. Thank you. Perhaps they’re having problems with the starter motor? These cold mornings play havoc with start motors. Hence all the vibrations. 🙂
A heating plant should have no problems with cold?
IMO has refreshed their frettir page:
“The rate of uplift near Svartsengi has been decreasing, but it is still ongoing at a rate of about 1 cm per day. The majority of the displacement in the region is currently attributed to inflow under Svartsengi with a smaller portion flowing into the magmatic intrusion. In other words, the deformation measured and modeled at Svartsengi is now much greater than that seen near the magma intrusion, but all deformation signals are slowly diminishing. Observed signs of inflow into the magmatic intrusion is now limited to the area east of Sýlingarfell. Despite the slowing down of seismic activity and deformation, an eruption is still considered to be possible. If an eruption does occur, the location thought to be most likely is east of Sýlingarfell.”
1 cm a day, means that the uplift is rate is back as it was in the stage from last week november, when the uplift under Thorbjörn had started.
Comparing the current intrusion with former periods learns that curent has gone skyhigh in a short period, about 100 mm uplift, 350 down during the dyke forming and 200 mm uplift since (SENG). It is is lasting a bit longer than a month now.
The intrusion in april-may 2022 lasted about a month also, about 70 mm uplift (SENG).
The intrusion in 2021 lasted (some small pauses) about six month. The uplift at Svartsengi at the end was about 110 mm.
What I find interesting thar there are hardly quakes listed in the Svartsengi area. If the intusion takes place somewhere in the SENG SKSH area, even when a refill is taking place of the original chamber/sill, multiple smaller quakes should be registered. Everything seen on the graphs seem to come from the dyke.
Last week november should be oktober ofcourse! Sorry for the typos. One finger in action, but lazy… 😉😊
Dont have access to my computer at present so cant bring up my maps, but it seems magma is active along the entire length of Kilaueas SWRZ. The swarms close to the start of the Great Crack flare up within a day of the swarm south of the caldera, and seem to stay active for longer. This area is actually at a very low elevation, less than 700 meters as I recall, an eruption here could have some serious power behind it if it is coming right out of the summit. An eruption as intense as 1974 could probably make an ocean entry.
Lets see if we get a 4th eruption this year. 1961 had 3 summit eruptions followed by a rift eruption in the same year, and followed a major LERZ eruption. Todays situation is not quite the same but could be fairly analogous. Either way 2024 is going to be a very interesting time at Kilauea for sure 🙂
How long can eruptions on SWRZ last? 1919-20 was 238 days, and 1790-1823 there were eruptions that lasted for “months”. But can the SWRZ also do eruptions that last for years? I’m thinking of the longterm eruptions of Puu Oo and Mauna Ulu. An eruption like that on SWRZ would have much lesser rate (volume per time) than comparable ERZ longterm eruptions. But the steady character with long lava flows and lava tubes would be similar.
There isnt any Pu’u O’o type vents exposed on the SWRZ, its not too likely any have existed recently. But then the oldest lava shield from Kilauea on land is Kanenuiohamo which is only 1000 years old, any shield formed in the Holocene would still probably show as a hill even today so something has changed in a major way to allow the ERZ to form shields of the same scale as at the summit.
Wouldnt necessarily say the SWRZ has a different eruption style, it is volumetrically less active than the ERZ but eruptions themselves are very alike.
The rate (volume per second) is lower than on ERZ. But can the length of eruptions be like some ERZ eruptions? Mauna Ulu lasted four years, but had a long break in between. So in fact it did twice long eruptions: 867 and 455 days.
Did the period 1790-1823 on SWRZ include eruptions that lasted a whole year or for several years? The HVO list of historical eruptions is not very accurate concerning this period.
The rate of Mauna Iki was lower than Pu’u O’o but so was Kilauea as a whole. The eruptions in the 70s had moderate to very high eruption rate. The eruptions between 1790 and 1823 were variable, Kealaalea flows were basixally exactly like flank vents on Pu’u O’o, or Mauna Iki. But Kamakaia seems to have been faster to begin with, and Keaiwa was probably getting into thousands of m3/s.
Interesting is the coninuosly upward trend of Kilauea’s deformation since 11/18. It is only short interrupted by small depressions, but the trend has been positive until now:
OT: You guys need a chuckle.
First of all, i abhor the “Florida-man” meme. USUALLY, the person is not actually from Florida and is just a Visitor that didn’t think it out.
https://youtube.com/shorts/LmJyJJfvGRk?si=zfrFSfcvV9doqim6
Thanks for the smile, Lurk. i wonder if he thought that the shark would return him to shore?
Darwin award contender…
Made me laugh but especially after watching the full length version of the video I am pretty sure it is faked. Comments online say that the guy they rescued “terribletim” is known to them. The main guy “Zak Catchem” is Zak Bagby who in real life is also a professional alligator hunter in the tv show Swamp People on the History Channel.
The full length video on youtube also says “This is a real life SCENARIO. Do not attempt to recreate anything you see here”.
Still it was well done!
Because of work on the lava protection berms near Svartsengi, they are disconnecting the main transmission line to the plant to move a pylon. This means that Grindavík will run on back-up power today from container sized diesel generators that are located near the harbour in Grindavík. This should already have happened at 8 AM local time. I wonder if we see any changes to the tremor graphs.
You’ll see a lot of stuff if they don’t phase balance those generators before bringing them online…
Lots of emergency vehicles moving in West portion of Grindavik right now. Don’t know what it’s about. 0940 hrs Grindavik time.
One year after the eruption of Mauna Loa HVO has published a video (inside this article): https://www.usgs.gov/news/science-snippet/reflecting-mauna-loas-reawakening
Youtube helicopter video of 30th November 2022: https://www.youtube.com/watch?v=cjMwWPyjXoU
I was just looking around at some of the webicorders on the big Island. I saw some of this activity on several of the instruments around Kilauea. Kind of looks like tremor? There are some larger waves hitting the Hilo area but those instruments over there are not showing any of this noise. Let me know what you think.
Mac
Could be rain, now that I bring up the radar.
Mac
Yes, I think rain too.
Finally the hotspot of Cape Verde has done something volcanic on the island Brava. Until now it’s only magmatic gasses that cause earthquakes:
“Continuous harmonic tremor emerged on 9 November and was interpreted as indicating the movement of magmatic gases. On 15 November seismicity increased and was characterized by more intense periods of volcanic tremor, long-period events, and “burst” events defined as identical events separated by a few seconds. In addition, residents began to feel earthquakes more often. The Alert Level was raised to 3. Three earthquakes all with magnitudes greater than three occurred during 18-19 November, and harmonic tremor again intensified on 19 November.”
https://volcano.si.edu/reports_weekly.cfm
“From 15/11 onwards there was a worsening of the state of the island. More intense volcanic tremor episodes, long-period events (caused by the shock of magma movement) and burst events (identical events recorded with a few seconds of separation between them) have been recorded.
And from that day on, the earthquakes felt became more frequent and the seismic rate also increased.
Taking into account this set of changes, the alert level went from 2 (which was adopted on 30/10 at night) to 3, at which it is still maintained. … the third [alert level] corresponds to the persistence of seismic activity accompanied by the recording of unambiguous signals of volcanic origin;”
https://www.governo.cv/inmg-atualizacao-da-atividade-sismica-sentidos-nos-ultimos-dias-na-ilha-da-brava/
(original in Portuguese, translated to English by Google)
The magma type of Brava is very alkali with Foidite, Phonolite and Trachybasalt / Tephrite Basanite
“Most of the younger eruptions originated from the interaction of phonolitic magmas with a large groundwater reservoir contained within an older volcanic series characterized by thick welded ignimbrites and block-and-ash flow deposits. Carbonatitic lavas are also found.”
https://volcano.si.edu/volcano.cfm?vn=384020
There are no observed historical eruptions. So the news of GVP about Brava is the first entry apart from the general description.
Sodium metal is an explosive if it comes in contact with water.
Chemistry professor showed us a video of him throwing some off a boat into the ocean.
Chemists love to blow things up and make wine.
That’s a really special volcano. It is not known for certain to have erupted in the Holocene, but the youngest eruption is probably not much older. Brava usually erupts highly alkaline phonolite that is probably the most sodium-rich lava in the world right now, carbonatite often erupts alongside the phonolite. The eruptions can be extraordinarily violent and much of the island is made of overlapping explosion craters, as well as some phonolite lava domes. Would be very damaging and dangerous if it erupts. Wouldn’t want to live on that island.
Is the carbonatite there comparable to the black/white lava of the Ol Doinyo Lengai? There lava is very fluid and black, and as solid lava it changes to white.
As far as I know, the carbonatite of Brava is ash, so was erupted explosively.
https://www.google.com/maps/@14.857481,-24.6871728,13z/data=!5m1!1e4?entry=ttu
I took a look at https://www.capeverde.com/islands/brava, who would imagine that around 6000 people live on this island? Wow! I hope that they are making preparations right now to deal with the volcanic unrest or perhaps evacuate to Fogo.
WOW! I read that as 600 then was shocked to realise you wrote 6,000! How they get drinking water on an small dry Island like that amazes me. I am really hoping the unrest just dies down there.
Brava was restless in 2019: https://www.africanews.com/2016/08/03/cape-verde-evacuates-300-for-fears-of-volcanic-eruption/
and 2016.
Really dry island.. wow.. like CA. See https://www.google.com/maps/@14.8546114,-24.6996937,3a,75y,179.03h,91.48t/data=!3m8!1e1!3m6!1sAF1QipOmcskVyfNOFpMzEl7zLRm2x5XP5b-Bow6pi_xF!2e10!3e11!6shttps:%2F%2Flh5.googleusercontent.com%2Fp%2FAF1QipOmcskVyfNOFpMzEl7zLRm2x5XP5b-Bow6pi_xF%3Dw203-h100-k-no-pi-10-ya220-ro0-fo100!7i7776!8i3888!5m1!1e4?entry=ttu
A more than 25 m deep hole has formed in a residential street in Grindavík. It is a sign that the soil is still moving considerably. The Salthúsið restaurant has also been damaged in recent days.
https://twitter.com/Icevolcanx/status/1730345914357653977
Woaaah! 25 meters down? That’s about eight story building! Can’t believe there’s actually someone standing right next to this unsecured hole to drop a measuring line.
This makes no sense really. Anywhere in and around Grindavik is just a couple meters about sea level. If this whole is really that deep, and not just 2.5 meters, it would fill with ground water rather quickly.
It would also be cause for serious concern if a hole of that size could be anywhere in town, just paved over. It indicates there is not just the rifting taking place, there must also be pre-existing cavities into which the soil can vanish if the rift opens up a bit. The other alternative would be that the rift is small but deep, at least twice what they measured.
I agree. Unfortunately in that twitter chat no link to video this is taken from. You would not get me that close to a sink hole even with safety gear…
Video here:
https://www.ruv.is/frettir/innlent/2023-11-30-meira-en-25-metra-djup-hola-myndadist-i-ibudargotu-i-grindavik-398530
These translations sometime … 😀
“I haven’t been allowed to go to anything but a midget movie and then only to get the main thing.”
A study on Fagradalsfjall’s episodic lava fountains 2021, publicly known as “Lava Geysir”: https://www.nature.com/articles/s41467-023-42569-9
“the critical elements to produce these types of episodic fountains appear to be: (i) a lava lake connected to a shallow cavity via a conduit, and (ii) relatively low magma supply rates, which preclude continuous fountaining activity”
Some erratic movements on the real time GPS near Grindavík for the last two hours.
That was about the time the CME from M9.8 flare hit and maximum geomagnetic storming.
It could definitely have interfered.
From the picture above, perhaps it fell into the hole and was pulled out by the rope.
https://www.ct.ingv.it/index.php/monitoraggio-e-sorveglianza/segnali-in-tempo-reale/video-sorveglianza-vulcanica-etna
Etna is erupting
paroxism, a good view here: https://vedetta.org/webcam/italia/sicilia/catania/vulcano-etna-est/
and here local team live stream HD
Very impressiv!
Yes many thanks for this view too, Magnificent! Etna has exverything one expects in a vocano. Little danger to anyone apart from unfortunate scientists who have in the past got too close. It has glowing cinders, lava bombs, a magificent fountaining and running lava, Everything one could wish to see.
Many thanks for that link Jesper. Very useful with more than one cam.
Great fountain now!
I noticed that there may have been a minuscule magma intrusion at Kilauea starting just after 3:00 HST and lasting a little under 3 hours. There was a very localized spurt of earthquakes right under OUTL GPS just south of the caldera, only 5 located earthquakes in a tight cluster, but up to multiple microearthquakes per minute were visible in nearby seismometers. It was simultaneous with half a microradian deflation of Halema’uma’u visible in the UWE tiltmeter. I might have missed tiny intrusions like this in the past since the tilt or seismic signal is very subtle. It probably shows magma pressure/extension is high enough to split rock apart in that area, but not enough to start a major intrusion yet.