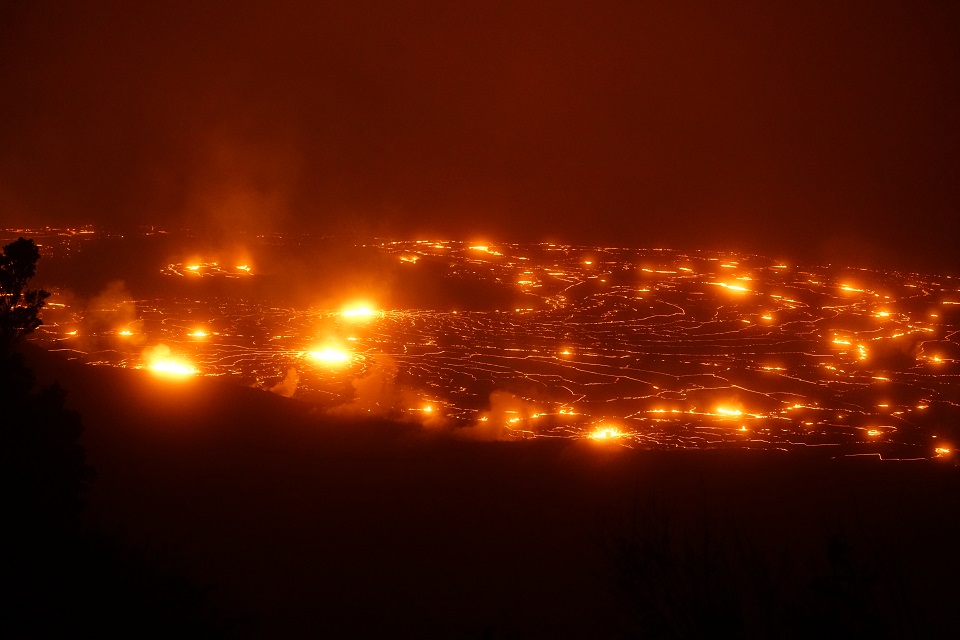
NPS Photo/M.Newman. Source https://www.nps.gov/havo/learn/news/2023-01-06-2023-kilauea-erupts.htm
Tyger Tyger, burning bright,
In the forests of the night
(William Blake, The Tyger)
Lava is lovely. The warm (or hot) red colour gives it beauty, and the intricate movement of a lava flow makes it mesmerizing. But it is at night that the lava really comes to life. What appeared shiny black in the light of day, becomes incandescent in the dark of night. The solid crust is still black. But wherever this crust breaks and the liquid lava below comes through, it shines with a bright red or orange light. If you have the chance, go and have a look at lava at night. It is an experience for life.
The light is a matter of temperature. Lava at 800C appears red. If it looks more orange (and much brighter), then it is probably 1000C or more. The solid crust is 500C or less and this produces little light that our eye can see – in any case, the brighter lava drowns it out.
Our eyes, of course, are not optimized for seeing lava. Our skin is rather better at it. Lava, like one of our old incandescent light bulbs, emits far more heat than it does light. (LED lava has yet to be invented.) Almost all the energy comes out in the infrared which we can’t see but can feel. In fact, that shiny black lava may not look that dangerous in daylight, but our skin tells us to stay well away. The radiant heat feels burning hot even a few meters away. If we had infrared eyes, that lava flow would look like Dante’s infernal hell.
Lava-fires
In what distant deeps or skies
Burnt the fire of thine eyes?
On what wings dare he aspire?
What the hand, dare seize the fire?
But we don’t need to change our eyes. Nowadays we have cameras that can ‘see’ infrared light. Some see ‘thermal infrared’, sensitive to body warmth. These cameras reveal wildlife (or people in hiding) at night. Some see much hotter things: point them at a train and the wheels show up brightly while the rest of the train is dark. And some look for even hotter stuff, such as fires – or lava. And best of all, we can put those instruments on satellites, allowing us to see places we cannot get to.
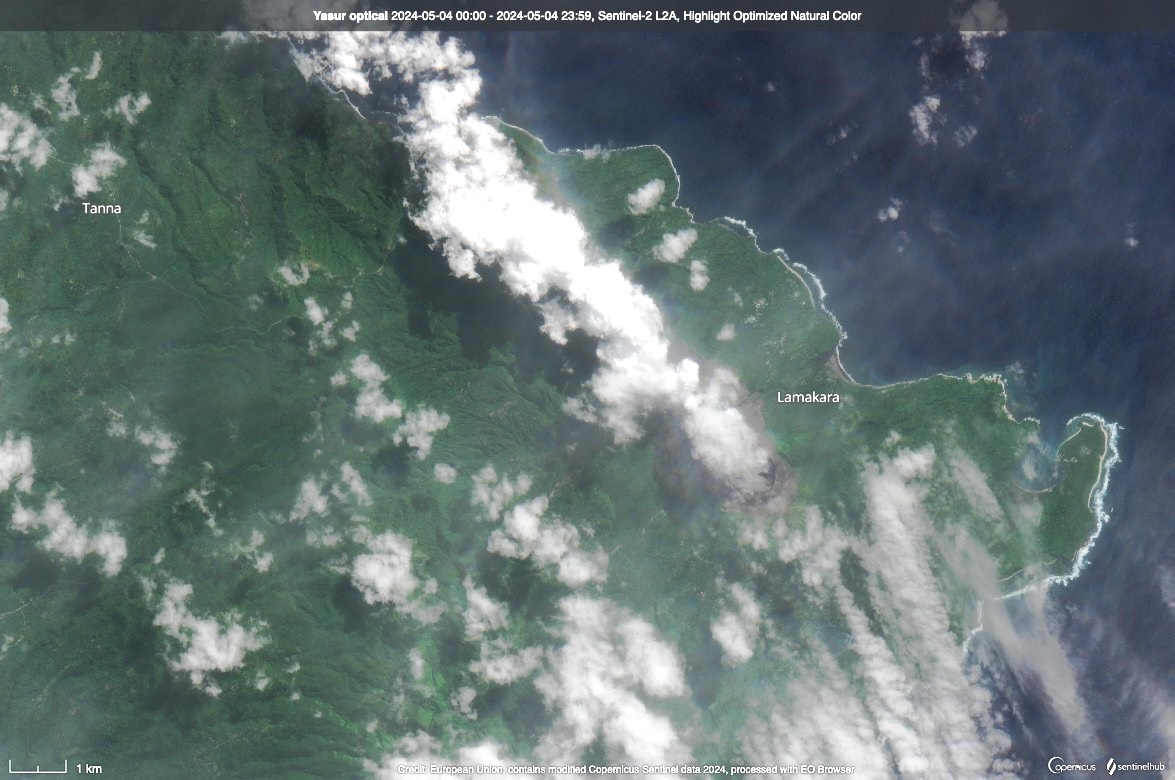
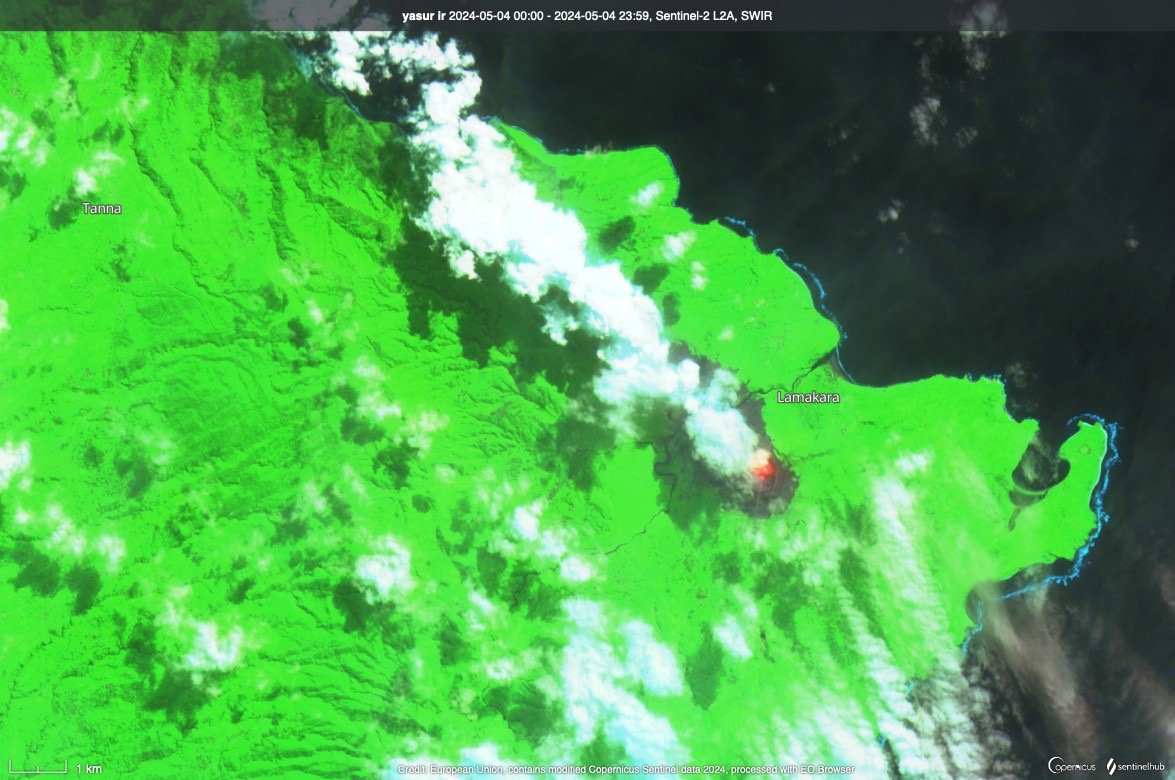
Here is an example from the European Sentinel satellites, with an image of the region around Mount Yasur on Vanuatu. The first image is taken in visible light. The second one combines this with an infrared image. And suddenly, the lava lake at Yasur comes to light.
The infrared filter used for this detects light at a wavelength of 2.1 micron, about three times longer than our eyes can see. This is ‘short-wave infrared’ and is sensitive to hot lava. These filters were not designed specifically for lava. The filters were devised for reflected sunlight: this filter is good at picking up reflections from burned vegetation. But hot lava emits infrared (heat) radiation and that is also picked up. The lava needs to be hot, and therefore the filters mainly see the on-going effusive eruptions. Hunga Tonga may have been missed. If you want to try it out (https://apps.sentinel-hub.com/eo-browser), pick the ‘False colour urban’ or the ‘SWIR’ visualization.
The MODIS instrument operates on two NASA satellites: TERRA and AQUA. It sees a very large area (at lowish resolution of around 1 kilometer) over a very wide range of wavelengths. They go to much longer wavelengths than the Sentinel. The main infrared bands rage from 3 to 14 micron. Therefore, they are in principle sensitive to cooler magma. (Be aware that for some of the bands, the atmosphere is opaque so the satellite will only see the upper atmosphere.) The main bands to use are those around 4 micron.
Both satellites are now quite old. A newer satellite doing this work is Suomi, which is ‘only’ 13 years old (the usual expected life of such a satellite is 5-10 years). (These satellites were designed for climate monitoring and perhaps the delay in replacement is related to the ‘don’t look’ attitude towards global warming that is held by some of the people in charge of the funding.) The relevant instrument on board Suomi is VIIRS. It is not quite as versatile as MODIS but covers a similar range of wavelengths. The band that is labeled ‘fires’ is at 4 micron and should easily see lava at 500C. (It is currently out of operation due to an issue with the GPS.) Of course, not everything that is hot is volcanic! Ukraine also showed up well, under explosive attack from Russia.
The MODIS and VIIRS data are used in a system called ‘FIRMS’, which aims at detecting fires anywhere in the world. It can be accessed at https://wvs.earthdata.nasa.gov: just set the country name and resolution and off you go. Below is an example for Rwanda, where the cut-out shows two small hot spots, corresponding to Nyiragongo and Nyamuragiri in the Virunga mountains (neither are in Rwanda, but countries don’t fit well into square boxes). There are 6 peaks taller than these two in the Virunga mountains, but none of the others currently show this heat signature. Their fires are extinct. Note that this system by default shows data from today: buttons on the preview can be used to show recent days.
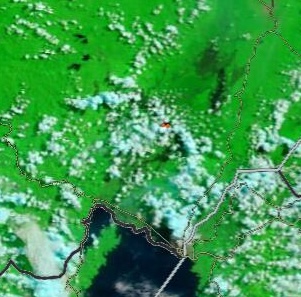
Virunga
Again, not everything that shows up is truly volcanic!
MIROVA
Did he smile his work to see?
Did he who made the Lamb make thee?
The VEI scale (volcano explosive intensity) is, as the name says, suited for explosive volcanoes, the flares in the night that are gone by morning. This scale is now widely used, and it works well for those volcanic tigers, albeit nowadays focussing on only one aspect, the volume ejected by the explosion. The VEI scale does not work well for volcanoes that produce copious lava but eject it at leisure, with a whisper not a bang. We need a scale for the volcanic sheep, one that properly puts them in their place and allows comparison with the big beasts. Their heat may be just what is needed.
The satellites can do this. The do more than just detect a glow of lava. They can measure the heat coming from those volcanoes. It may not always work well for explosive events where it is a matter of luck whether the satellite looked in the right direction at just the right time. Raung’s explosion was seen, but was it seen at its peak? But for effusive volcanoes, the eruptions last long enough to be captured in full. The heat gives us the energy, and the energy gives us the power of the volcano. It turns out that volcanic sheep are more powerful than they may seem.
The actual number to use is the ‘volcanic radiative power’. It is measured in Watts. By measuring this over a long period, the total ‘volcanic radiative energy’ can be calculated. This is the ‘VRE’, and yes, this is proposed to be used instead of the VEI.
The radiation comes, of course, from the heat, mostly from the lava but part is from hot gas escaping from the volcano. The lava reaches the surface at magma temperatures and then begins to cool. About a third of the heat is emitted while the lava is still liquid. Once the temperature has cooled to some 750C, the lava solidifies by continues to cool. The remainder two-third of the heat energy is emitted by the lava after it solidifies but before it has cooled to room temperature. It can be a slow process. The radiative power initially comes from the liquid lava and later from the solidified, cooler stuff. The power goes down over time, of course, but the total energy still ads up because this lasts a long time. The heat from the lava may also heat the ground and this stored heat can be radiated at a later time. Ground water takes up some of the heat. The volcanic plume carries heat upward in the atmosphere. To a satellite, that does not matter. It observes the site four times a day, 6 hours apart, and detects all the heat that is radiated there, whether directly from the volcano or indirectly from the air or the ground. Don’t expect detail, though: each measurement covers 1 square kilometer.
Robert Wright and collaborators did this for the period between 2000 and 2013, using the MODIS data from the two volcanoes. The results were eye opening. Of the volcanoes that stood out, Bardarbunga, through its 2014 eruption, accounted for 6% of the total volcanic heat production over that time. Tolbachik in Kamchatka produced almost as much: it had a large effusive eruption in December 2012, with some activity lasting until September 2013. But Kilauea and Nyiragongo were the dominant beasts, each accounting for 20% of the total heat! The latter did so without actually erupting: the energy came purely from its lava lake. The most intense eruptions of the period were in Afar.

Wright et al, 2014: Volcanic heat energy for the period 2000-2013
Diego Coppola and collaborators set out to improve further on this, again using the MODIS data. They combined the 4 micron and 12 micron measurements, to be more sensitive to cooler volcanoes. They included 111 volcanoes, for the period 2000-2019. This became the Mirova database. It is available on-line, and has been updated since: https://www.mirovaweb.it As I write this, Kilauea has shot to the top of today’s list, after it started to erupt, with a power output of just over 1 GW. The Grindavik eruption is doing less than 20% of that – at least at that moment.
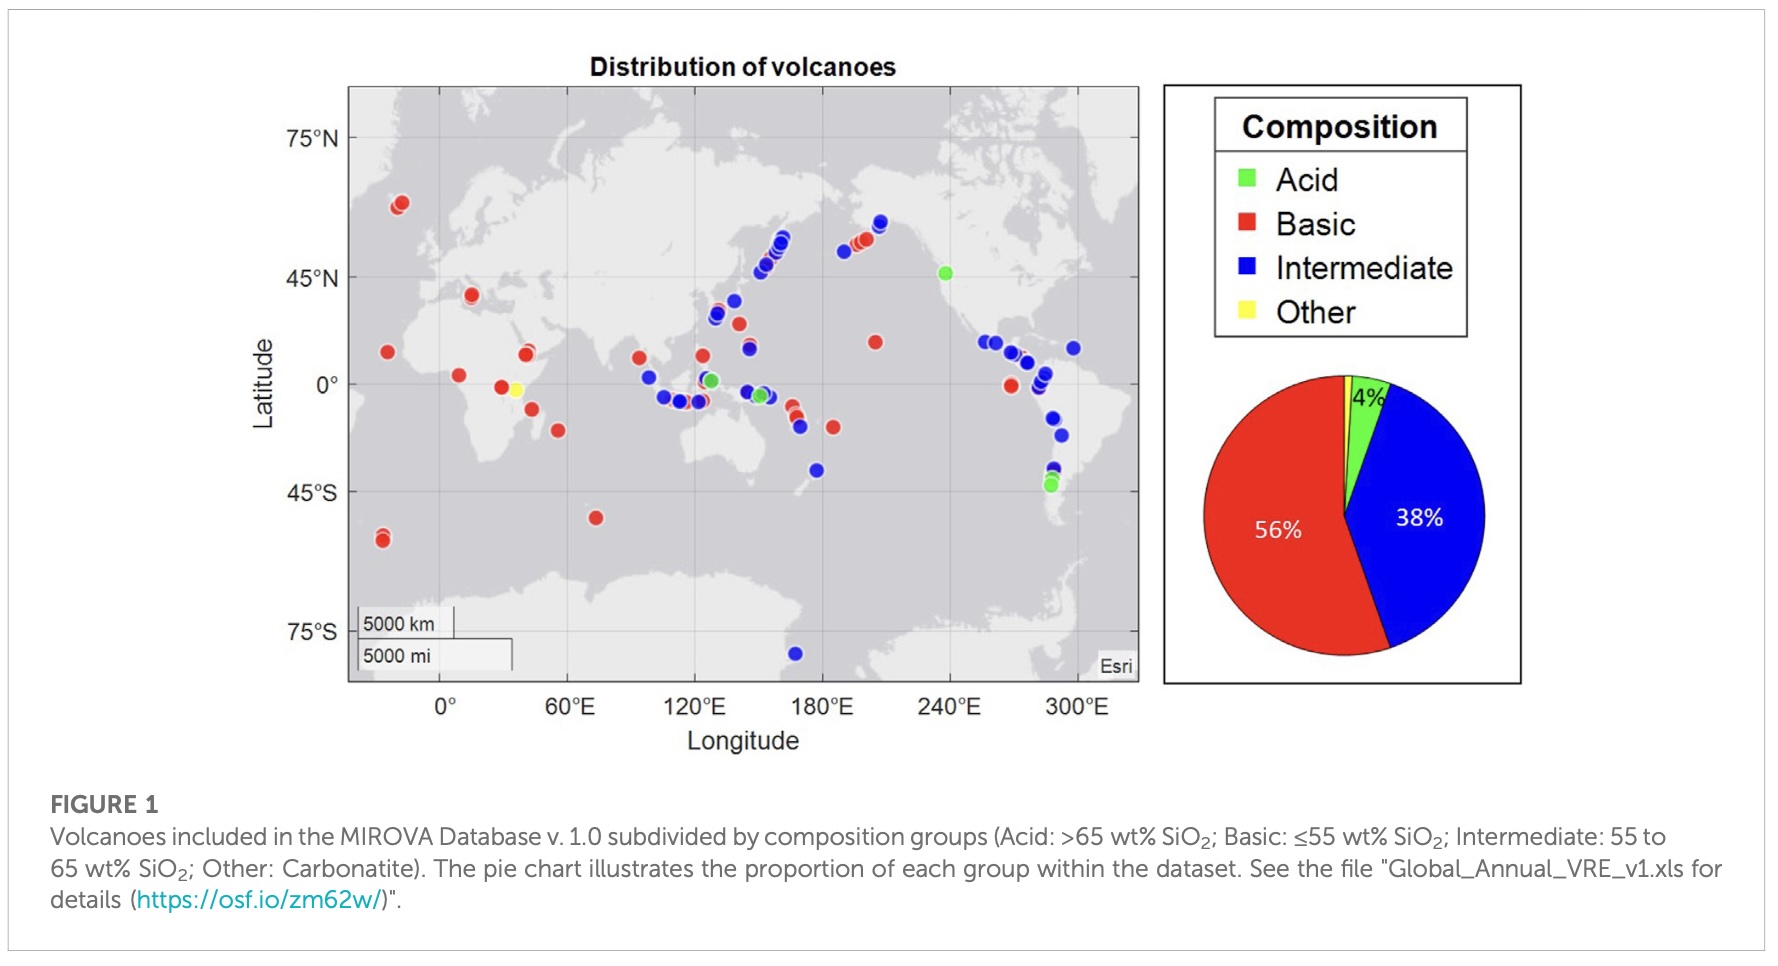
Volcanoes in the Mirova database
Yasur volcano has already been mentioned. It is in the Mirova database. The data for Yasur is shown below. The power of the volcano has increased over time by a factor of 2 or 3. Before 2003 the data is patchy and this is perhaps best ignored. And for comparison, the power output is about ten times less than that of today’s Kilauea eruption. Not bad for a volcano that isn’t actually erupting!
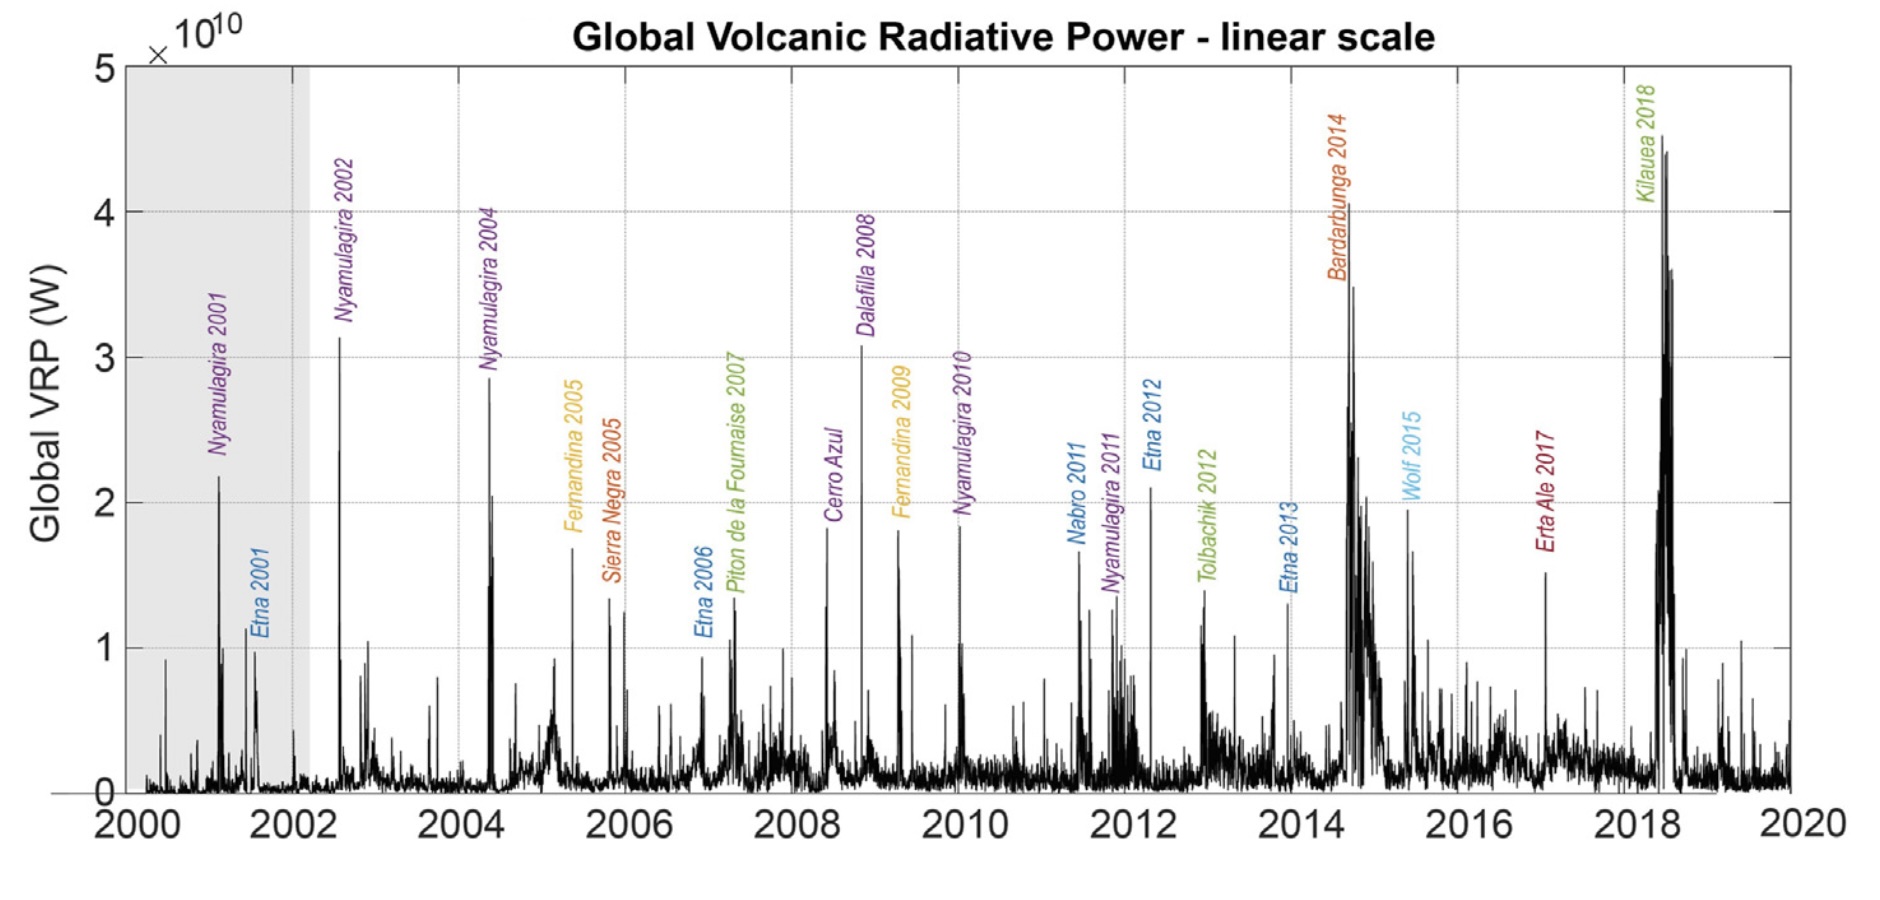
The most intense eruption (regarding heat output) of the period was Kilauea in 2018. Looking at the plot below, it is clear that the peak output of the 2018 eruption occurred not at the start but sometime later. Bardarbunga in 2014 was different: it peaked at the start and declined after that. There were a number of fast eruptions during the period of the plot but they did not reach the same peak, and of course did not last long.
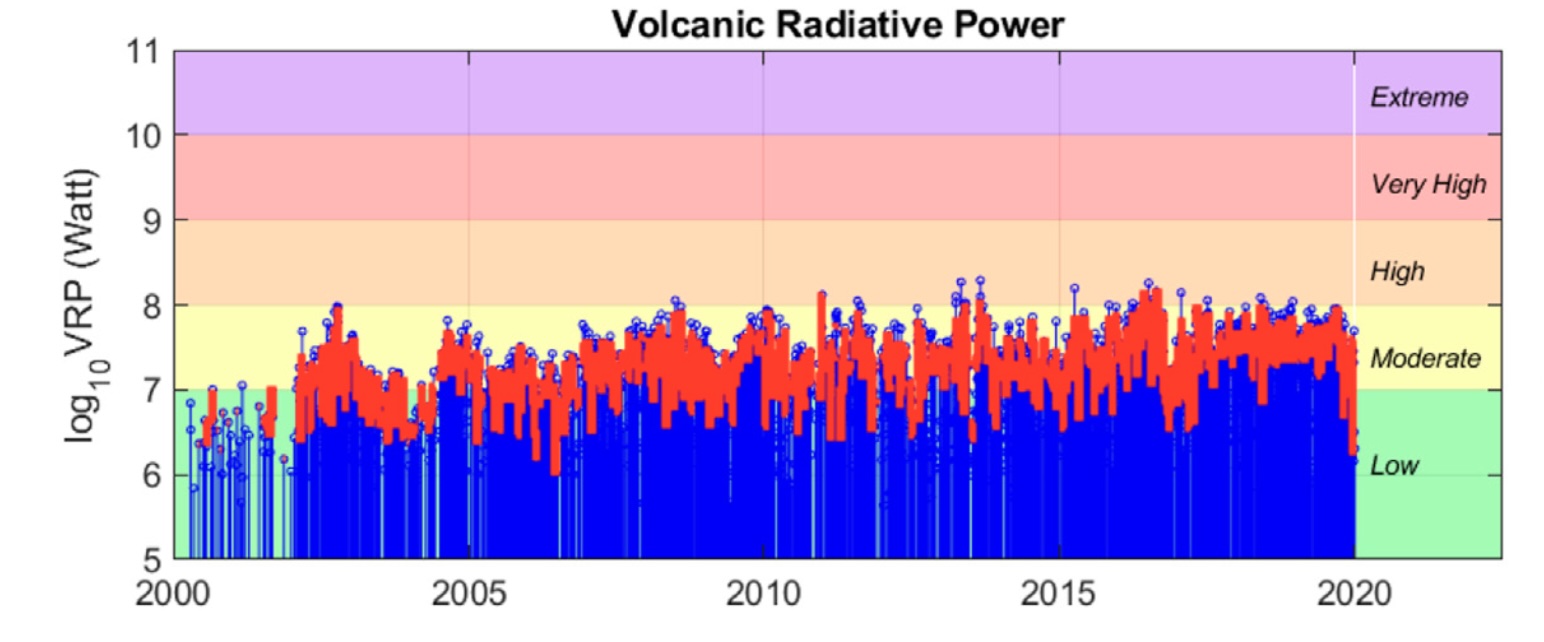
What does it look like when adding up all the volcanoes together? That gives the plot below. (Note that it is now on a logarithmic scale while the previous graph is linear.) The two big eruptions of the time still stand out. The red line gives a weekly average and the black line a daily one. The orange line is different: it is the contribution of Nyiragongo alone, a volcano that is not mentioned in the first plot. Its contribution has been continuous after 2002, due to its long-lasting lava lake which was growing during this time.

How many volcanoes are active at anyone time? This is not the same as how many are erupting: it is about how many are producing heat. The answer is, a lot. The study found 60-80 per year, and 25-40 each week. Many are remarkably persistent. Defining this as the fraction of weeks that a volcano produces heat, 13 volcanoes have a persistence of more than 80%. Erta Ale has the top persistence and Yasur is the final one of the 13 above 80%.

The persistence can come in different ways. A lava lake is a big help. An open conduit can act as well (Yasur). Finally, a lava dome also creates persistence, as seen for Popocatépetl.
Ranking the volcanoes on total energy output over the time gives the ranking below. Kilauea wins, and Bardarbunga does well even though it erupted only once (it is likely to drop out of the top 100 next time). But two of the top four are in the Virunga mountains! Hot spot volcanoes do very well – not surprising as they have a reliably source of heat, something subduction volcanoes don’t have.

This should however be seen in the context of the short time span of only 20 years. There were no large explosive eruptions in that time. Tambora’s energy output is estimated at 10^20 J. That is more than 200 times larger than Kilauea’s over 20 years. Over the 200 years, Tambora still outperforms Kilauea by a factor of 10. Laki is another comparison: it may have emitted ten times as much energy as Bardarbunga did in the past 20 years, so over 200 years it would be similar to Kilauea but ten times smaller than Tambora. Tambora would still be off the scale.
An eruption of Tambora’s size may happen perhaps once every 500 years. Over that kind of period, the top volcanoes in the list would generate a few times less energy than Tambora. So the ranking of that time would still have the big VEI-7 at the top. But Tambora may take tens of thousands of years to be ready for another event like this. Over such a long time, the numbers are very different. 20 or 30 of the listed volcanoes could outperform Tambora over that time.
The bottom line is that over very long periods of time, the slow burners such as Kilauea and the Virunga volcanoes win out over the big explosive volcanoes. Sheep versus tigers: the tiger explodes into action but only briefly. Sheep have the same (limited) activity all the time. In the end, they produce or use very similar amounts of energy.
The energy that a volcano produces is not directly related to erupted lava. Lava carries the large part of the heat, but a bubbling lava lake or even a lava dome can emit a lot of heat without actually having to erupt the lava.
The VRE scale is not easy to measure or use. But it is a good way to honour the non-explosive but very active volcanoes. Honour the sheep.
Albert, June 2024

This post is based on the following two (open access) papers
Robert Wright, Matthew Blackett, Charley Hill-Butler :Some observations regarding the thermal flux from Earth’s erupting volcanoes for the period of 2000 to 2014. Geophysical Research Letters, 42, 282-289 (2014). https://agupubs.onlinelibrary.wiley.com/doi/10.1002/2014GL061997
Coppola D, Cardone D, Laiolo M, Aveni S, Campus A and Massimetti F (2023), Global radiant flux from active volcanoes: the 2000–2019 MIROVA database. Front. Earth Sci. 11:1240107. https://www.frontiersin.org/articles/10.3389/feart.2023.1240107/full
William Blake
Tyger! Tyger! burning bright
In the forests of the night,
What immortal hand or eye
Could frame thy fearful symmetry?
In what distant deeps or skies
Burnt the fire of thine eyes?
On what wings dare he aspire?
What the hand, dare seize the fire?
And what shoulder, & what art,
Could twist the sinews of thy heart?
And when thy heart began to beat,
What dread hand? & what dread feet?
What the hammer? what the chain?
In what furnace was thy brain?
What the anvil? what dread grasp
Dare its deadly terrors clasp?
When the stars threw down their spears,
And water’d heaven with their tears,
Did he smile his work to see?
Did he who made the Lamb make thee?
Tyger! Tyger! burning bright
In the forests of the night,
What immortal hand or eye
Dare frame thy fearful symmetry?


https://3d.map.is/?fbclid=IwZXh0bgNhZW0CMTAAAR3lKkOH0wXvwMx8awPGu9kskVNiRkpWXGbcPqSaI18meJFgKA425K3TaqA_aem_AUe_-W2rn5nmrxuG5c6fYbIAzZRXA0IgJ8j2SLGTixWS3-qwXS1z_K5ZI4y9xer_ZvcwaO064qPyYK4vD-LuaBzP
WOW here is an ultra resolution zoomable map of entire Iceland! its about 4 to 6 times resolution of google earth and haves a terrain 3D resolution thats perhaps 10 to 15 times Google Earths resolution the resolution is quite extreme here so fun to explore. As Nordic citizen, Im free citizen I really wants to move to Iceland so I can have volcanoes and skip electricity and heating bills they get it free. This is the best 3D map of Iceland so far ever made and will provide a great geological learning tool
I had absolutely no idea that this was happening but Ioto was still erupting well into April and into the beginning of May. Gonna have to wait for the May report for additional information. The southeast quadrant have been seeing smaller eruptions more frequently since 2022 but in April of this year there was some small eruption on the more untouched NW
https://www.data.jma.go.jp/vois/data/tokyo/STOCK/monthly_v-act_doc/tokyo/24m04/329_24m04.pdf
It looks like the inflation is now at 80cm per year! There are a lot of relic explosives lying around, and not all explosions may be volcanic. But the activity has increased a lot and Japan may wish to consider evacuating the island until things calm down again.
I do remember someone posting thermal images for the volcano. does anyone have any updates on that?
Although the eruption of Kilauea was minor, dangerous cracks appeared/widened in Kau desert:
“Most cracks that formed during the June 3 Kīlauea Southwest Rift Zone eruption are several inches (2 to 5 centimeters) wide with some extending to up to 6.5 feet (2 meters) wide.”
That crack is probably the top of the dike itself, theres probably fresh magma within 100 meters of the surface all along it. Its probably an area to watch, its only been a week and in another week it could go for round 2.
The cracks normally come from the subsidence of the crust in the centre of rifting. The magma in the dike pushes the sides to the side, so the surface above the dike subsides. This does not require the magma to be particularly shallow, but when you see it, an eruption seems more likely than not because it shows there is an easy way up for the magma. This eruption is probably spend, though: I don’t expect that it will resume. The next intrusion may take a very different path. Or not.. For a large eruption in this region, the dike would need to extend further, to a lower-lying area.
We will see, there was basically no deflation with this intrusion, about 12 million m3, and the new insar shows total deformation from the dike was only about 300 meters wide so the dike was shallow and probably passive, which is why I think that crack is probably the dike itself. The one in January was probably about 5x more voluminous although the total length was not too much more. Its been too little time to cool yet
The quakes showing now are also all in the south caldera and upper ERZ connector, the same place as a week ago. The caldera and area between Keanakako’i and Hi’iaka are quiet. Its a rifting event like at Sundhnjukur just a part of a massive central volcano. Its normal for Kilauea to erupt this way having many repeated dikes in the same line. 1961-1969 had 3 parallel rifts active on the ERZ together at the same time and even sometimes simultaneously in a single eruption. One of them spawned Mauna Ulu at the end.
Mauna Loa doesnt do this, it goes all in a single huge rift, although Kilauea does this too when it erupts in the lower ERZ.
From human perspective this looks like a “random activity” time, when everything can happen everywhere anytime in the upper Kilauea region (Summit, upper RZs). But: Times like this usually do small eruptions from a single day to a handfull days. We can relatively certain exclude any kind of longterm and voluminous eruptions as long as this period continues.
Yes, in places where the cracks are 2 meters wide, they might be the dike itself. The intrusion was very shallow; the InSAR shows practically no graben, and the dike extends basically up to the surface along the whole length. Probably the dike intruded above the February one, filling the bit between the top of the February dike and the surface. Weird stuff.
All in all the Summit and upper rif systems are active now, while the low rift systems are shut down. HVO states that “Eruptive activity and unrest have been restricted to the summit and upper rift zone regions.”
We can expect relatively randomly eruptions everywhere on high altitudes of Kilauea. Maybe the SWRZ not next time, but later again. If we look at 1974 (after Mauna Ulu’s final), there were two Kaluapele eruptions prior to the 31/12/1974 SWRZ eruption. Both were short, they lasted single day resp. three days. Periods like this appear to lead to small eruptions.
HVO: “Rates of seismicity beneath the summit, upper East Rift Zone, and upper Southwest Rift Zone were elevated over the past day. Earthquakes were mostly located beneath the south caldera region and upper East Rift Zone, at depths of 1.5-3 km. Inflationary ground deformation of the summit continued over the past day.”
Its like 1961-1969, following a big eruption in the lower ERZ there was a pause then eruptions in Halemaumau filling the LERZ collapse, very rapid summit inflation, and it broke out on the ERZ. We basically are up to that stage right now only instead of it taking 1.5 years its taken 6, much bigger hole to fill. And it went southwest this time too.
After 1961 there was an eruption in Alae crater in 1962, a different fissure swarm to the 1961 dike. In 1963 both of these dikes erupted again in different eruptions and the Aloi crater fissure swarm also became active too. I think there was also a SWRZ intrusion in 1963. 1964 was silent but 1965 had a major curtain of fire eruption along the 1961 rift, 8 km of fissures and a vent in Makaopuhi that kept going for several weeks and erupted really hot lava, compared to slightly evolved stuff of past years nearby. Same year Christmas Aloi and Alae erupted, very small but there was a massive intrusion west into the Koae. So in 1965 there was rifting from east of where Pu’u O’o is now all the way to near the Hilina Pali road or even west of that.
1966 was quiet, 1967 had a major long lived eruption in Halemaumau nearly filling it to overflowing, lasted until 1968. Weeks later eruption in Hi’iaka crater, so a 4th fisdure swarm, very hot lava again. It flowed downrift in a long shallow dike with a visible surface crack down nearly to the lower ERZ. Might actually be the same crack the 2014 flow went into too. There was another 1968 eruption at Napau on the 1961 rift, the 4th such time, another curtain of fire.
1969 had a major curtain of fire on the Alae rift. Then a few months later and a tiny bit north on the Aloi rift another similar eruption in May 1969. A vent on the May fissure kept erupting, it became Mauna Ulu. 14 years later after the middle ERZ was fully unlocked in the 75 quake, a long fissure opened 100 meters south of the 1961 rift. It became Pu’u O’o.
Not saying it will go like this now but we are basically at the starting point of what could be a pretty exiting time. It looks small at the surface because the magmafills in underground, until suddenly there is no more underground. Kilauea created Mauna Ulu less than 10 years after the Kilauea Iki-Kapoho eruption. And it went on to create Pu’u O’o less than 10 years after Mauna Ulu stopped. 2018 was a bigger drain but 6 years of magma supply at Kilauea is about 1 km3 out of 1.3 total. The next open conduit could be before 2030.
Since 2018 we have a situation that the Middle and Lower ERZ have been shut down completely. The 1960s were a transitional period between Kilauea Iki/Kapoho 1959/1960 and Mauna Ulu 1969-1974. After Mauna Ulu there was again a transitional period until Pu’u O’o.
It looks again like a transitional period since 2018. But unlike the 1960s and 1970s this time without MERZ eruptions. Napau 1968 was Middle ERZ. Was it an early sign for Pu’u O’o that 1983 started the first eruption at Napau? 1977 was another MERZ eruption east of later Pu’u O’o location.
1983 HVO (cited by GVP) wrote: “”An eruption in the E rift zone began at 0031 on 3 January. The outbreak began at Napau Crater ”
1997 there was again an ancillary eruption at Napau: https://www.soest.hawaii.edu/GG/HCV/ep54.html
As long as the Middle and Lower ERZ are closed, we should expect that no eruptions occur at or near Napau crater. Mauna Ulu area is the border between UERZ (upper ERZ) and MERZ. There should be the eastern limit of possible eruptions during our transitional period.
I used to think of it that way but I looked at it more and i think basically Pu’u O’o was just Mauna Ulu relocated. Mauna Ulu was too tall, it was taller than Halemaumau in 1971 so rifts began opening beyond it nearby and at the summit. Same thing again in 1973-74. I think possibly Mauna Ulu tried to restart several times in 1975 but the pressure was too high and it ultimately shoved the south flank away. Now magma had a new lower place to erupt so it made Pu’u O’o which also started to get too tall and cahse ither eruptions vut none enough to kill it. Until 2018 when the rift east of Pu’u O’o opened and the south flank moced again. This time it had an immediate way out and way too low to erupt slowly so it went out of control.
Now it js more like in 1961, but with 2x higher magma supply rate and a rift that is at the same time wide open but not connected. The SWRZ will dominate for now, it us an easy path. But I think it might become like Mauna Ulu and be too high up to be the next Pu’u O’o, although ultimately I wouldnt be surprised if much of the Kau desert is under lava in 2030. Once the ERZ is connected up again the magma will flow that way and probably erupt as low down as possible. Then we get another Pu’u O’o.
Compared to 1961 the MERZ is more closed now. Mauna Ulu doesn’t show any deformation or seismic activity. But this can change in more distant future.
The SDH Tiltmeter indicates that the southern caldera area may await something next. Maybe like 9/1982 or 7/1974:
Its actually not what it looks like. The middle ERZ is wide open, at Pu’u O’o the ERZ has spread by about 0.2 meters. MALU station has also moved south by 0.2 meters since 2018. Magma could get into the ERZ after 2018 and even far east beyond Pu’u O’o as late as February 2020 but it stopped once summit eruptions resumed.
But maybe more importantly Pu’u O’o still strongly responded to the August 2021 SWRZ flare up but only weakly to the September 2021 eruption a month later, and not at all after that with continuous linear deflation ongoing since then. The deflation at Pu’u O’o is south flank movement not being backfilled by magma. I think the SWRZ is pushing in the right way to basically pinch off the ERZ in the Chain of Craters area. Maybe this also happened in 1974 preventing Mauna Ulu restarting and causing the overpressure that set off the 1975 quake but maybe not.
I guess that at some point, maybe in 10 days or 10 years, the pressure will overcome that and push east. Might result in a quiet period like the late 70s but it could also just start erupting the same year too, depends on how much magma js available.
The tremor is getting a little stronger and the tilt at SDH is still rising. A new eruption soon?
I think in a weeks time we will get an answer to that. But RIMD seismometer seems to be having issues now so best one to look at is probably at SDH. Seems to be some tremor at normal levels but a lot of small quakes the maps dont locate well or at all.
I don’t think it is at normal-normal levels. Looking at the last 24 or 48 hours, it seems to ‘thicken’. The same can be said for the KKO and HAT seismographs. Something is going on…
SDH – 24 hours
WRM – 24 hours
UWB – 24 hours
NAHU – 24 hours
HAT – 24 hours
KKO – 24 hours
I take back that an eruption might be occurring, but these are odd. I might be interpretation something else, as something like this has occurred but no eruption, but I just found it odd.
The SDH is going up a little quicker and the UWE has mostly recovered all of its uplift.
We know Kīlauea will eventually erupt, but where or even when is the question…
I havent looked at the longer term it does actually look like something might be going in. And SDH tilt went up more than I realised too.
While Mauna Ulu’s GPS looks harmless, the next tiltmeter to the west shows this (should be close to Pauahi Crater):
 ?fileTS=1718012966
Does the green line mean inflation?
That is possible but cannot be certified with only one station. A tilt is just that: it shows a change of slope. That can be inflation to one side or deflation to the other
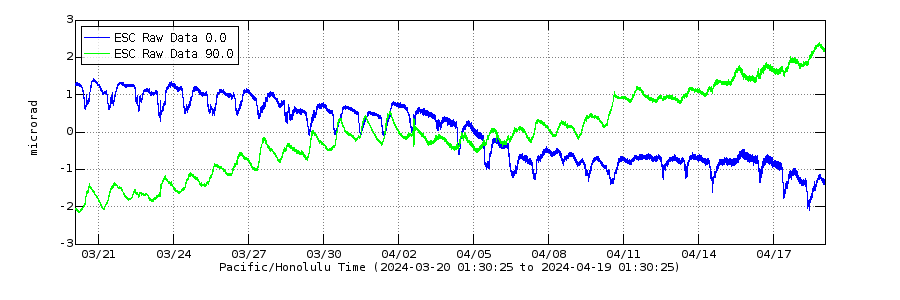
The ESC tiltmeter probably reflects a mixture of inflation of the South Caldera area and deflation of the East Rift Zone from downrift of Mauna Ulu. Since the ESC tiltmeter is between two deformation sources, it’s difficult to distinguish if there is inflation coming from one side or deflation from the other, as Albert says, but both of them are happening.
The green SDH component and UWE are more straightforward to interpret because deformation only comes from one side in them, so you know down is deflation and up inflation, a reduction or increase in the radial tilt from either the South Caldera sources or the Halema’uma’u source, respectively.
This is on the east side, at the IKI station. It is inflating, albeit less so than the other stations.
There is a tiltmeter at SMC, but it is not working right now.
SDH is now well above the last intrusion point. And UWEV is getting close. Still pretty quiet though so maybe the rift opens more seriously this time like it did in January. Could be an eruption like 1974 soon.
The summit can do a big variety of eruptions from Halema’uma’u’s position over the whole Kaluapele caldera to Keanakoki crater.
Can we exclude Kilauea Iki for future eruptions? During 19th century there were three eruptions: 1832, 1868, 1877. They were all below 0.01 km³, while 1959 was 0.05 km³ and with 36 days much longer. This looks as it 1959 was extraordinary for Kilauea Iki, and shorter (hours to days)/smaller eruptions are more typical.
Kilauea Iki was the source of the very extensive Aila’au flows north of the ERZ, an eruption not dissimilar to Pu’u O’o in size and duration. So it isnt always small. 1959 was also very powerful for a magmatic eruption in Hawaii, over 1000 m3/s from a single vent and over 500 meter fountain at one point.
1959 also formed an open conduit too, had the ERZ not been active it probably woukd have kept going and became a long lived eruption, but Pele had other plans it seems.
But for right now it seems unlikely. The magma wants to go southwest. But if that proves inadequate to relieve pressure its not impossible some of that goes through Kilauea Iki. The fact the 1959 lava was so hot and magnesian probably means it at least is possible for the deeper system to erupt directly at Kilauea Iki bypassing Halemaumau.
A’a lava flow has crossed Grindavikurvegur (Grindavik Way): https://www.ruv.is/frettir/innlent/2024-06-08-hraun-hefur-nad-grindavikurvegi-415178
The Blue Lagoon has been evacuated and closed. Maybe the A’a flow allows a good Barbecue location for UEFA’s Euro 2024?
Not volcano related at all but last article I had created a comment chain about electric motor powered cars and the bizzarely rare concept of the EREV. For anyone sceptical or otherwise curioys of the concept the 2024 Dakar Rally was won by an EREV in the Audi RSQ Etron. Used half the fuel of a typical car.
But apparently the concept of an engine not being connected to the wheels is an illegal thought process for automotive engineers, either is an engine with accessory battery for regen or only the battery. An EREV is an electric car, can be charged, driven 10x longer than 99% of people usually drive on EV only. But you can also drive it where theres a charger gap. And because the engine is a range extender it only needs to make the average power of the vehicle not the peak. 4L/100 km is 40 kWh/100 km thermal so x0.4 is 16 kWh/100 km. But the motor to the wheels could be rated at 200 kW, so you get that when you need it. A 50L tank would give you 1250 km of extra range, while the EV range is already probably at least 300 km. And no heavy transmission or driveshafts, and realistically the engine is a generator so will probably never run outside its efficiency band and require emissions equipment. So it might actually weigh less than an ICE only car while being an EV.
https://www.audi.com/en/sport/motorsport/dakar/rs-q-e-tron.html
Also useful in winter when heating is required.
On a long drive in a cold place yes, but a heat pump to scavenge motor heat would be better on most drives. You dont want the engine running if you are driving 10 km down the road for example, or just turning the car on to move it in the driveway.
I guess it could have an EV mode and ‘hybrid mode’. They are the same EV only up until the battery is at an arbitrary low say 30%, but on H mode the engine would turn on to recharge, maybe running until 80% SOC. But unlike a traditional hybrid it should also be possible to turn off the engine at any time and any SOC.
This is how most diesel railway locomotives operate, technically they’re diesel electric.
Yes although those dont have an intermediate battery which would be needed in a car.
Edison Motors is doing this in a logging truck, diesel electric with full EV mode capability.
Electric motors are the far superior mode of spinning wheels.
Those logging trucks are cool. Get the truck up on some mountain and add a whole lot of potential energy with the tree weight. Recover it on the way down and then use the electricity to drive the logs to their next destination on the flat.
Or you could just float the logs down the river..
Not all logs are near suitable rivers 🙂
The Edison trucks are still plug in, and they are making a kit for pick up trucks too based on the same concept. But the logging truck is a little different to my idea, the diesel is specced to provide the maximum power of the vehicle not the average. So it can run without the battery in certain situations. I think it would be a little less efficient than ideal but then running 200 kW through the battery for more than a few seconds is probably worth burning a bit of extra fuel to avoid too…
Their truck they called ‘Topsy’ was able to tow 30 tons from a dead stop without being slowed down, driving off as easily as it did empty… Its hard to put into words how mind bogglingly powerful electric motors are.
Not all logs are near suitable rivers. Once you cut down forest, water erosion tends to follow, so you may just have to wait a bit…
Perfect timing really.
https://youtu.be/5Qu-BDixGYY?si=6nSiJvDamKKzL-yR
Tesla model S with a diesel generator. Its also worth noting the Model S is probably the most powerful ‘normal’ car you can buy, 500 kw AWD 0-100 in 2.5 seconds. And it also weighs 2.3 tons. If he did it in a Model 3 which weighs 500 kg less…
Also he ONLY charges the car with the generator, not plugging it in at all, so it is literally an ICE car in this test. If he plugged it in overnight and only ran the engine while moving it would be much more economical.
45 MPG or 5.2 L/100 km. From a car that can accelerate faster than a plane taking off…
🙁 summer is gone again … and getting cold wetness again, but I guess I haves to get used if I wants to live in Iceland
http://www.worlddreambank.org/S/SHIVERIA.HTM
Another fun imagination playing with Earths tilt, in these scenario Iceland and Scandinavia will be very pleasant places to live in, sunny and semi dry and warm but not too hot. But rest of the world gets really messed up
Africa looking rather similar to as it is today but Nyiragongo woud tower over a Savannah rather than a Rainforest .. well the Mount Carmeroon area is pretty unchanged from its real apparence, just perhaps being 5 degrees cooler than today
But I woud prefer Seapole.. warmer and wetter overall globaly .. this scenario makes much of the planet dry and arid and hard to live in reality. None of the tilt experiments are really possible at all due to Earths gigantic moon thats keeps earth from turning over
Cold days like these feel like no climate change has happened, but the same weather pattern would have been much colder 50-70 years ago with summer snow in Scandinavia’s highlands and the Alpes.
Just noticed the BLAL station stopped recording end of May … did anyone keep track of how many got lost? It must be at
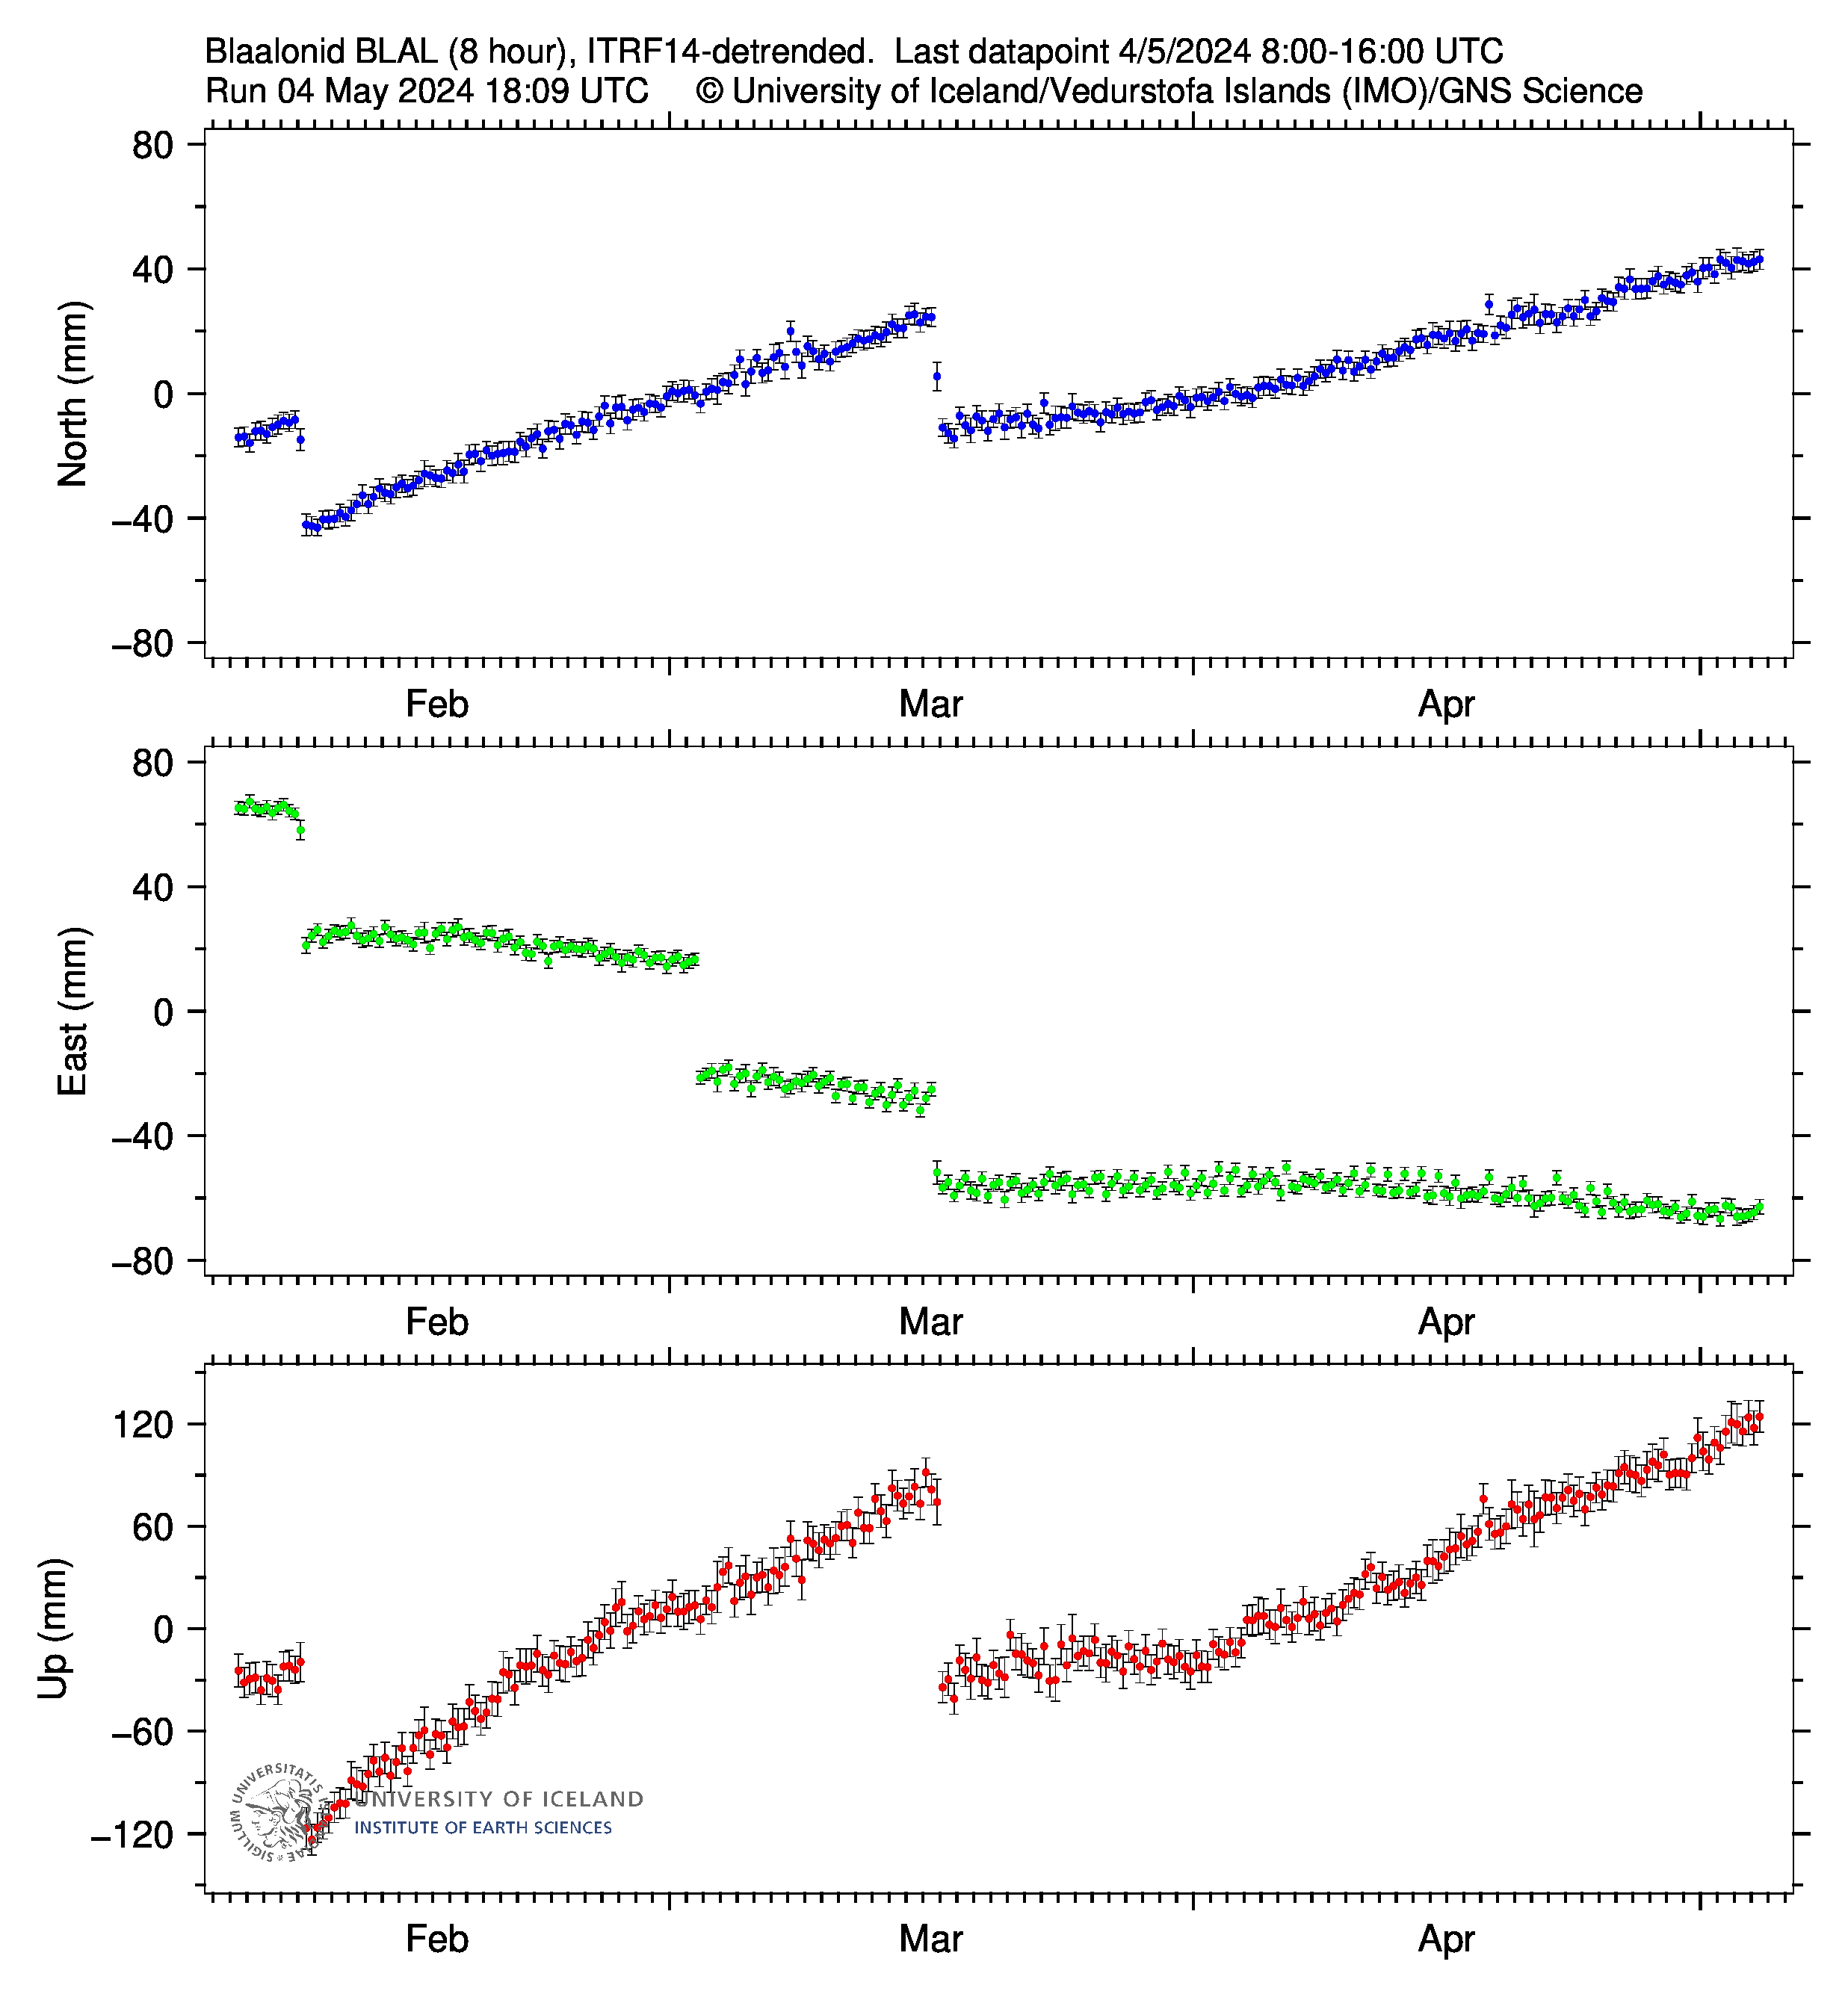
The BLAL station stopped recording end of May. I count at least three losses, the other two being close to Sundhnuk (December?) and one north of Grindavik (January?).

Sundnhuk was caught in the first eruption and the Grindavik station was caught in the eruption inside the barrier. The drumplot at Melholl was also destroyed, in January I think.
When I was looking at inflation in December, I worked out the BLAL station was by the road, so I’m not surprised it has stopped working.
Appears to be a swarm inbetween Thorardyna and Oraefajokull. There does look like some sort of edifice/mountain there actually but nothing is listed. I’ve noticed quakes there a few times.
Increase in quakes across Reykjanes says to me that the pressure at Svartsengi is a lot more relaxed at present.
A good 6 weeks away, minimum.
E/SE Herdubreid quakes still persistent (and now all shallow).
In a time, long, looong before FPV drones, somewhere in an active crater 1,000 m deep there were people descending into it. The footage remains impressive to this day!
Wait, 1,000 feet. 😉
Nyiragongo must be what most people thinks most volcanoes to be like toxic gas pockets, fluid hot fast lava, a lava lake, and a beautiful steep conical profile rising out of the jungle. Its fiery glow casts an eery shine over the night jungle far far away in a ”, poorly known” mysterious land. It is as stereotypical as a volcano can be on Earth. It is just like every child imagines what an active volcano would look like. This volcano is infamous for its fast-flowing lava and its unusual composition and is claimed to have the lowest viscosity of all silica-based lavas. I myself have always been impressed by Nyiragongo’s perfect look, and perhaps only Shishaldin, Pavlof and Villaricca are even more perfect and stereotypical as steep mafic composition volcanic cones. Most people imagine volcanoes to look like Nyiragongo and the other examples, but that is clearly not the case with most volcanoes. Kilauea is also very sterotypical too.. an effusive giant tropical island volcano .. But Nyiragongo is a steep cone and in a ”real” broadleaf rainforest area in the poorly known depths of Africa
I seem night photos of both Nyiragongo and Nyiramuragira shot from far distance with their steam plumes being lit by the lava lakes glowing red spectacular so for miles, specialy so when the brigthly lit steam plumes goes up in a middle high stratocumulus layer that sometimes sit over Virunga then the cloud celing gets illuminated by lava turning the nightskies sickly red over entire virunga chain, from Rwanda its a fiery pillar going up into a red ” cloud roof ” all the clouds near the equator gets illuminated by the lava. Souch unsettling sigths have formed the demonic local legends about that volcano. .. ” According to local mythology, the souls of sinners burn in the fire of Nyiragongo, while the souls of “honest people” can enjoy eternal life on the often snow-covered summit of Karisimbi”
https://browser.dataspace.copernicus.eu/?zoom=12&lat=-1.51113&lng=29.21024&themeId=DEFAULT-THEME&visualizationUrl=https%3A%2F%2Fsh.dataspace.copernicus.eu%2Fogc%2Fwms%2Fa91f72b5-f393-4320-bc0f-990129bd9e63&datasetId=S2_L2A_CDAS&fromTime=2023-12-07T00%3A00%3A00.000Z&toTime=2024-06-07T23%3A59%3A59.999Z&layerId=1_TRUE_COLOR&demSource3D=%22MAPZEN%22&cloudCoverage=30&dateMode=MOSAIC
https://browser.dataspace.copernicus.eu/?zoom=15&lat=-1.52332&lng=29.24921&themeId=DEFAULT-THEME&visualizationUrl=https%3A%2F%2Fsh.dataspace.copernicus.eu%2Fogc%2Fwms%2Fa91f72b5-f393-4320-bc0f-990129bd9e63&datasetId=S2_L2A_CDAS&fromTime=2023-12-07T00%3A00%3A00.000Z&toTime=2024-06-07T23%3A59%3A59.999Z&layerId=6-SWIR&demSource3D=%22MAPZEN%22&cloudCoverage=30&dateMode=MOSAIC
Lots lots of gas pollution and thermal radiation from Nyiragongo now and been like this for months so its possible that a new open conduit lava lake have formed rather than just spatter cones filling the caldera. It woud be good to get ground photos from the caldera to see whats going on inside
https://www.windy.com/sv/-SO2-tcso2?tcso2,-4.127,29.004,5
Sulfur plume is strong now too from Virunga and been so since 2022 a few weeks ago there where are INSANE sulfur spike here that covered most of central africa so perhaps was a powerful caldera eruption or opening of an open conduit lava lake, opening of the 2003 lava lake had a sulfur emission of 70 000 – 100 000 tons a day for quite some time, it dropped to 6000 – 10 000 tons a day by 2020 .. its quite gassy now but hard to say if its an open lava lake vent or not
The edge of the previous lava lake at Nyiragongo
https://m.youtube.com/watch?v=9Qw0G3TcEvg
Foidolitic lava lakes also looks so very diffirent compared to thoelitic basalt lakes, more plates and more bubbles, I think its because its more gas in this lava and degassing mecanism is diffirence from basaltic lava lakes of oceanic composition. But I do not think at all that its more fluid than the Halema’uma’u overlook lava lake at Kilauea that was clearly extraodinary fluid and hot too and left less than a centimeter thick spatter deposits on its walls.. the viscosity is the same but degassing very diffirent… Nyiragongos lava is also less polymerisation in its crust so perhaps more likey to break into smaller plates … Halema’uma’us glassy plates. Halema’uma’u overlook can also looked like this .. but only when its lava lake surface where disturbed by a rim rockfall into it
Its probably mostly rock geochemistry. The lava is very fluid but apparently it isnt especially hot, and not nearly so hot as the hottest plume magmas. 1180 K, or only around 800 C. I doubt it is really that low, but a temperature much over 1000 C seems inconsistent with the thermal imaging. The lava visually is not as brightly glowing too.
Kilaueas lava lake, back in 2009-11 before it rose up, apparently had a nearlly unbelievable sustained temperature of close to 1300 C. It dropped below that due to cooling after 2011, but still…
https://www.ncbi.nlm.nih.gov/core/lw/2.0/html/tileshop_pmc/tileshop_pmc_inline.html?title=Click on image to zoom&p=PMC3&id=9159575_sciadv.abm4310-f3.jpg
Its pretty clear to see when the 2018 magma chamber began to coaless from the indistinct intrusive complex there before. It was around the start of 2011. So only 7 years to go caldera.
Thats right its certainly not as hot as Kilauea or Iceland or most other plume basaltic lavas, its ceratinly much duller in direct daylight, some daylight Nyiragongo photos shows only a dark red glow so yes thats correct, but lava cools also very quickly on surface, even the spatter haves a cooler surface than the interior due to low conductivity, really hot basalt in Iceland and Hawaii ( 1200 c ) have near white hot flow interiors, noticable from the near white hot glowing holes when I poked The Kahauale’a 2 flows thin pahoehoe crust. I seen some closeup daylight photos of Nyiragongo degassing vents that may suggest over 1000 c … but yes its certainly not as hot as halemaumau or fagradals. Its very low Sio2 helps to keep it mobile
Yes Kilauea is an insane beast abomination of a volcano and my fav volcano too… a volcano that can form… whole magma chamber architectures in just a few years or … even months with 200 million cubic meters pumped in… for many sleepy “normal” volcanoes it takes 100 s or 1000 s of years to do so.
It would at least make sense Nyiragongo might not erupt as hot as Kilauea. The heat output of the two lakes is similar, but Kilauea also erupts a lot more in general, as you know. Nyiragongo at least in the past 100 years hasnt erupted much lava but its size suggests that is not a rule. But it is still not particularly impressive volumetrically, Nyamuragira has been very productive by comparison and is a lot bigger if not as tall or holding giant lava lakes as often.
Nyamuragira and Nyiragongo dont connect at shallow depth but they probably do have a common source region, maybe weird heterogeneous mantle being superheated by rifting and possibly a plume. Mabe Kilauea would be a better comparison to both of them considered as one, a assive lava lake and a productive effusive volcano. Although, maybe to be fair, in that case Kilauea and Mauna Loa should be cosidered together too, and then there really just isnt a comparison at all…
Vurunga probably is going to become a major field, maybe not as strong as the Afar/Yemen province in the Oligocene but could ve similar to the Columbia River LIP, if magma can find a way to accumulate.
Probably the depth of the crust that is cooling it down. Which will likely change over time as it rifts more.
Santa Barbara on Terceira is having a swarm, 2 above 3.0.
One wishes there was more public information.
https://www.ivar.azores.gov.pt/civisa/Paginas/homeCIVISA.aspx
I remember when the neighboring island, Sao Jorge (St George) was wracked by earthquake swarms and some evacuation occurred. It appeared that a volcanic eruption might ensue, but nothing resulted. Hardly any news was posted on the internet about the decease of the swarming.
21:28 A catastrophic failure of the perched pond south of the active cone, directly toward the mbl Husafell cam.
The lava field with degassing lava reminds to the “Valley of ten thousand smokes”:
https://www.youtube.com/watch?v=FZmN2daZW9g shows the live streams, but I don’t find Husafell listed anywhere. Is it perhaps this very camera?
This is the Husafell cam for future reference but cannot see anything today because of dreadful weather again.
Im always super odd … Im still dreaming that Albert have gotten, buyed 4 dogs .. one pitbull – miniatyre pinscher mix, one pitbull – dobber man mix, one pitbull – daschound mix and final being a pitbull – english bulldog – mixed with america bully and rotweilier. When Albert goes into the kitchen in the morning, the canines sleep in huge droves on the floor … everyone haves to be feed that dry ultraprocessed dog food … and in outside walks the flock pulls superhard on the dog leash… with Albert walking in a leaning back position.. its a barky noisy hobby and the dogs constantly needs be taken away from trash and shoes to stop them from eating them… still they frequently needs to be stomach pumped for eating non food items
Im teasing Albert 🤣 so much
I wonder if the speed of the lava back on May 29 was ever formally stated. Because this is some scary fast lava.
https://youtu.be/5Nr5O9MRMsw?si=ZqvzGpnqrGiIqE1v
next eruption I think will do an ocean entry for sure. Even the eruption back in March and February, as fast as they flowed, the lava still looked a bit rough and turned to a’a away from the vents. This lava at that location was 1.5 km from the vents and still looks completely fluid, and even the distal end of the flow near the ocean was a slabby pahoehoe over 6 km from the current cone. It looks just like the 2021 lava, or the lava at Kilauea, crystal free and extremely hot. The long March eruption must have let the sills flush out and refill with fresh magma. We should expect all the eruptions here now to be like this I think.
Yes, sooner or later an Ocean entry will happen. The map layers with older lava flows show clearly that the whole coast of Grindavik sits on previous lava flows. Lava barriers can delay this, but the force of the volcano is likely stronger.
A difference to other volcanoes is, that here is a flat landscape. Lava has difficulties to run fast and long. The path towards the ocean is long. Lava will probably reach the ocean as slow A’a lava. A risk in the area west of Grindavik are possible wet swamps, where there can happen explosions like Krafla in 18th century (pseudocraters), if lava runs over the swamp.
The lava in the video stopped a couple hundred meters from the ocean, still as a thin fluid flow. If it flowed around the other side of Grindavik the lava would have reached the ocean probably twice over.
Any idea when the last mainland lava ocean entry on Iceland was? My current guess is the Laki eruptions.
Was during the last Reykjanes Fires, Laki didnt reach the ocean.
Indeed, the last Reykjanes Fires had many Ocean entries.
Bardarbunga once did an ocean entry prehistorically in the Selfoss (south coast) area and nearly one in the north (close to Laugar).
Really the only two places that ocean entries are likely in Iceland based on geological evidence is along Reykjanes and at Snaefellsjokull. Thats literally it. Eldgja and Thjorsahraun reached the ocean, and the long lived Theisareyakirhraun (?) eruption in north Iceland probably had a large ocean entry range too. But apart from that eruptions from all of the central Iceland monster volcanoes stay on land.
Thank you, Chad and Volcanophil!
So, it’s been almost a millennia since a mainland Iceland had a lava entry. I’ve been wondering about that since Fagra-1.
Surtsey?
The Blue Lagoon is open again …
A very clear indicator that a major eruption is imminent!
I think they opened on June 3rd already. And why not.
Don’t be envious!
See the digger is primed and ready should lava get close 😀
I’m jealous!
Quick maybe volcano related question for the geologists here,
What kind of rock has this youtuber found?
https://youtu.be/MLUZIN6ybjI?si=vQ_LM-oa8VkCYnOb
Leaveerite.
Off topic, also read comments if you haven’t tried this.
https://www.bbc.co.uk/news/articles/cy00gk0kr82o
I suppose heat is vaguely on topic?
The median lethal dose (LD50) for capsaicin is 3g for a 70-kg (ex-)human
The median lethal dose (LD50) for lava would be 1 kg, assuming that raising body temperature by 4C would suffice.
Those ramen noodles are supposed to be 13200 scoville. What a joke! My favorite pickled nagas are somewhere between 850000 to 1500000 SHU. Yes, 13200 SHU will be a bit spicy, especially if you’re not used to the heat and you eat an entire bowl, but come on! It’s probably more an issue of stopping the tiktok challenge than it is because of a health issue. I had higher thoughts of the Danes, especially after watching Chili Klaus.
One of those things that the body acclimatizes to. I’m like you, if it ain’t 10000 scoville it barely has a kick these days. Hot English mustard has no effect at all and wasabi is barely there.
The arsenic eaters of Styria were similar, they acclimatized themselves to arsenic trioxide as it had powerful and valuable health effects. Some users could eat 2 g of arsenic trioxide a day. Even now you can still get arsenic medicines for horses to improve their health and the glossiness of their coat.
Strangely enough, mustard, horseradish and wasabi get my sinuses and eyes streaming – yet chilis have no adverse effect (I grow Armageddon, Trini Scorpion and various others each year).
My wife, on the other hand, is an enigma. She can and will eat a Madras curry – yet woe betide me if I slip a single chopped Birds Eye into her Spaghetti Bolognese.
Not that strange really. Mustard, horseradish and wasabi get their punch from another chemical, allyl isothiocyanate, which triggers different receptors than the capsaicin you find in chilies.
My wife once prepared some fried rice and by accident chopped an entire Carolina Reaper into the pan. It was unusually small and she thought it was a milder sort that had gone wrinkly from dehydration. Best fried rice I ever had, but she was not happy. Not happy at all. I almost thought she was gonna kill me for placing a Reaper next to the milder ones.
Souch refined ultraprocessed foods are a disaster for your arteries health its extremely inflammatory, refined foods damages your arteries walls by inflammation and glyciation and oxidation that cause ”rust” and ”scab” in your arteries as your bodys hormones and colesteorls trys to patch the inflammation and your arteries gets narrower and narrower.. this is the cause of heart disease ( that most doctors simply dont know ) it haves nothing to do with unprocessed saturated fats or colesteorls itself thats healthy foods in natural tribes
Althrough ”processed” fats just like processed sugars are not good either.. for you but unprocessed fats are healthy fine foods ..
Our arteries are not like a bathroom pipe.. yet the bathroom pipe is sadely the mainstream theory since 70 years now. By blaming natural fats and other natural calorie dense foods for heart disease, stuff that we eaten for millions of years, the sugar lobby and processed foods lobbyists coperations can make big money on their ”junk food western pyramid” and US and UK is specialy badely hit by their intrests and flawed science
I forever gave up inflammatory western ” capitalist junk dog foods” 5 years ago, now eating only ancestral pleistocene foods, local scandinavian wild meat, homegrown stuff, self caught fish, naturaly occuring saturated fats and natural unprocessed crabohydrates like my homegrown tuber stuff.. and the results are amazing on my health. We here in west world needs to re – learn in school how food actually works, and the diffrence between healthy unprocessed and unhealthy processed foods …
Loves my nuts, moose meat, fish, homegrown stuff and homegrown raw carrots.. but my garden soils needs to improvement for other crop projects
But not all sweet stuff is dangerous depends on the glycemic index, homemade icecream and chocolate are relativly safe snacks as well is the low sugar varieteties
The Sundhnukur Volcano has begun to erupt less magma than the deep reservoir receives. https://en.vedur.is/about-imo/news/volcanic-unrest-grindavik
How high is the current eruption rate compared to the March-April eruption? The recent overflow of the Grindavik Road indicates to me that the eruption rate is higher. A high eruption rate means, that the magmatic systems need an even stronger inflow to exceed this. Does this mean that the magma inflow has increased since the March-April eruption episode? Until now each eruption was larger than the previous one. I had expected that this tendency would once lead to a plateau or peak of eruption size. Maybe we haven’t reached the plateau/peak of the eruption series yet.
The graph of March-April episode shows that then after 14 days of ~zero inflation, on 1st April inflation increased significantly and continued all in all linear until end of May. Today we’re again 14 days after the onset of our May-June episode. Deflation has turned into inflation. It looks as if the 14 days time frame has become a pattern for the two most recent episodes.
With H5N1 is spreading within mice and domestic cats, I was wondering if it would be possible for Fleas and ticks to spread the virus to humans in the future?
Cool it with the H5N1 talk. We don’t wanna hear about it.
I’ve only brought it up twice in the last 2 months
That’s how it spreads! :p
In cows it seems to spread from cow to cow through the milking process. It doesn’t infect the respiratory tract in cows, since they lack the receptors for the virus. Instead, the virus infects the mammary glands, where it causes inflamed udders. The milk from infected cows contains very high concentrations of the virus. Pasteurization deactivates the virus, but dairy workers who commonly gets sprayed with fresh milk in the milking process are exposed to huge amounts of the virus.
Farmed animals are a main cause of infectious viral diseases. There are so many of them! And they are kept in close proximity to each other and to people. You can get a large virus reservoir and plenty of opportunity for mutations to occur. So this is problematic news. No danger at this time but it needs to be kept under control. Spanish flu first jumped to people on a Kansas farm – I just mention it.
Its quite interesting. Of course many viruses and bacteria infect animal and man (who is also an animal). Most have some specialisation to a genotype which makes them less infectious to other genotypes but mutation and transmission across genotypes still happens. Of course its been happening for hundreds of millions of years. Strangely you might think farmworkers who work with animals are often sick, but they are not. In 35 years of running a dairy herd the two workers had two days off sick in total. I also knew a sewage worker (at the dirty end) who retired after 50 years and never had a single day off sick. Bearing in mind very many bacteria are as happy to live in/on humans as animals (ECO157 and a multitude of others) all of us (working with animals) will have been exposed to rather substantial doses of pathogens. The main result of this seems to be an almost complete absence of the usual allergies (incl our kids). Avian flu has been devastating in the UK. Pigeon populations are now very low and red kites here, once readily visibly in tens at a time, are now usually seen singly. I cannot think of a single species that hasn’t declined in the last few years. Avian flu is a bit of a killer. The human population is just primed for devastation and we know how a devastating virus works, long incubation period, long no-symptom infective period, high mortality. C19 had everything except the latter. Luckily high mortality doesn’t usually go hand in hand with the other two. One day it might.
You need two mutations and bad luck. One mutation is the ability to infect another species (humans), one is to be able to transmit between individuals of that species, and the bad luck is in the illness it may cause. I can quite believe that the level of immunity in farm workers can be high! Good hygiene practice probably helped as well? There are some animal bacterial diseases which in recent years have become more important (Q fever, lyme disease) but on the viral side it is mainly flu and sars. Avian flu has been devastating for bird population. It seems now established in mammal population but without the severe illness. I think it will establish itself in humans, but whether it will become a flu epidemic is open. If it does, the Darwin award will go to those people who don’t believe in vaccines.
Strong sulfur plume in Windy program over Galapagos maybe is an eruption again from one of the central volcanoes https://www.windy.com/sv/-SO2-tcso2?tcso2,-1.044,-88.286,6
There is an still ongoing pahoehoe eruption from Fernandina
https://www.youtube.com/watch?v=m2gTLQfVe1U&t=5s
TAAL VOLCANO LATEST DRONE FOOTAGE AFTER PHREATIC ERUPTION EVENT JUN.8,2024
Sundhnukur’s lava fountains have decreased in height, but quiet effusion of lava continues. There is a lava pond at the foot of the cone, from where a lava flow runs out. The lava pond looks as if it has some convection within, similar to classical rooted lava lakes on Kilauea 2008-2018, in Niragongas or Erta Ale:
The level in the perched pond is going up and down periodically today. It seems likely there is some cyclic variations in the supply, similar to Fagradalsfjall 2021, but on a smaller scale.
Im more curious where the south lake actually drains to, theres no obvious lava tube leading from it or breakouts even. Maybe it is fed from the cone but the connection is now flooded, so the lake is in equilibrium to the lava in the cone and it circulates from it and returns. Both drain out the other side now pretty easily.
Im also curious where the lava flowing out the other way goes too, if it is building up a large perched lake again that might drain over the lava walls at Svartsengi. Or if it is feeding pahoehoe flows instead, slowly expanding outwards.
Its going to be very interesting when the next fissure opens, the topography is so different now. The cone has now changed the drainage enough that basically any fissures opening south of it along the rift will erupt lava towards Grindavik, where before it could pond in the little valley next to Hagafell.
Here is where the lava is going to the south. https://www.youtube.com/live/Sly6PztkiJA?si=QJLzmpzf7tJtaHk3
I think that is the lava going north. In the distance you can see the ocean.
You can compare the lava flow maps from
10 June:

and
8 April:
It looks like this eruption emplaced most lava to the North, along Sýlingarfell and to the East, north of the Fiskidalsfjall hills. There was also a significant expansion in the size of the “thin” lava plain in the North.
With the caveat that it’s hard to tell detailed topo from the maps…
The “little valley next to Hagafell” looks like it could still accomodate a little lava.
However, if the low-lying land near Sýlingarfell has been “filled up” then lava might start to flow around Sundhnúkur then head southwards along the defensive berm which is built to the East of the Blue Lagooon. That would result in a lot more lava heading towards Grindavik and a probable ocean entry to the West of the town.
There is another possibility – there doesn’t appear to be anything much stopping the eastward flow of the lava through Borgarhraun and then southwards through Lagar for an ocean entry far to the East of Grindavik. You heard it here first!
Please do not link images with excessive size. Replaced with (much) smaller versions. -minor admin-dragon
I think the thick area next to Sylingarfell is the stiff erupted last week across the road, its not from day 1 mostly. Biggest flow on day 1 seems to be the one that went towards Fiskidalsfjall, although lava flowed that way for a few more days too.
Actually I didnt realise the flow above actually could have created another ocean entry location. The next flow that way could flow down between Fiskidalsfjall and Husafell, or flow behind Husafell to merge with flows going down the east side of the barriers and turning Miðhaeð into a kipuka.
Im also assuming the image from June 8 when showing topography is showing it based on lava covering the March-May lava. In that case the cone is at least 55 meters tall from the pre-eruption terrain. So starting at 80 meters elevation it is now 125 meters. I think this could be a significant underestimate too, the new cone is taller than old Sundhnjukur, which is 134 m elevation. If the new cone is even 70 meters tall in total I wont be shocked.
I think the 2021 cone ended up over 100 meters higher than the spot it started but that might also be the total thickness of lava in Geldingadalur adjacent to it. Either way the new cone is getting pretty big.
The cone like the March-April cone acts as the “central volcano” of the Sundhnukur volcano. There may happen eruptions occasionally elsewhere on the fissure swarm, but the majority of eruptions will probably occur on this location.
The pond likely has access to the magma chamber and mirrors the rythm of the magma chamber. This is typical for rooted lava lakes like f.e. Halema’uma’u 2008-2018, Pu’u O’o and the African lava lakes.
from the Icelandic met office :”Considerable pollution from the eruption is now measured in many parts of the capital area and in the western part of South Iceland. According to data from the Environment Agency of Iceland, the highest levels of SO2 in the capital area have exceeded 500 μg/m3 and the pollution is expected to persist throughout the day. People with sensitive respiratory system may experience discomfort. It is preferable to limit physical activity outdoors and ! avoid letting infants sleep outdoors ! during such high concentrations of gas in the air.”
it is 11C in Reykjavik. They have tough childern!
Letting babies nap outside is common practice in the nordic countries and it’s even done in the winter. Most parents draw the line at -10C or -15C. Usually the baby is placed in a stroller with warm clothes and in a warm sleeping bag.
We used to do it in the UK (not so sure on the sub zero temperatures) to treat jaundice.
You won’t have seen the fully wrapped-up babies sleeping outside in Scandinavia. Sunlight does not get a look in.
Indeed. My grandkids got parked outside too.
Clothing weather dependent.
11°C is what it is right now where I am too, its not cold at all really if theres no wind.
But then, this is coming from someone who nearly got heatstroke in a factory kept at 3° C standard because I had to wear 2 layers… so maybe im not the best judge on cold things 🙂
I got sunburned in January about 40 years ago. It was an exceptionally cold, clear day and I was in a rowing boat, fishing near Brownsea Island in Poole Harbour. There wasn’t a breath of wind and the sea was like glass, so I copped both direct and reflected UV.
SO2 levels have spiked in the UK, believed to have been caused by the eruption in Iceland.
https://www.bbc.co.uk/news/articles/cv2201zn2deo
To be honest, low levels of SO2 shouldn’t be that harmful. The body ought to handle suphites and sulphates at modest level and blood is quite well buffered. Air is of course a little acidic due CO2.
Kilauea is now fully recovered from the last SWRZ eruption, with significant uplift being measured from both UWEV and SDH tiltmeters. UWEV has gone up nearly 20 microradians since the eruption and 5 beyond the actual break even point. SDH has gone up nearly 60 microradians, after dropping only 30 during the eruption.
No quake swarms, but I wouldnt be surprised if that starts up again soon. Its a curious thing why Kilauea has had so many intrusions and short eruptions since the start of 2023, all of which have recovered very fast and each was in fact faster than its predecessor. But none of the eruptions resumed with the recovery. It does make you wonder why.
The large change in tilt (in effect the steepness of the side of the bulge) suggests the magma in the summit is becoming more shallow. I doubt that this shallow sill is directly feeding the rift intrusions. Those may come from deeper. In that case the tilt can recover before the erupted volume has been fully replaced.
Not sure of such a shallow sill existing anywhere. The SDH source existed before the eruption and seems to be more vertical, like a wide dike though probably a bit different. Its the start of the SWRZ connector. UWEV just reflects inflation of the magma chamber under Halemaumau, the one that collapsed in 2018. There might be a sill inflating under the Koa’e fault zone between both of the rift connectors, but the last INSAR was thrown out of scale by the intrusion so shows nothing useful in this regard.
It is a matter of expectation. Magma accumulation tends to follow the slope of the land because that is the direction of least stress. When magma moves upward, there is a push back from above and from the sides. When it moves sideways, there is no sideways push back on the push form above is evenly spread out. That is why sills form and why one might expect sills to be present inside the caldera as well. Actually, it also needs a weakness in the rock which can be a conduit, a fault or ring fault, a rift (all of which allow for upward movement) or different layers of rock lying on top of each other (e.g., old lava piles) which allow easy sideways motion between the layers. Since we do not see signs of an impending eruption but the tilts do suggest shallow activity, one or more sills seem most likely.
The new dike was relatively shallow but the part just uphill of the eruption site, where it started and was seismic, went from basically at the surface to around the 2-4 km depth range, so a shallow sill would have been intersected if it was present near to SDH.
I think the map of the magma plumbing made by HVO is way too simple, the connectors are possibly defined open tubes but there are also many overlapping and connected sills and dikes, and at least since about 2011 a homogeneous liwuid magma chamber under Halemaumau that partly drained in 2018. I
ts very unlikely that magma would be inflating the ground this much while not flowing to the source of the recent intrusion too. Maybe at most volcanoes the magma is viscous enough and the supply low enough to have disequlibrium in the system but Kilauea isnt a good fit for that at least not in a significant way. Not when it has probably the hottest and most fluid magma chamber of any volcano, probably a similar viscosity to mineral oil or liquid soap.
Seems the IKI tiltmeter is the same way.
The most extraordinary event since 2023 was the intrusion in January/February 2024. It was more voluminous than any eruption before and after. It changed the position of many GPS stations more than any other event. Look f.e. on the strong East and North displacement of HLNA GPS station in January/February:
And 4 months later the intrusion has been recovered in volume twice over and counting 🙂
I think maybe we might get a similar event next. The last eruption was an attempt but didbt have the volume despite the intrusion being just as long. My guess though is this time will be an eruption maybe similar to 1974 but probably more voluminous likely comparable to recent Halemaumau eruptions (10-20 million m3). Probably a long fast flow and if it is big enough I wouldnt rule out an ocean entry as a possibility.
Option 2 might be it finally breaking into the ERZ again but that might take a while longer, maybe no eruption until next year while still inflating at a high rate. So too early to say on that yet.
The intruded magma of January/February is still stored there. It can play a role in future, if earthquakes change something or new intrusions enter this magma body.
Some of the early 19th century eruptions put out aged magma. It’s possible that future eruptions will do the same with the now stored magma there.
Inflation at Askja is resurgent, particularly on the west side of Oskjavutn, after it slowed down/deflated end of April.
New post is up! Waiting on the witch
https://www.volcanocafe.org/the-katla-eruption-of-1918/