Introduction (Albert)
Iwo Jima is famous. The battle between the US and Japanese forces are well remembered – by both sides. Before the war, about 1000 people lived here. After the war, none. There is a military base only. The beaches are filled with rusting hulks of ships, sunk in the long battle.

And that is funny, because those ships weren’t sunk on the beach. They were in water. And that is the second reason why Iwo Jima is famous. The land here is rising, and has been doing so for at least 700 years. Since the time if Captain Cook (who visited posthumously – he had already did when the expedition came past here), the island has risen by 40 meters. It has grown in size as well: reefs that were mapped by Cook’s expedition are now part of the island, including one dubbed ‘Stonehenge’. VC designated it as the most dangerous one in the new decadal volcano list. It was a choice which surprised people, as the volcanic nature of the island was not well known. It made the news. This was before Hunga Tonga showed that a VEI-6 sea level eruption could cause a tsunami across the Pacific. VC got there first.
The growth of the island is readily seen from images. After the war, the island was a waste land, but images show where the coast were. Here is an aerial view from 1945

Here is a satellite view from 2018. The island has greened, but has also acquired extended sandy beaches. The sides are staircase like, showing the effect of wave erosion during the uplift. The small island to the north, part of the caldera rim and outside the frame of the 1945 view, is now almost attached to the main island.

Iwo Jima. August 2018
There has been strong uplift since 2020, although the island hasn’t grown much further in that time, judging from images. The phreatic explosions that were occurring have becoming magmatic. A new island formed off-shore recently. It has eroded away already.
So what is going on? Is this normal caldera activity, ups and downs as seen in Campi Flegri (to which Iwo Jima is sometimes compared)? Or is magma accumulating? Will the current burst of activity temper down again, or will it continue to grow? Could another caldera eruption occur, and what would the warning signs be?
Tallis and Hector have combined to tell us their views. Enjoy! Before reading their words below, you may want to read the earlier posts on Iwo Jima: Henrik’s now famous eruption story, top of the VC new decadal list is a must-read. Later we had a post on the pre-VC history of the island.
The New Decade Volcano Program No. 1 – Ioto, Japan
Do remember that the island is now called Ioto. Iwo Jima is history. But what about the future? Keep reading.

September 2025 eruption. The ghost ships are visible to the left of the plumes.
Tallis Rockwell’s view (Crisis on Ioto):
Considered to be the most dangerous volcano in the world on this blog, Ioto is quite a temperamental volcano, rising at an average rate of 15-25 cm/yr for more than 500 years. I’ve got no interest in delivering a refresher at this moment, if you want a general understanding of known information on this system please read Albert’s articles on this system. Simply put this volcano lies on the Izu-Ogasawara arc. It has chamber of unknown depth, likely deeper than 2 km but shallower than 10 km. A shallow 4-5 km wide sill at 0.8-2 km depth and through that sill there is a cone-sheet intrusion as the magma flows around the Motoyama block. The volume of these structures are currently unknown. It should be known that despite the chamber supplying the sill and cone-sheet intrusion, it is still a significant supplier of deformation at the
volcano.
During the past decade and a half, Iwo-jima has seen over 10 meters of uplift, numerous phreatic eruptions and since 2022, it’s first magmatic eruptions in over 500 years. Up until recently uplift had seemingly slowed and the frequency of eruptions slowed. It wasn’t until the ending of August that things escalated dramatically. The most dramatic deformation pulse at this volcano so far is taking place, with critical fractures having taken place along the Asodai Fault and purported ring-fault. These cracks are hot, constantly emitting steam. All eyes should be locked on Iwo-Jima right now as it is likely we’ve reached a tipping point. In order to understand this proposition we need to understand some basics about how this unrest has progressed.


The average rate of uplift has been undergoing a centuries-long acceleration phase. The coast had risen 40 m since 1779 but over 17 of those meters took place in less than 70 years after 1945. Clear evidence of acceleration. This acceleration trend had recent expanded an entire of order of magnitude, rising well over 12 meters in 12 years. The past period of unrest culminated in the a series of magmatic eruptions off the coast of Okinahama starting in August 2022
continuing on into February 2025. The magma from these eruptions came from shallow depths likely not exceeding 1.2 km. The first eruption in 2022 consisted of degassed magma but the 2023 eruption’s material was more volatile, probably due to some maturing of the vent. These eruptions weren’t particularly intense or voluminous. With all of total volume of all the eruptions from 2022 to early 2025 not exceeding 1 million m3 but it did indicate one thing, the Cone-sheet
intrusion had finally expanded enough for a magmatic eruption after more than 500 years.
The current deformation pulse is likely related to the sill and cone-sheet intrusion and is exceedingly high, around 3-4 cm/day. Motoyama is experiencing a deflation, likely sourced from the sill surrounded by a large ring of uplift. Like the last deformation cycle, The cone-sheet intrusion seems to be the dominant producer of the uplift. And while we don’t know it’s volume as of late, we can guess with the given details. Just looking at these insar maps, we find that the uplift from the cone-sheet intrusion covers most of the island, around 2/3s of it with some more uplift taking place underwater, as such it would be reasonable to assume that the cone sheet takes up an area of over 25 km2. It’s height is probably around 0.8-1.6 km depending on the angle of magma ascent. This leaves us with a volume of 20-40 km3 of magma. Not accounting for magma in the sill.
The last uplift cycle(2012-2023) caused the cone-sheet intrusion to pressurize by 10 MPA, not good considering the magma is stored at a depth 25+22 MPA. It’s safe to assume that the Cone-sheet intrusion is now overpressurized. Iota has likely been cycling through different deformation cycles. This is likely reflected in the clear long-term acceleration
phase. The broader early cycles were likely the result of the chamber becoming receiving the bulk amount of magma, leading to it’s overpressurization, it produced a sill as result, leading to a spike in uplift speed and decrease in scope, the sill then broke and produced a cone-sheet intrusion that would be the cause of the current observed uplift.
We’ve got an overpressurized chamber producing an overpressurized sill that has now produced an overpressurized cone-sheet intrusion. The craziest fact still is that there is no ; large-scale subsidence of the magma chamber has been noted in decades of topographical surveys, on the contrary. We’ve found that the chamber is still uplifting! During the last deformation cycle, the NE rim of the caldera rose! That fact means that all the magma that has left the chamber was replenished and then some!
If the current deformation pulse is related to the magma chamber then I believe that we’re seeing past “failed” uplift.These insane speeds make magma supply an unlikely cause if it related to the chamber. Despite delivering some of it’s supply to the sill and cone-sheet intrusion, the chamber has still been building pressure and strain at more rapid pace than most volcanoes on the planet. It is almost definitely overpressurized. Hector made a quite timely article concerning vertical-t CLVD quakes and as such I’d point you in that direction. Simply put, sometimes a ring fault has to potential get “stuck” and accumulates strain and energy soon the ring fault slips and rapidly rises producing strong earthquakes. This pulse could be fueled by a similar mechanism, just slower, instead of being released in a rapid slip event, the strain could be released in a slow failure leaving us with prolonged extreme uplift periods. This way, magma supply, although still definitely extreme, won’t reach truly impossible levels. The evidence for this idea could be supported by some of
the GPS data. You will notice that during the past few years despite uplift slowing, its associated horizontal deformations didn’t pause. This could imply that the magma supply rate remained unchanged.

From Nevada Geodetic Laboratory: https://geodesy.unr.edu/NGLStationPages/stations/J605.sta

From Nevada Geodetic Laboratory: https://geodesy.unr.edu/NGLStationPages/stations/J605.sta
The issue with this idea is that not everyone will agree that Ioto has a ring-fault, in his own article, Hector disagreed with the existence of a ring-fault but if you ask others they’ll say yes. The only other options beyond preposterous magma supply or slow-slip ring-fault uplifts would be the plug starting to fail or rupture of the magma chamber. If it is from a failing plug, we’ll see continuous intensifying eruptions rather soon. If it is a sign of an incoming rupture from the magma chamber, we will probably about to see a lot more magma enter the shallow system. As you’d guess, none of these propositions are good for this volcano’s future.
Even forgoing the magma chamber the cone-sheet intrusion has enough magma to produce a high-end VEI 6 or a low-end VEI 7. Remember all the chamber has received at least as much as it lost so the magma chamber is much more capable than whatever the shallow system can do. A low-end VEI 7 being the worst-case scenario for this volcano
could be a solid underestimation.
Current eruption and Caldera Trigger
All of the possible causes for this intense uplift suggest that either this chamber is primed and overpressurized or it will be very shortly. But we need more than an overpressurized system for a caldera-forming eruption, we need an adequate conduit for magma to flow through. That is the only ingredient missing and that may also change soon. The current eruption is much more intense than the past eruption producing pyroclastic surges and lava fountaining, still it’s not
very strong in comparison to other volcanoes. It is a Phreatomagmatic eruption. What we can expect from this eruption depends on where the magma is sourced. If it is from the cone-sheet intrusion then the chance for an imminent escalation is lower but if it is from the magma chamber, then the chances would go up. The conduit for this eruption likely developed from the extreme stress the uplift is putting on the crust regardless of cause. Assuming that the eruption and all future eruptions for the foreseeable future are fed by the sill and associated cone-sheet intrusion then we would ultimately need to wait for violent enough eruptions to compromise the plug. A strong VEI 4-5 or series of intense VEI 3-4s could do this. The shallow system likely has enough magma for this, and while the quality of the magma may not be the best, there is no shortage of water to make for violent reactions so this will always be a solid possibility. This is actually preferential as it would give ample time for study and warning. A process like this could take months or even years. Even if this scenario is true, it is still possible that another conduit directly connected to the chamber will develop, risking a faster-build up. If the magma is sourced from the magma chamber, then we already have direct conduit to the primed system and this could quickly escalate as it expands and matures. It might take months or even weeks leaving less time for warning and study. We don’t know where the magma is sourced so we can’t jump to any conclusions.
Another risk is a major earthquake at the Asodai fault, as I’ve stated before numerous cracks have formed along this feature so it’s also under stress. The failure of this fault could also lead to a significant escalation. Caldera-forming eruptions follow a very predictable trajectory, Phreatic phase<Phreatomagmatic phase(We’re here)< Non-Plinian Magmatic phase (occasionally with effusive properties, but this phase does not always occur)<Plinian phase<Caldera-collapse.
Ioto, Iwo-Jima, Sulphur Island, whatever you want to call it, is undergoing massive changes over a vast area. This volcano has the potential to crush every other known historical eruption in terms of intensity. Not only could it produce an eruption as intense as Krakatoa or HTHH through interactions with sea-water while being an entire order of magnitude larger, it could even be more intense as there could be significant amounts of magma mixing between a slew of mafic, intermediate, and felsic magmas! It was always king, for centuries, this volcano has been building itself up and despite so many finer details being lost to us, it’s still terrifying. A caldera-forming eruption should no longer be treated as a distant hypothetical but as a likely future, possibly sooner than anyone might expect.
Héctor Sacristán’s view (Insular Obliteration 101):
This is my first time talking about Ioto/Iwo-Jima, and I must say this volcano is fascinating, with many unique aspects to its activity that lie beyond what I could have initially imagined. This article happens as Ioto produces its most intense historical eruption recorded. A new vent opened on Sept 1, and has resumed erupting since Sept 14 until today. The ongoing eruption and large-scale deformation associated with it deserve immediate attention.
Since I haven’t tackled the volcano yet, I will start with a brief geological overview and a commentary on the structure of the volcano. The submarine flanks don’t seem to have the large fields of concentric waves (created in repeated caldera-forming eruptions) that other volcanoes like Kita Ioto or Kaitoku to the north have, so Ioto may be relatively new to caldera-style volcanism, or it has an older pyroclastic edifice that is buried under an effusive one. The north flank of the volcano is mostly covered in lava from the effusive stage, which is probably correlative to trachyandesite flows exposed near the west rim of the caldera (Kamaiwa coast area). Only in the north flank valleys, there seems to be clastic material and locally turbidity ripples, probably from PDCs that were channeled down the ravines. The south flank is instead entirely covered in clastic material and turbidity ripples that fill the valleys; likely from the caldera-forming eruption that must have been focused on the southern side of the caldera, between Motoyama and Suribachiyama, possibly.

Bathymetric map of Ioto volcano, showing the underwater caldera, lava flows (north flank), and pyroclastic density currents (south flank). The island itself is in gray (the emerged portion of a resurgent dome). It has the shape of a pizza slice, with the Suribachiyama cone located at the pointy end, and the wider, round end being the peak of the resurgent dome itself, Motoyama. Map from the Japanese Coast Guard.
The caldera of Ioto is circular or chestnut-shaped (if Suribachiyama forms one end of it), of about 10 by 11 km in size. A thick pyroclastic layer forms the island of Ioto, which, although it hasn’t been interpreted as such, I think represents the caldera-forming eruption that ponded inside of it, now brought to the surface by resurgence. This deposit (extensively described in Nagai & Kobayashi, 2015) comprises three layers: the Hinodehama Ignimbrite, the Motoyama lava/Kongoiwa pyroclastic deposit, and the Motoyama pyroclastic deposit. The Hinodehama Ign. is a pyroclastic layer ~7-8 meters thick that is extremely welded and lava-like (has columnar jointing even), and contains abundant carbonized wood within its lower section. The Motoyama lava/Kongoiwa pyroclastic deposit is a layer about 15 meters thick that has been variably interpreted as an intrusion or lava flow, but I think is part of the ignimbrite sequence; it’s made of sheets of lava (or lava-like ignimbrite?) in places and in others breccias with large lava blocks as big as 20 m, bits of this layer are also mixed into the lower part of the Motoyama pyroclastics above which I think supports an explosive origin. Then comes the Motoyama pyroclastics, which is a pumice tuff (unwelded PDC deposit) 60 meters thick, making the bulk of the eruption. The composition of the three layers is very similar and mostly overlapping, and consists of trachyte with 62 wt% SiO2 and 1 wt% MgO. The presence of MgO indicates the lava is not fully evolved (sort of the alkaline equivalent of a dacite caldera).
The 80-meter-thick pyroclastic sequence has been interpreted as a subaqueous caldera-fill postdating the caldera. However, the lower section, the Hinodehama Ignimbrite, has to be subaerial; the abundant carbonized vegetation likely came from a forest on an island that was wiped out by the currents, and a lava-like ignimbrite shouldn’t be capable of forming underwater (and I doubt it can occur in eruptions that aren’t caldera-forming). Given that the pyroclastic sequence must have started above water, but we know the current Ioto island only became subaerial around 800-500 years ago (age of the highest marine terrace), then the deposit must have formed during the collapse, taking out the island that existed before the caldera (which we know existed from parts of the rim that are at sea level) and transitioning to an underwater deposit as water flooded the collapsing crater. So the Hinodehama ignimbrite must have formed subaerially, wiping out the vegetation of the island and settling into a strongly welded layer, then the Motoyama lava/Kongoiwa pyroclastic deposit must be a hybrid, in places emplaced as a subaerial deposit, in others, already underwater, spatter exploding in contact with the water formed breccias, and lastly, the bulk of the eruption happened subaqueously when the vents were drowned and the eruption turned phreatomagmatic, producing a pumice tuff. It’s also remarkably thick; just inside the caldera, the pyroclastic layer has a volume of 4-5 km3, with likely most of the actual volume being distributed over tens of kilometers down the flanks of the volcano, and mostly over the south flank.
Carbonized woods from the bottom of the Hinodehama Ignimbrite have yielded two identical ages of about 750-800 BC, although, given the uncertainty in the age calibration, it could be anywhere from the year 600 to 800 BC. I think this can be solidly placed as the age of the Ioto caldera-forming eruption. It also matches a large volcanic sulphate spike in ice core records (the ice core signal is from around 700-750 BC); this spike is about 2/3 of the size of Tambora’s 1815 eruption as estimated in terms of the global mean sulphate aerosol depth. If this is indeed the case, then it underscores the potential for many mystery volcanic sulphate events to have come from shallow submarine calderas, particularly in the Tonga-Kermadec and Izu-Bonin arcs.

Global annual mean stratospheric aerosol optical depth (SAOD), showing the potential spike from Ioto’s caldera. Adapted from Michael Sigl et al., 2022.
The floor of the caldera is uplifted into a massive resurgent dome. Around 800-500 years ago, the caldera floor was only starting to emerge above the water, when the first paleo-shoreline was formed, and since then it has risen about 100 m (an average of 13-20 cm per year). Assuming a ~500 m deep caldera, the average uplift since the caldera formation 2700 years ago has been 25 cm per year. Under this same assumption, the total volume of the resurgent dome is ~34 cubic kilometers, which would yield a magma supply of 0.013 km3/yr or nearly half a cubic meter per second, since the last collapse, which is a remarkable rate, comparable to about half the long-term growth of Reunion Island, or to the long-term growth of the entire Mariana Arc to the south. Most remarkably, Ioto is not alone in its high supply, among its immediate neighbours; Kita-Ioto is one of the top CLVD earthquake producers in the world (rapid piston-like elevation of the caldera floor), Nishinoshima is one of the few most productive stratovolcanoes of this 21st century, and Fukutoku-Okanoba had a VEI-4 eruption in 2021.
During the past decades, the volcano has continued to produce vigorous activity and a rather unusual one. I don’t know of any volcanoes in the world that behave the way Ioto does in two aspects: the shape of deformation, and the frequent tiny phreatic (recently upgraded to magmatic) eruptions along a ring area near the sides of the caldera. The first is that the continuous uplift of the volcano is stronger towards the edges of the caldera than near the center. For example, J604 GPS which is closest to the center of Motoyama has uplifted 7.5 m since July 2015, while X086 which is closer to the edge of Motoyama (further away from the center of the resurgent dome) has uplifted 10 m for the same period, while outside the caldera there’s almost no uplift with J605 GPS that is probably around the edge having only 1 m of uplift during this period. Not only is uplift larger near the edges, but the GPS stations also get pushed inwards, J604 and X086 move towards the center of Motoyama and towards each other, while, strangely enough, J605 (Suribachiyama) moves away from it and from the other GPS stations. Studies have also found that the lowest uplift at present is near the center of Motoyama and in the very tip of Suribachiyama (jumps suddenly on the NE side of Suribachiyama), while the highest is on a ring around Motoyama.


The complex deformation pattern is very hard to explain. The only answer I’ve reached is that the magma chamber is shaped like a bowl, and the sides of the bowl are inflating faster than the bottom of the bowl. This is the same as the cone sheet idea that some models advocate, but I think possibly spanning the bulk of the shallow storage, and I also prefer to use the term “bowl” since it’s more intuitive and less confusing, given the term cone-sheet is often used for thin petal-like intrusions that occur in swarms in igneous petrology which doesn’t seem the same we have here.
The pattern of deformation wasn’t always like this, since Motoyama is the tallest, so for most of the post-caldera period, the center of Motoyama must have been the center of uplift, but this has changed as the magma chamber has developed into a bowl shape, and the edges of the bowl now concentrate deformation. Or at least that is the way it seems to me. There is also more to the deformation. Lengthening between J605 and J604 must reflect growth near the edges of the bowl, while uplift of J604 likely has a contribution from both, but thus has a greater relative contribution from inflation near the bottom of it (which the J605-J604 distance does not have at all), and when both variables are plotted together, an interesting pattern emerges. Inflation of the edges of the bowl (widening between Suribachiyama and Motoyama) is steadier over time; it increases and decreases with the overall inflation of the volcano, but not as much. It seems that magma flow into the bottom of the chamber fluctuates more, but the edges get a steadier supply.

My proposed structure of Ioto’s plumbing.

Additionally, there are deflationary events from time to time. These events are associated with deflation centered over the central/northern part of Motoyama (unlike inflation, which centers near the edges), have earthquake swarms, and usually include eruptions (phreatic, except for the current one). During deflation events, the deformation does NOT reverse that of inflation periods, because the deflation is actually strongest over the center of the resurgent dome, and the distance between J604 and J605 increases as during inflation. I believe these events are associated with intrusions above the edges of the magma bowl structure that sometimes result in eruptions and extract magma from the center of the bowl chamber. The current eruption is one of these events and has not only resulted in deflation of Motoyama and distancing between Suribachiyama and Motoyama, but also a (partial?) ring of inflation and fractures around Motoyama. Previous deflation events happened on 2 May 2012, 12 Sept 2018, 10 Oct 2019, 24 Nov 2021, and all but the 2019 event resulted in tiny eruption events (presumably phreatic). The magmatic eruption of October 2023 was instead not associated with any earthquake swarms or deformation and was probably just a batch of magma quietly seeping through, which was chemically similar to that of the caldera-forming eruption from 2.7 ka.

Phreatic eruptions that were associated with earthquake swarms and deflation events are shown in yellow. Magmatic eruptions are shown in red.
And it’s these eruptions that make up the second main trait of Ioto. Frequent phreatic eruptions, tens of them have taken place over the last decades all across the island, though concentrated in a ring inside the caldera, around the center of Motoyama. This is very weird. Other shallow silicic magma chambers tend to build pressure and culminate in spectacular eruptions; for example, Cordon Caulle, Chaiten, Rabaul, or Havre will, when opening a vent, produce enormous plinian rhyolite eruptions or vast lava flows. But Ioto erupts tiny. Even when trachyte finally reached the surface in 2023, the ensuing eruption was minuscule, so tiny as to not even make a dent in the inflation trend of the volcano. This minor distributed activity all around the resurgent dome is the other strange characteristic of Ioto.
In my head, to my bewilderment, Ioto is not a volcano building pressure for a massive explosion, nor is it a volcano preparing the ground for a ring fault that suddenly unzips into a ring dike and empties the volcano. It’s a magma chamber growing slowly, but consistently, UP, throwing small intrusions through the sides that build an expanding bowl of magma, until the chamber eventually reaches the surface. My perception is that the volcano is not going to need excessive pressure or a massive intrusion to collapse, but that eventually the very magma chamber is going to come up to the surface, through the edges of the caldera structure, and destroy itself. It’s like a train heading towards a cliff with no brakes. It will caldera-collapse, I just don’t know how much track lies ahead. I find it possible that this eruption could be the final drop that overflows the vase, but also that years or decades are left. Though I doubt it could be much more than that, given the extraordinary pattern of deformation and how the situation has been rapidly evolving these past few years.
To end my take on this volcano, I show a map below with the changes during the current crisis, based on InSAR images and GPS data.

Sketch of the ongoing activity, since late August. A new vent on the west side of the island has covered in pyroclastic material a radius of a few hundred meters. Motoyama has deflated, while a complex, fractured area surrounding Motoyama and the saddle with Suribachiyama has experienced inflation.
By the way, thanks, Jim, for the title suggestion!
Sources:
https://www.jstage.jst.go.jp/article/jgeography1889/94/6/94_6_464/_pdf/-char/en
https://www.jstage.jst.go.jp/article/geosocabst/2024/0/2024_228/_article/-char/ja/
https://www.jstage.jst.go.jp/article/geosocabst/2024/0/2024_229/_article/-char/ja/
Isana Kobune, Youichiro Takada (2024). Uplift of Iwo-jima island during 2007-2023 detected by InSAR and its
physical interpretation: Effect of thermal stress, Japan Geoscience Union Meeting 2024. https://confit.atlas.jp/guide/event-img/jpgu2024/SVC26-13/public/pdf?type=in
Dambly, M. L. T., Samrock, F., Grayver, A., Eysteinsson, H., & Saar, M. O. (2023). Geophysical imaging of the active magmatic intrusion and geothermal reservoir formation beneath the Corbetti prospect, Main Ethiopian Rift. Geophysical Journal International, 236(3), 1764–1781. https://doi.org/10.1093/gji/ggad493
Nagai, M., & Kobayashi, T. (2015). Volcanic History of Ogasawara IOTO (Iwo-jima), Izu-Bonin ARC, Japan. Journal of Geography (Chigaku Zasshi), 124(1), 65–99. https://doi.org/10.5026/jgeography.124.65
Sigl, M., Toohey, M., McConnell, J. R., Cole-Dai, J., & Severi, M. (2022). Volcanic stratospheric sulfur injections and aerosol optical depth during the Holocene (past 11 500 years) from a bipolar ice-core array. Earth System Science Data, 14(7), 3167–3196. https://doi.org/10.5194/essd-14-3167-2022
https://www1.kaiho.mlit.go.jp/kaiikiDB/kaiyo22-2.htm (From the Japan Coast Guard)
https://www.gsi.go.jp/uchusokuchi/20250910ioto-e.html (From the Geospatial Information Authority of Japan (GSI))


No thoughts on the underlying positions, that’s beyond my paygrade, though I think the signals that Iwo Jima’s days are numbered are pretty clear in a macro-sense! I must say Hector’s map makes much more obvious the caldera edge than the other topographic maps I’ve seen, a continuous arc on the north side of the island even if faint in places. The white patch makes it hard to tell, but definitely looks like Suribachi is outside it. Liked the discussion of the pyroclastic layers, done my own rough math before and Iwo Jima has clearly done at least a solid VEI 6 before. Of course there being a 9X9km caldera also sort of signals that. But that rim is pretty short in places, its mostly reinflated.
Also, the island has grown quite a bit since 2020, just mostly on the NW side, though there has been some growth everywhere.
Like ~100 meters is roughly the *tallest* the caldera rim gets at places like Higashi and Kangoku. Its completely buried by sand deposits on the south side.
Hector’s explanation seems like normal enough caldera stuff to me? Albeit signaling that it is actively running the end stages of caldera formation? Basically the magma chamber was bulging the whole thing for a long time. Motoyama is a hard block. Eventually it starts creeping up round the edges. This results in inflation at the edge and shifts the pressure away from the center, so it deflates a bit. The system as a whole of course is still getting fed magma. How that will end of course is that Motoyama eventually falls into the magma chamber…
I’m not sure I’d call it normal. Usually, uplift is stronger in the center of the caldera, and the ground is pushed outwards. Ioto is pretty unique in having the least uplift at its center (hasn’t always been like this) and having the GPS stations move inwards as it inflates.
Most calderas though are just recovering like Iwo Jima was until recently…In other words isn’t this basically what you’d expect from a caldera system shifting from inflation mode to preparing for a ring fault caldera-forming eruption? Magma starts squeezing up around a central block, which in turn will get pushed down and in by that inflation, especially if the ring fault is inward-angling as is optimal for caldera formation. In a certain sense a caldera eruption is just doing the movements Iwo Jima is doing now in a run-away fashion orders of magnitude faster.
In other words normal in the sense that lots of caldera systems probably do that for some period of time before going VEI 6/7, not normal in the sense of non-alarming…
“In other words isn’t this basically what you’d expect from a caldera system shifting from inflation mode to preparing for a ring fault caldera-forming eruption?”
Possibly. It would make sense in my head. But even for Hunga Tonga, we have no idea of how the caldera was deforming before it collapsed, so I guess all we can do is speculate.
Yeah, caldera-forming eruptions are rare enough that Iwo Jima will probably meaningfully improve our understanding. There have only been a handful in modernish times and not the same level of data.
The NW side is affected by sand being moved around from the northeast side by currents and typhoons, so it goes up and down. The most recent image (sept 2025) was taken I think at high tide so hides some of the change.
Yes, most likely the 2.7 ka eruption was a VEI 6, even a 7 wouldn’t be entirely impossible given the caldera size.
Wow..what a great series of articles! Thanks to all on VC who’ve contributed this info over the years!
I think a better understanding of past history could be a key indicator of what the future holds. My main question is does Ioto have a long history of such rates of inflation prior to eruptions, and what we’re seeing now is a repeat of past events/episodes…or is Ioto now rising at unprecedented rates towards an event the volcano has never experienced?
Will be interesting to see what transpires next.
We don’t know how this volcano has behaved before it’s previous magmatic eruptions, (We don’t even truly know what’s it doing now!) The scale of this unrest is 1 or 2 orders of magnitude above any other volcanoes that we’ve observed (minus Yasur) If this is the volcano’s normal supply then I’d imagine that the observed deformation is normal for the system. But honestly there is no way of us knowing where precisely this volcano is headed without more study.
Thanks Tallis…
One other thought: There is no shortage of water…both from the ocean and rainfall from above. Over the eons, simple diffusion of the water through the porous tephra could be now starting to heat up thus adding considerable pressurization over a wide area…but not necessarily uniformly due to differing amounts of embedded water (and at what depth). In fact, what if there’s a shallow water table under the center of the caldera (makes sense…i.e. a buried caldera lake)? If so, then a pocket of trapped water/saturated crust could be expanding at an ever increasing rate as it both decompresses as well as receiving additional heat from magmatic intrusion(s)…hence it’s expanding water that’s driving much of the inflation? Kinda like a pressure cooker rocker/regulator that slowly increases it’s rate of rocking over time while still letting off some steam?
Some pockets of inflation-deflation has been related to phreatic eruption and the hydrothermal system but the scale of deformation that we’re seeing is impossible for a hydrothermal system to pull off without FAR more visible disturbances. It’s all magma.
Hector, your model sounds a lot like what I am thinking CCN is doing. The whole magma chamber essentially shallowing seems interesting. This would imply not only a colossal amount of pressure but melt as well. The fact that the supply rates have likely remained unchanged since the last caldera-forming eruption, I think it’s possible that the volcano is nearly 100% molten and this phase of unrest specifically caused by buoyant magma.
In fact, I think there’s some way to merge my “Slow-slip” hypothesis with “ascending chamber” hypothesis. The ascending chamber could’ve made something akin to a ring-fault and now the block has been loosened enough for some movement. Just an idea so far.
Hector and Tallis, thank you very much for this article. When I noticed the NASA Firms satellite kept reporting hot spots on this island, I knew that it needed close watching. We need to stay on top of this volcano.
Geology Hub just released a video 39 mins ago (11:02 am PDT 20-Sept-2025 Saturday), see https://www.youtube.com/watch?v=RmbPm2zmYVo and it underscores our concern for this volcano. Timothy seems to think that the present rapid uplift is a small one time event caused by shallow magma and he states that the uplift has slowed down.
Uplift is definitely not small-scale
A comment about finding more information on Ioto from the JMA (Japan Meteorological Agency) Go to https://www.jma.go.jp/jma/kishou/info/goiken.html which is the JMA’s webpage for opinion/comments. In the upper right hand corner, you will find a google search box. Type in “ioto” and lots of search results will come up as the website opens the new webpages with the discoveries. My search found 157 finds. Nearly all are in Japanese, of course, but I have a Google translate plugin on my Mozilla Firefox browser which is able to auto-translate the documents so I can read most in English. (select your own, if you wish)
I wish we could get some studies of Ioto from this perspective – see https://research.noaa.gov/new-research-challenges-assumptions-of-what-triggered-hunga-eruption/ as a key question is “are we headed to a similar explosive event on Ioto like Hunga Tonga?” needs to be answered. See the science paper
Journal of Volcanology and Geothermal Research 451 (2024) 108077
The 15 January 2022 Hunga (Tonga) eruption: A gas-driven climactic explosion
Richard W. Henley a,*, Cornel E.J. de Ronde b, Richard J. Arculus c, Graham Hughes d, Thanh-
Son Pham c, Ana S. Casas c, Vasily Titov e, Sharon L. Walker
I hope we’re not sleep walking into a similar event on Ioto.
I think this hypothesis in that paper is exactly how it happened, and yes Iwo jima is heading for the same fate, just how long have we got to prepare for that eventuality is the question we shouldn’t be dodging, along with many others. I just hope no one gets hurt, but that is probably a false hope, but a hope nonetheless. I just hope humanity wakes up from it’s slumber before it’s too late.
Looking at the global annual mean stratospheric aerosol optical depth chart provided in Héctor’s section of the article, I’m curious.
Do we have any idea which eruptions produced the 4 sulfate spikes above 0.6 between 7000 and 5000 B.C. (ESPECIALLY what ever eruption cause that spike above 0.8 sometime between 5500 and 5000 B.C.) and the 1 spike above 0.6 just before 9000 B.C.?
An interesting question, and one I immediately had when downloading the data to check for possible Ioto spikes. The one around 5230 BC, which is the largest one, is likely from Kikai, the one at 5625 BC should be Mazama, then 6416 BC would be Kurile Lake, and lastly the 6667 BC event I’m not sure which eruption it could be (should be northern hemisphere though since 7 times more sulphur ended up in the Arctic than the South Pole), I do have a candidate but I’m far from certain and the age isn’t known.
What candidate (or candidates) might that be?
and any idea on what that spike around 9000 B.C. might be from?
9225 BCE is Fisher. The mystery one I’ve been considering is Fukutoku Okanoba, but there may still be a candidate in the Kuriles or even Central America; though it will be hard to find calderas of sufficient size for such a large spike.
After having a look at the Kuriles, I think they definitely have a shot at sourcing the 6667 BC event.
Thank you for the replies and thank you to you, Albert, and Tallis for the fantastic job on an in depth article!
Will be interesting to see which volcano may be the culprit for the 6667 spike.
That eruption from Fisher in my opinion is being under-sized by a very large magnitude in my opinion. VEI 6 eruptions do not form calderas that are 16x10km in area. That would nearly be physically impossible to be honest since the depression alone left by this eruption is larger in volume than a VEI-6. Unless the eruptive material that formed this depression somehow shrank after erupting (which of course isn’t really possible), this was at the minimum a VEI-7 with a minimum bulk eruptive volume of around 150-160 cubic km, and a likely bulk eruptive volume 2-3x that amount.
This assumes it was single-source, which is what is implied in the research, but may not be conclusive. This was probably a mid to large size VEI-7, comparable to or larger than some of the largest in the Holocene.
All that being said, I don’t think this was the 9225 BC event, as I’ve tried for quite some time to identify the likely culprit for that. Fisher’s eruption dating takes it to around 7395 BC, not 9225 (the estimated eruption date was 9400 before present, not 9400 BC).
As for the 6667 event, Karymsky is a potential culprit, although the caldera is on the small-ish size given what we can see for the sulfate spike. But the date lines up well, and we know that SIO2 injections are not only a product of eruptive size, but also sulphur concentration within the magma being erupted as well.
There are 2 videos from GeologyHub (one specifically on Fisher itself, and one on Kikai which briefly shows a chart of the largest eruptions in the Holocene with Fisher being at 142 km3) that might help with some of your suspicions on how big the Fisher eruption was.
Fisher: https://www.youtube.com/watch?v=O5q6uiunmMQ
Kikai (chart with Fisher eruption at 3:17): https://www.youtube.com/watch?v=RoP-zslkeI0
I am VERY very curious as to what you think which volcanoes are possibly responsible for the sulfate spike in 9225 BC.
The 9400 BP age for Fisher is uncalibrated*, though. Radiocarbon dating has to be calibrated, and I did so in OxCal. When calibrated, the age falls somewhere in the 9247 to 8248 BC range, making it very likely the one responsible for the massive 9225 BC spike, and a likely VEI 7 as you say.
As per the 6667 spike, I also had this conversation elsewhere, and Tao Rusyr (Kuriles) was mentioned. I haven’t had time to check it up, but it sounds like a reasonable candidate.
*If it says “cal” after the radiocarbon age then it’s calibrated if not then then it needs to be calibrated.
In general, it seems that mid-high latitude northern hemisphere eruptions are very good at producing large spikes relative to tropical/subtropical eruptions of the same size. Mid-high latitude southern hemisphere eruptions also produce relatively small spikes, namely Deception Island or Taupo, but perhaps that’s because most mid-high latitude volcanoes in the southern hemisphere are in the ocean, so the plumes are wet and cause SO2 to quickly turn to sulphate and fall out, or are subglacial, or have a big lake in the case of Taupo.
Quoting this comment from Terramosh for a reply – “There are 2 videos from GeologyHub (one specifically on Fisher itself, and one on Kikai which briefly shows a chart of the largest eruptions in the Holocene with Fisher being at 142 km3) that might help with some of your suspicions on how big the Fisher eruption was.”
142km3 is larger than I would have guessed coming from Geologyhub, since he generally provides in my opinion lower estimates for eruption sizes based off research on tephra deposits for a given eruption. Nothing wrong with this inherently, but I think the further back in time you go, the more difficult it becomes to accurately measure eruptive output based on just looking at the known bulk eruptive deposits.
My long-standing view is that eruptive output in a single-source caldera eruption is directly related to caldera size. Or rather, caldera size is a product of eruptive output. And since eruptions push out compressed material into a then decompressed state after eruption, it’s almost physically impossible for any single-source caldera event to have a bulk volume smaller than the volume of the void left behind after an eruption (aka the caldera). In every well known and well measured caldera eruption (mostly those taking place in the last 1000 or so years), bulk eruptive output is larger than the volume of the caldera left behind often by a magnitude of 2 or 3. This can vary of course, but the bulk volume is always significantly larger than the caldera volume, and never smaller or equivalent.
So for Fisher, given that the caldera is approximately 16×10 (some measurements say 18×11) and around 1 km deep, I would assume the minimum eruptive volume that is possible would be around 160 km3, but the likely output is probably 2-3x that amount.
Measurement of the eruptive output at Kikai has gotten larger and larger the more the eruptive deposits have been measured. More recent estimates have placed the eruptive output at Kikai as ranging around 332-457 km3 of eruptive output, which tracks given the size of the caldera.
“I am VERY very curious as to what you think which volcanoes are possibly responsible for the sulfate spike in 9225 BC.”
Honestly, I hadn’t found a good culprit after a lot of searching. But many years ago, my initial hunch WAS Fisher caldera before thinking that the date range did not align due to it supposedly erupting around 7400 BCE.
But if what Hector is saying is true, I may have been correct from the start.
Carl used to say this spike was probably an Icelandic spike, which was biased by how close Iceland was to the Greenland Ice Core locations, but I don’t think that makes sense for a variety of reasons.
There are a few other very large spikes if you go back in the record a bit further, notably around 10657 BCE, which saw the second largest spike specifically in the gisp2 record. I will note that there are going to be differences depending on what record you look at. So while any large sulfate spike is a good indication that there was a large eruption, it’s not a perfect correlation with eruptive size.
I agree Cbus, caldera size should be related to output. Usually calderas vary between 500 and 1000 m depth (using the young ones like Kuwae, Long Island, Samalas, Tambora, Krakatau, Hunga Tonga, etc). Given the area of Fisher (measured in Google Earth) the DRE volume is probably 60-120 km3, so most certainly a VEI-7, and being the third largest volcanic sulphate spike in the Holocene would support this.
Hector, did you use this record? https://agupubs.onlinelibrary.wiley.com/doi/10.1029/2020JD032855 as I am curious what ice core(s) you are looking at?
I have been using: https://essd.copernicus.org/articles/14/3167/2022/
They provide data for the sulfur load of eruptions as well as the proportion between hemispheres.
But I definitely want to look into WAIS divide ice core data, since it seems to have the best resolution and also goes back way before the start of the Holocene. There’s also very good sulphate Antarctic data from the SPC14 core for the Holocene, which I’ve already downloaded, and I’m in awe with the time resolution. For Greenland, I haven’t seen any good data, only GISP2 covers a reasonably long period but the resolution is really low.
Apparently, SPC14 also extends before the Holocene (to 54,000 BP). The volcanic signals are also much clearer than in the WAIS or Greenland cores that I’ve seen:
https://www.usap-dc.org/view/dataset/601851
I notice the eruptions over the last ten years or so are occurring in a semicircle around the island’s edges. Is this at all related to ring faults? The entire island is a resurgent dome, correct?
Not just the last ten year but during the entire 20th century. The eruptions move around the circle: before 2000, they were mainly on the northwest side, and report state there were fumaroles in a band running northeast to southwest across that part of the island in the 1940’s.
In the model, the cause is the block of Motoyami. It is a bit denser and pushes down on the more fluid material below and pushes it to the side. The heated fluid (water, initially) flows around it and comes up around the edge. That causes the phreatic eruptions, while Motoyami was sinking a little. Then the supply of heat increased, and magma became involved. Now the heat pushes Motoyami back up and the liquid flows all around the block. Eruptions now occur on both sides and now include magma.
This has probably been going for many centuries. Note the steps in the edges of the isthmus: each one is a wave erosion cliff, happening while the island was more stable, then uplifted during a time of increased activity. But the process is one way: there may be periods of limited uplift, but it as been continuously going up. And Motoyami as much as anywhere: it used to be under water, was not far above sea in the 1700’s (when the isthmus may have been higher) and is now a dome. How high will it go?
So Motoyama is a bit like having a block of ice in the middle of a bowl of ice cream? Maybe not the best analogy but if it is heavier (more dense) than the surrounding material perhaps it falls in? Or more that it is stationary or otherwise fixed in position (attached to something) and the magma is rising around it? Because if it is mostly made of pumice tuff that wouldn’t be terribly dense, as far as rocks go.
Is Motoyama behaving like a graben?
How deep does the Motoyama solid block go? Is it all the way down to an original vent?
This is the basic model. I don’t recall which paper it came from, but Hector will probably know. The basic idea is in Ukawa 2006.
Motoyami consist of tuff. It is not obvious why it would be denser than the stuff below, but that is what gravity measurements have shown (https://www.jstage.jst.go.jp/article/jgeography1889/94/6/94_6_488/_pdf). There may be a block of solidified magma below the tuff. The current eruption sites, on both sides of the island, have been active throughout the 20th and 21st century, by the way. Both erupted in 1982. They are not new conduits, although they have previously only shown phreatic eruptions. There is is a map of all known eruption sites in https://www.volcanocafe.org/iwo-jima-in-45-eruptions/. But be aware there are several lava features around Iwo Jima as well, including the small ridge-island off the north shore. The island has done much more significant eruptions than we see now.
“Hector will probably know.”
I haven’t seen this figure before, though it more or less matches with how I think the situation is evolving. High gravity may perhaps be explained by a solidified igneous complex, maybe ultramafic cumulates left behind by a former basaltic chamber, which wouldn’t be surprising for an ocean crust volcano in a mildly spreading zone with an effusive past. Usually calderas are low gravity anomalies since they contain low density pyroclastic materials and silicic melt, but basaltic shield volcanoes tend to have ultramafic cumulates that show as high gravity anomalies over their summits.
That dark red area on the graphics looks suspiciously like lava filled a vent and solidified. Agung did this, filled up the crater and then stopped. Agung is andesite though.
Albert, thank you for your explanation on this, it was enlightening to me.
Thanks for your analyses on Ioto!
Is the magma of the caldera volcano predominantly Trachyte or is there also a more primitive (basalt or alkali magmas) one involved?
Do we see a situation like Crater Lake (Mount Mazama) before the caldera eruption 7,700 years ago?
Taal does the phreatic/phreatomagmatic eruptions only in the center of the caldera on Volcano Island. There was no activity elsewhere during the current eruption cycle. It is probably a different type of a caldera volcano. Can we say that Taal belongs to a rather basaltic type of calderas, while Ioto, Crater Lake and Santorini belong to a more felsic caldera type?
Ioto is predominantly Trachyte but it can do trachyandesite and trachydacite.
Curious about the implication of Hector’s model. Would the observed 10 MPA increase in pressure be a transfer of stress from center to the sides or would it new energy added I would like tobl add that there was no large-scale deflation indicative of such loss in pressure.
I’m guessing an overall pressurization of the system, but focused near the sides of the magma body,
Have we seen a similar deformation pattern anywhere else? 10 MPa is quite alot and I am thinking about using to calculate how much magma entered the system
Isn’t pressure isotropic?
Pressure is isotropic but not homogeneous
https://www-data-jma-go-jp.translate.goog/vois/data/tokyo/329_Ioto/329_Obs_points.html?_x_tr_sl=auto&_x_tr_tl=en&_x_tr_hl=en-US&_x_tr_pto=wapp shows one surveillance camera at the Aso Taito location. Someone was trying to track down an active webcam.
https://www.data.jma.go.jp/vois/data/report/monthly_v-act_doc/tokyo/25m08/329_25m08.pdf is the latest monthly report from the JMA on Ioto, the pictures are very informative, now all that has to be done is an auto-translate for the pdf file.
https://www1.kaiho.mlit.go.jp/kenkyu/report/rhr44/rhr44-02.pdf
…
Wow.
So, looking at the airborne magnetic survey chart from 2007 on page 2 (bottom left), I can see what I’m assuming is the caldera rim that’s been discussed about on this site swinging around from NW to SE just off the NE side of the island.
But what about that area to the west of the island in the same chart? Is that a second even larger outer caldera encompassing Ioto?
It looks possible to me but I can’t say for sure.
Could be pyroclastic deposits.
Thank you for that post. I have attempted to contact a key author of the science paper on the Hunga Tonga eruption caused by a gas explosion after restriction due to certain compound phase changes in the caldera environment and I asked him how much we should be concerned about the Ioto inflation. If he responds, I will post reply.
That paper has some nice bathymetry pictures.
Recent NASA Firms sat photos highlight the need to be aware of certain areas of Ioto as a possible
new eruption site. The latest FIRMS is https://firms.modaps.eosdis.nasa.gov/map/#d:24hrs;@-218.68,24.79,12.98z where two locations are highlighted.(timestamp 2025-Sept-21) The location highlighted in red to the left is the area of the most recent eruption, but the area to the NE around the 25-30 deg compass direction is a consistent hot spot. See https://www.data.jma.go.jp/vois/data/filing/souran/main/74_Ioto.pdf page 3 (of 15) so the logged eruption map history. I am attempting to contact JMA (Japan Meteorological Agency) to see if public access to the camera at the Aso Taito location is available. I will let you know of their response.
Good luck! FIRMS isn’t all that reliable for spotting eruptions though.
But reliable enough to spot hot spot activity today Monday Sept 22nd, 2025 slightly to the east of Volcán de las Estrellas, on its slope, on Isla Isabella of the Galapagos Islands. I have noticed that FIRMS does spot activity that sometimes we’re not aware, such as offshore Mexico in the islands there.
Because the hot spots can also be forest fires or grass fires, yes?
It shows heat, but does not explain the source of the heat.
As such, you will get a lot of false positives.
Grass fires on top of glaciers near the south pole, say Heard Island? Nonsense! You are expected to use your common sense, of course!
Penguins starting fires, I tell you, they are up to no good.
Penguins: “Just smile and wave boys!”
Interesting, the way Hectors model goes, it looks like the lid could remain intact potentially and so the huge blast that Hunga Tonga Hunga Ha’apai did may not be likely to happen at Ioto in this model. Tsunami risk is likely the same if that is caused by the submarine flows displacing water, but might be less at a great distance compared to if it went nuclear.
Although it also kind of models that it all just goes up pretty suddenly too and might not have a big eruption precursor…
Akan’s (Hokkaido island, Japan) alert level has been raised to level 2. Since 19th century all eruptions were small and phreatic with VEI1, but Akan also did VEI4 eruptions during Holocene.
Reading Héctor, Tallis and Albert’s fine article made the hair on my neck stand up. Anyone on Iwo Jima should leave. Now.
When Hunga Tonga went up there wasn’t an island left, pretty much. When Krakatoa went up likewise. When Iwo Jima goes up all that will be left is a hole in the Pacific Ocean.
The data and reporting is really eerily like what I read in the Royal Society’s 1888 report on Krakatoa. This could be big.
Take a look at the 3d map on page 5 of https://www.data.jma.go.jp/vois/data/filing/souran_eng/volcanoes/074_ioto.pdf and tell me if it looks like big explosions at Ioto have occurred before. I can see large tephra or (whatever is the correct name) volcano fragments sprayed on the sides of this volcano from the past (underneath sea level of course) My question is “does Ioto contain the magma which can undergo a phase change sealing gas escape?” If so, I would evacuate the island soon. The USGS has an interesting comment about Ioto, see https://pubs.usgs.gov/publication/70215693.
Article is older than my Nana but I still gotta get permission? B.S
The volcano definitely has blown its top multiple times for sure!
This article goes in-depth into the mechanisms of caldera resurgence:
https://www.nature.com/articles/s41467-017-01632-y
It describes a cap of left-over viscous magma that creates a barrier to the ascension of fresh magma.
I would hypothesize that in the case of Ioto, the rising magma along the edges of the top of the chamber has pushed this cap layer up to the point that it is interacting with the hydrothermal system and that’s why we’re now seeing these low intensity phreatomagmatic eruptions.
A larger eruption may not be possible until this layer is fully breached by the more volatile magma below it.
I also question the idea of a secondary cone-sheet intrusion. Looking at the magnetic data in Tallis’s article above, it seems that the inflation is related directly to the growth and ascension of the magma chamber. If this is true (I could be wrong), the implications are certainly concerning.
The ascending magma chamber could driven primarily by heat, after such high supply rates, I’d imagine the magma chamber to be nearly 100% molten. This study also implies that magma chamber is just 1.2-1.5 km below the surface.
Why not drill and find out? That 1.5 km distance is easily drillable today. This has been done in Iceland, of course. (with surprises)
I doubt the JMA will do anything satisfactory or ambitious with this volcano.
See page 12 of https://www.data.jma.go.jp/vois/data/filing/souran_eng/volcanoes/074_ioto.pdf for the best model for Ioto. It seems to make some sense to me that the heaviest material would accumulate in the center of the caldera, to be jostled around by the magma push-ups, as the Ioto volcano goes through its activity.
This is a very nice, clearly written paper.
I notice in Table 1, the magma supply for resurgence for Ioto is listed as “inferred”.
Do they not have data on this? It has to be coming from somewhere, right?
Also, the paper mentions high CO2 emissions on resurgent calderas. Do we have any gas emissions data on Ioto?
We do, but you will have to use Google translate on the JMA publications
How can we predict how much of the magma dome is going to erupt and how much is going to stay inside as intrusive rock?
How explosive is the magma? There was not much degassing until now, so the magma is probably very gasrich and can do big explosions if it’s depressurized.
I asked DuckDuckGo AI assist to help out and it stated
Region Volcanoes Details
Northern Mariana Islands Ioto (Asuncion Island) Known for its trachyte lava flows and domes.
Canary Islands La Palma Contains trachyte in some of its volcanic formations.
Italy Vulcano Features trachyte among other volcanic rocks.
United States Yellowstone Caldera Contains trachytic rocks, particularly in the form of rhyolite.
East African Rift Mount Meru Exhibits trachyte lava flows and domes.
Andes Mountains Nevado Tres Cruces Known for its trachyte and other volcanic rocks.
The AI says that trachyte lava can be explosive. Any volcanologists here on VC who can explain a bit more?
Trachyte is like alkaline dacite, same SiO2 range although its more evolved in other ways at least it looks that way on charts. Its probably what Ioto is erupting now. Its also very common in the EARZ volcanoes.
If its explosive depends on how much gas and how viscous though. Most trachyte seems to be pretty low viscosity for a felsic lava, forming big lava flows. Maybe it tends to be crystal poor from sitting in magma chambers.
earthquake swarms has raise on tenerife Norteast dorsal.
https://visualizadores.ign.es/tproximos-canarias/
… and Hurricane Grabielle is going to cross through the Azores archipelago, maybe with a final disastrous impact in the mountains of Spain’s Galicia: https://www.nhc.noaa.gov/refresh/graphics_at2+shtml/231445.shtml?cone#contents
Will be fun to see if the sea surface there will allow tropical convection, they reads 24 c now at sea surface which is typicaly below whats required for tropical systems, but not impossible if the lapse rates in the atmosphere is high enough but the hurricane will likley collpase quite soon into a stratus extratropical rainstorm when it leaves the main core of the gulf stream waters
A Hurricane can continue for a while as a subtropical hurricane, if 5km high air is cold enough to let the temperature difference between sea surface and 5km high air continue.
If the temperature difference is high enough, even the Polar regions can develop a kind of Polar Hurricane or “Polar Low”: https://user.eumetsat.int/resources/user-guides/polar-lows
Are winter polar lows ( at svalbard ) fully warm core and convective?
I think usually they have cold air in 5km above the core, but relatively mild temperatures in low atmosphere. The difference between the sea surface and 5km has to be 40°C or 40 Kelvin. The warm Gulf Stream causes relatively high sea water temperatures in the Norwegian Sea. If high cold air around -40°C comea over this mild sea water, the difference of 40 Kelvin is quickly reached.
https://resources.eumetrain.org/satmanu/CMs/PL/navmenu.php
During fall and early winter you can see thousands of Cb-clouds which contain showers and thunderstorms on the Northern Atlantic Ocean. They show strong convection, because cold air above warm sea is an explosive meteorological combination. This effect increases extremely in the cases of Polar Lows.
A reverse hurricane! Usually they form lower in the atlantic off the sahara and head clockwise-southwest. This has formed near Bermuda and headed straight clockwise-northeast.
Also there is super typhoon (currently at ‘very strong typhoon’ 130mph status) Ragusa currently about to impact Hong Kong. Typhoon Bualoi will also impact the Phillipines at 80mph tomorrow.
Grabielle formed in the central Atlantic Ocean, moved NW towards Bermudas first, but changed the direction towards NE and E afterwards without approaching Bermudas. During late seasons the storms often move/behave different than early storms:
https://www.nhc.noaa.gov/archive/2025/GABRIELLE_graphics.php

It’s verified that the earthquake swarms and unrest of Santorin was caused by an intrusion: “Joint inversion of ground and satellite-based deformation data indicates that approximately 0.31 km3 of magma intruded as an approximately 13-km-long dike” https://www.nature.com/articles/s41586-025-09525-7
VC Articles:
https://www.volcanocafe.org/santorini-shaking/
https://www.volcanocafe.org/santorini-beauty-and-the-beast/
This is pretty interesting, I wonder how common this behaviour is for Santorini, and what the connective series of reservoirs between Kolumbo look like. It seems that they act separate sometimes and others they are connected. A bit like Campi Flegrei/Ischia/Somma Vesuvius.
Wasn’t there a lot of press at first discounting anything magmatic? Was that done to keep everyone calm?
Probably
In particular Professor Nomikou, who is a co-author of the above Nature paper, was all over the media saying “purely tectonic”. She later back-tracked and said she didn’t want people panicking because they confused deep magma movement with a surface eruption.
However even if done with the best of intentions, she’s now known as the one to not trust in future events. Many other Greek experts did give the full picture though as best they saw it and some openly criticised Nomikou at the time.
That conclusion sounds familiar 🙂
https://www.volcanocafe.org/afar-holocene-volcanoes-1-volcanoes-in-an-ancient-lake/comment-page-1/#comment-161508
SIlverpit has been confirmed as an impact crater.
https://www.sciencenewstoday.org/scientists-finally-solve-20-year-mystery-of-the-crater-hidden-beneath-the-north-sea
Now if we could find out what this is? See any bathymetry map at 42.401690 N, -130.926147 W in the Pacific Ocean offshore Oregon about 300 miles or so from the coast. Some bathymetry maps show a distinct crater.
It looks like just a random seamount, if it was a big enough impact to leave an impact crater in tbe deep ocean it would be known already too, the ocean can absorb even pretty huge asteroids. The Eltanin impact 2.5 million years ago was one of the biggest since the K-Pg and even with the asteroid over 1 km wide and with a known impact area, no crater has been found there even though there should be one 35km across or more.
I have looked at 4 different bathymetry maps, two show a crater, one of the two quite deep, and two maps show a seamount, so there is definitely confusion here.
And the deeper the ocean is the bigger asteroid blasts it can absorb before damaging the ocean seafloor, something as deep as the mariana trench 11 km maybe a descently good sheild against something thats a few kilometers wide .. still the energy of impact is tremedous and colossal ammounts of hot seawater vapor woud be injected into the upper atmosphere. A KT sized impactor strike at steep angle is needed at minimum to make a large impact crater in the challenger deep
It is INSANE how deep the mariana trench is and even how deep even some of the deeper abyssal pacific plains west of Hawaii towards Asia are. Here you haves seswater as deep as jetliners often fly or even deeper than that .. many persons fears the ocean phobia because of this. Earths seswater content is likey random.. we coud have formed with even much more seawater leaving only the taller mountains plateaus dry ..
My local inland ocean is just a thin skin in comparison! Baltic Sea is even is a thin skin compared to the Iceland and Azores thats ” a very shallow ridge deep seas” in terms of real oceans ..
What was the volume of the dike that fed the Holurauhn eruption
https://blogs.egu.eu/geolog/2015/05/08/icelands-bardarbunga-holuhraun-a-remarkable-volcanic-eruption/ states 260 m^3 per sec while the dyke propagated starting August 18th, to when the fissure eruption started in early Sept, seems to be 14 days = 0.314 km^3 volume. (if I did the math right) See also https://meetingorganizer.copernicus.org/EGU2015/EGU2015-10322-1.pdf on this. The dyke volume info seems hard to find on the internet.
Thanks
So according to todays met office update we’ll reach the lower volume limit this sunday and the upper limit in december given constant inflow.
They say that we enter a period of higher likelihood for an eruption now: “Increased likelihood of an eruption from 27 September”. The likelihood is probably still low, but above zero. Maybe a subjective likelihood of 1% for an eruption is appropriate for each day.
Icelandic TV has an article today:
Increased likelihood of eruption; preparedness level raised (RÚV, 26 Sep)
The good news is to me it looks like the locus has shifted farther and farther to the NE, so Grindavik and the Blue Lagoon are probably going to be ok.
Yes, the 1b Svartsengi Fires have migrated to the slopes of Thrainsskaldarrhaun (an old lava shield that was created ~14,100 years ago). It’s possible that the next episode happens on Kalffelsheidi or beyond towards Strandaheidi. Between these two “heidis” (heathlands) a short and small fissure erupted 4,5-5 thousand years ago.
The recent Svartsengi lavas have already touched and covered old Fagradalsfjall lavas. The Catalogue of Icelandic Volcanoes shows the Fagradalsfjall lavas based on the study of Sæmundsson et al. (2010). The last episode covered the valley “Fagradalur” with lava, after which Fagradalsfjall was probably labeled.
SDH tilt has inflated close to the level, when the previous episode started:
HVO expects the next (34th) episode for 28th September to 1st October.
Not sure what’s up with Katla/Goðabunga. Been an ongoing swarm for quite some time. Was thinking maybe ice quakes or effects from Summer melt since the quakes are all very shallow, but the Mw3.2 is rather large for that (but I could be mistaken). Maybe a large break in the glacier?
Probably. Glacier quakes are normal. Geothermal heat is probably responsible
I’m puzzled. Aren’t earthquake depths measured from sea level as the base? If so, I would expect glacier quakes on Iceland mountains to have negative depths; the ice doesn’t extend below sea level, as far as I know.
What woud happen IF I fell into Neptune? here is an amazing introduction video 1 hours
https://m.youtube.com/watch?v=ERMDerlleOw&pp=0gcJCfYJAYcqIYzv
We would be very sorry. We enjoy your articles – please don’t fall into Neptune!
I wants a new Jupiter atmosphere parachute probe with good cameras. Also entry into the gas giants are extreme compare to the small Earth and that rings very true for Jupiter upper atmosphere entry, minimum heat shield temperature at Jupiter at low angle attack entry is 15 500 to over 16 000 c !. On Earth its only perhaps 1650 c. Jupiter is an extreme entry almost unsurvivable even by modern technology
https://www.uh.edu/nsm/news-events/stories/2025/0422-tracking-volcanoes.php fills in a gap of my knowledge about using the strain in fiber-optic cables to detect volcanic eruptions in real-time.
Low-frequency distributed acoustic sensing (LFDAS) was used to detect strain changes in the fiber-optic cable.
The study, titled “Minute-Scale Dynamics of Recurrent Dike Intrusions in Iceland with Fiber-Optic Geodesy”, captures the evolution of volcanic dike intrusions near Grindavík, Iceland, over the course of a year, using a buried telecommunication fiber-optic cable repurposed into a dense array of deformation sensors.
IMO was able to get about 20 minutes warning ahead of time before the fissure eruption actually surfaced.
https://www.science.org/doi/10.1126/science.adu0225 is the article (behind a paywall) but the publicly available supplemental pdfs contain very interesting information.
This appears to be a step forward in a reliable detection of fissure eruptions before they surface.
The paper will be publicly available April 24, 2026 – https://par.nsf.gov/biblio/10601312-minute-scale-dynamics-recurrent-dike-intrusions-iceland-fiber-optic-geodesy
There is ongoing unrest at Pelee, this week it had 2270 earthquakes- 2203 VTs, 57 shallow hybrids, 5 shallow LPs, 2 deep LPs, here is the bulletin:
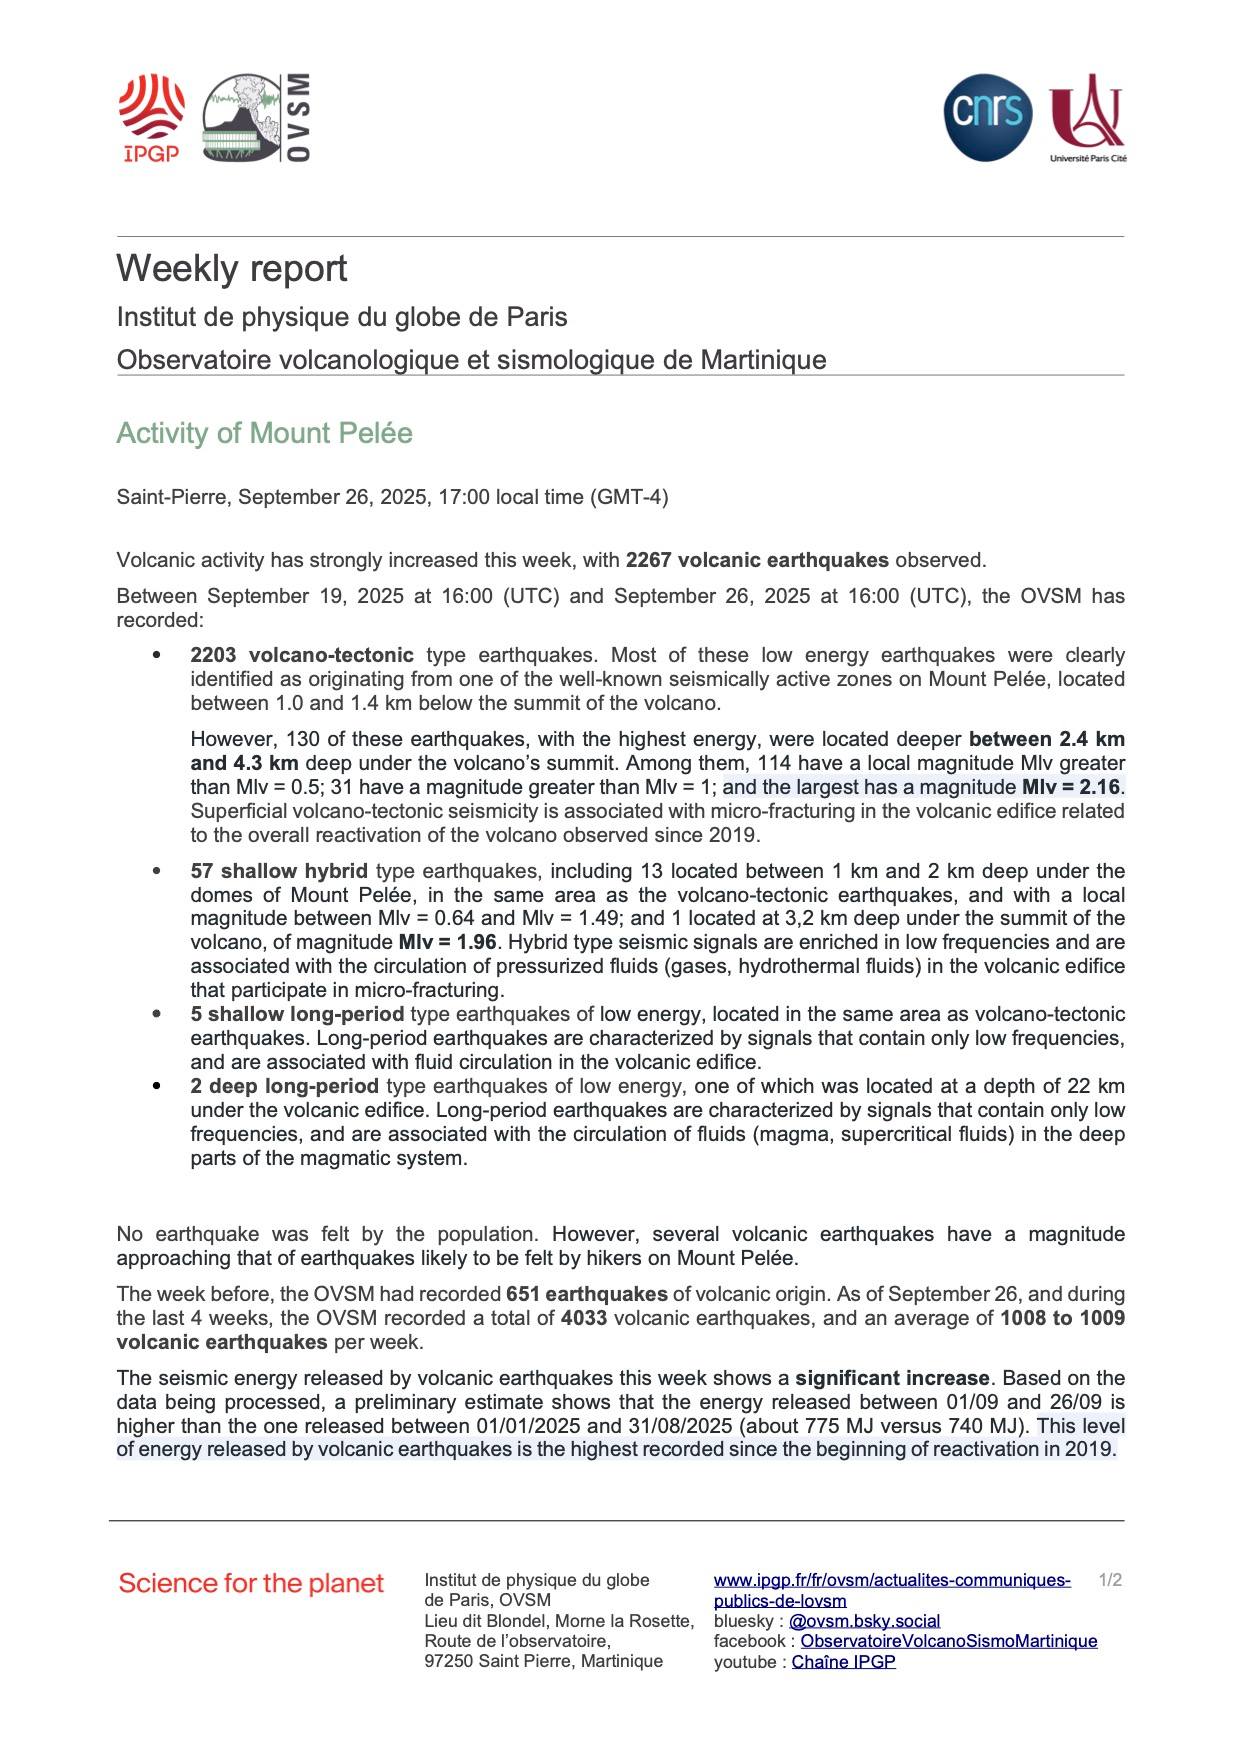
That’s some escalation.
There seems to be public access to the seismographs (about 30 or so) on Martinque but via fdsn.org. But a real-time waveform program like Streams or jAmaseis Stream view is required to read the miniseed data streams. Is this of interest to anyone? It appears that the data collection has been collected only certain hours of the day for the last 3 months for Pelee when I looked at station PBO right at the summit.
…
https://www.mext.go.jp/content/20250217-mxt_jishin01-000040346_4-2_2.pdf
This is a great paper. Google translate failed completely, are there any other translate apps which can handle a pdf file?
Source: https://www.mext.go.jp/content/20250217-mxt_jishin01-000040346_4-2_2.pdf
Document titled
Iwo Jima
The 4th Volcanic Investigation Committee
Japan Coast Guard
SYSTRAN translator
Translating pages 11 and 12 and edited for clarity
Survey of Submarine Topography around Iwo Jima
1. Outline of the investigation
The Japan Coast Guard conducted a geotechnical survey of Iwo Jima to prepare and update a nautical chart and to prepare basic information on marine volcanoes are the tasks performed. The topographical features (summary) of the sea bed and the change of shape are reported
2. Investigation results
2-1. Outline of the Submarine Topography
Four times in 2013, 2019, 2021, and 2023, using topographic data acquired by our agency survey ship
Sea bed topographic maps were created (Figures 1, 2, and pg 1)
Iwo Jima is a stratified volcano with a specific height of more than 2,000 meters from the bottom of the sea, and most of it is below the sea level.
Main survey
The topography of the fault, which is estimated to be an annular fault centered near Mt. (Moyotama?)
It was found on the seabed from the northeast to the south (Figure 3)
In addition, lava-like topography was observed on the seabed from the northwestern part to the northern part to the eastern part of Iwo Jima (Fig. 3)
2.2. Changes in Submarine Topography
The existence of topographic changes in overlapping sea areas of the submarine topographic survey conducted so far is examined by comparing the depth of water. Those changes are confirmed.
The results of the 1991 survey are shown in Figure 4. The survey was conducted on the Takuyo surveying ship and the positioning is based on GPS alone, and the depth is based on the multi-beam acoustic depth sensor and the thin-beam sounder.
The sound depth sensor was used. At the time, GPS had only a small number of satellites, so there were times when the satellite arrangement was skewed.
In addition to the many cases, a positioning accuracy reduction process called SA (Selective Availability) was performed [SA was turned off]
Therefore, the horizontal accuracy of single positioning is considered to be about 100 to 200 m. In addition, the performance limit of the point density (depth accuracy) of deeper data is lower than that of this study.
2.2.1 Water depth comparison between 1991 and 2023 (32 years)
Figure 5 shows the results of a comparison of water depths in 1991 and 2023.
The fault is shallow for up to 20 meters on the inside of the circular fault off the Kitanohana coast on the north coast of Iwo Jima. supposed to be caused by a bulge
This is approximately 0.6m/year. [ 20 meter change in 32 years ]
2.2.1 Water depth comparison between 1991 and 2021 (30 years)
Figure 6 shows the results of a comparison of water depths in 1991 and 2021.
It is shallower by about 35 meters at maximum between Jailhouse Rock and Iwo Jima off the northwest coast of Iwo Jima and about 30 meters at maximum off the southeast coast [ 35 meter change in 30 years ! ] is present. If it is caused by a bump, the bump is about 1.2m/year and about 1.0m/year, respectively. Both are annular
It was inside the fault. Also off the southwest coast of Chidorigahama, it is shallower by up to 20 m, about 0.6 m, It is a rise of m/year. [ 20 meters + in 30 years ]
2.2.2 Water depth comparison between 1991 and 2019 (28 years)
Figure 7 shows the results of a comparison of water depths in 1991 and 2019.
No significant change in water depth was observed.
2.2.3 Water depth comparison between 1991 and 2013 (22 years)
Figure 8 shows the results of a comparison of water depths in 1991 and 2013.
It is shallow up to about 20 meters inside the circular fault off the north coast of Iwo-jima Island. supposed to be caused by a bulge
This is approximately 0.9m/year. [ 20 meters + in 22 years ]
2.2.4 Comparison of water depth between 2013 and 2023 (10 years)
Figure 10 shows the results of a comparison of water depths in 2013 and 2023.
It is shallow by up to about 15 meters on the inside of the circular fault in the north to northwest of Iwo Jima. assumed to be due to a bulge
The peak is about 1.5m/year. [ 15 meters + in 10 years ! this is significant]
2.2.5 Conclusion
Uplift is observed in the sea area of Iwo-jima Island, off Kitanohana, off the southeastern coast, off Chidorigahama Beach, between Kangokuiwa and Iwo-jima.
The upheavals were mainly prominent on the inner side of the circular fault. Based on the results of the interference SAR analysis conducted by the GSI (Figure 11)
In the land area, there is a ridge zone with large fluctuations on the donut, centered on the Yuan Shan, and the above raised area is considered to be part of a raised belt.
In addition, the change in the area where the upheaval was found tended to be larger as it was closer to the coast of Iwo Jima.
On the other hand, there was no significant change in the water depth offshore.
— end translation —
The inflation of the caldera is larger than commonly thought. A 15 meter rise in 10 years is significant.
This is really interesting! I would interpret this as a 15-20 meter rise within the ring-like fault but not at the fault itself. The higher value of 35 meter may include sand deposition: this region has been collecting sand which has caused the coast to extend further. The sand is being caught by the narrowing channel. This changes my impression of what is going on.
“This changes my impression of what is going on.”
how so?
It is not just the centre that is uplifting. The entire region inside what seems to be a caldera (or perhaps overlapping ones, based on the shape of the fault) is coming up.
…..that sound’s concerning
So Iwo Jima has experienced easily over 1 km^3, maybe closer to 2km^3, of inflation since the fall of the USSR, probably most of that in the last dozen years…
Also the inflation seems lopsided. It starts petering out somewhat short of the rim on the north side. Conversely, some of the yellow dots extend quite a way around Suribachi. The recent unrest formed a 3-way junction of faulting between the two eruption sites and Suribachi. I would tend to guess Iwo Jima was one of those systems that was inflating even when it was erupting. I’m wondering if the lower parts of Suribachi’s feeder system never got to solidify with all that fresh magma coming in.
The caldera might end up with an extension that way, sort of like how the magma chamber of Samalas collapsed, but there was a triangular extension to the young parasite cone of Rinjani as its conduit collapsed when the magma chamber did (so Rinjani is probably deader than a doornail!).
It follows the caldera rim quite well, and the submarine area seems to be the fastest uplifting one, up to 1.5 m per year. Very interesting.
Looked at Hector’s fault map. The fracture zone (ignoring the Suribachi extension) appears to be placed roughly halfway between Motoyama and the caldera rim. The outer edge (where the 2023 and 2025 eruptions were both placed) is only 1 km or so from the rim. Assuming that pattern continues similarly offshore, a circle 7-8km wide should be encompassed (the stretch from the ’23 eruption to where it runs in the sea near Kangoku is 5.5km as the crow flies, and the actual width will be greater as that doesn’t pass very near the center of Motoyama). Given that ring faults are generally inward facing and stabilizing of the slopes will widen the resulting hole, it seems a safe bet that a collapse would encompass at least most of the caldera, perhaps with an extension near Suribachi making it tear-shaped…
That’s a pretty big ring fault! A 7km-wide caldera would cover 28km^3 and only need to be 320 meters deep to be the size of Krakatoa. Conversely, if it is roughly the size of the old caldera (~70km^2) and 1 km deep, it could get about 50% bigger than Tambora. I think those are probably close to the smallest and largest sizes that could realistically be expected if it goes caldera.
Another way to think about it is Hunga Tonga’s caldera collapse covered about 13km^2 (DRE ~4 km^3 DRE). Krakatoa about 20km^3 (~12.5 km^3 DRE). Tambora about 35km^3 (~40 km^3 DRE). Of course the tricky thing is in these examples we are going toward deeper calderas with bigger edifices on top. Tambora was 10 times the size of Hunga Tonga, not 3 times.
I find it hard to imagine the caldera was formed in 800 BC. In a certain sense 80 meters of pyroclastic layers is not *that* much. Even a shallow caldera that size would require quite a bit bigger eruption than Krakatoa. And presumably before the caldera formed, there would have been more vertical prominence. Albert mentioned in his article that down a ways there is a 300 meter-thick lower-velocity zone. That seems more appropriate for a 70km^2 caldera-forming eruption… My guess is it formed in a VEI 7, then dropped only a few hundred meters in 800BC to produce a mid-range VEI 6.
When do you think the VEI 7 eruption was if not 800 BC?
Also “50% bigger than Tambora”
That’s gotta be something like 200 km3 bulk volume right? That seems… REMARKABLY large for the a subduction zone volcano.
Toba and Taupo would like a chat with you about subduction volcanoes!
In my opinion, Tambora was really not a very large VEI-7, it was just more recent and therefore we can more easily measure and observe its effects. And subduction zone volcanoes / calderas can be huge.
Most very large caldera systems that can produce large VEI-7’s or even VEI-8’s exist in subduction zone regions.
At Kilauea, the next episode is getting closer. Visible lava on the V1cam 90 minutes ago and currently there’s some spatter reaching over the rim every now and then.
And there goes the first small overflow.
Actually not that small
This view shows that the progressing lava shield/field/lake is soon approaching the fumaroles on the east side of it.
https://www.volcanocafe.org/a-quick-tour-of-volcanism-on-io/
Since Kilauea is comming up soon how about a tour on Ionian eruption styles? one of my most fun articles ever
Do you guys think that these guys who study Ioto think it will do a CFE? So few of these studies, try ascertain what exactly is going on or what it means for the system’s future. The mechanics of this system is insane and yet it gets little attention.
This blog is almost in complete consensus on this volcano’s future. Some would argue for Campi Flegrei, I’d argue for CCN, another would bring up Laguna Del Maule or a volcano from the Altiplano complex but this volcano is the only one that gets near universal approval.
Surely someone is taking this seriously right?
I asked Grok what the probabilities are for a CFE on Ioto and the numbers are quite low for the first 100 years: less than 1%. For the next 1000 years the probability increases to 5-20%.
It says:
“Why So Low? Caldera-forming events require synchronized conditions: rapid magma recharge, overpressurization, and vent breaching. Ioto’s history shows 44 phreatic eruptions since 1889, but no magmatic ones until recently—suggesting the system is building but not yet critical. Globally, VEI 7 odds are ~1 in 65 per year, but localized risks are far lower.”
In contrast, Campi Flegrei is deemed more imminent in terms of a major eruption: “Expert elicitation (Aspinall et al., 2023) estimates a 1–5% chance of a VEI 6+ eruption in the next 100 years”.
I don’t know if I’d trust an AI for finding out that sort of info.
AI’s answers are only as good or bad as the data available to it.
In this case the data volume is probably fairly skewed since Ioto receives very little study, being seemingly treated as a backwater footnote compared to Campi Flegrei which receives study and papers all the damn time.
It will depend strongly on whether the AI was trained using Japanese resources
The thing is, Ioto IS a backwater. It’s very far out of the way and extremely dangerous to approach. Not a good environment for delicate research.
@Albert I’m not counting on Grok being trained on Japanese
@Hayden And there lies the problem. It badly needs more attention. If anything, Hunga-Tonga ought to have made that clear.
Nice spattering on Kilauea
The last batch of overflows some 4 hours ago were also quite impressive. I get a feeling that there are cycles within the cycles. A few repetitions of overflows and spattering, then back to a longer lull and then repeat. It did the same for the last episode.
Spattering and overflow resumed. I notice there’s much less of a dome fountain now. More spatter and gas output. That must mean that most of the stale, degassed magma has already been pushed out of the way and that we are getting very close to the high fountaining stage.
Looks like it’s going now. Just waiting for the cascade to gain some height.
There she goes
I recommend V3cam
Good call! Here it is:
https://youtu.be/BqmpkUdMtyA
Notice the glow inside the south vent. Lava level is high inside and we might get the same floods as last time.
South vent joined in on the action with an impressive fountain of its own.
Well, now the south vent has gone full high fountain (while the north vent fountain lowered a bit) at Kīlauea…
Now with the south vent going, there are now rootless lava flows OUTSIDE the caldera!
And then south fountain is GIGANTIC right now!!! This has to be a record for this eruption, if not, maybe even one of the tallest in Kīlauea’s recorded history!
(K2, static)
These were the fountains after peak, but I am positive they were taller before.
Not sure if they were that much taller before. Note that V2cam has been zoomed out, giving the impression of a smaller fountain. From V1cam and V3cam it’s really hard to tell. There’s lava flying freakin everywhere!
I guess. I was going to look at the B1 camera, but that has long past and missed it.
A difficulty with estimating the height of the lava fountains by eye is that the base has grown with each episode. They need to do a trigonometry calculation to get the actual height.
One thing is obvious now: The lava fountains put lava/tephra again on the caldera rim and outside the caldera. We need to wait for daylight to get a better view on the new volcanic layers outside the caldera.
K2 webcam shows the tall lava fountain from distance now:
Amazing, really, must be among the tallest fountains in Kilauea’s recorded history indeed, I’m guessing 400-500 m?
Not even V2cam has the entire fountain in frame. Crazy stuff.
(S1 Cam, static)
There is a ash storm there now.
(UWD, 1 month, live)
Looking at this, if it keeps up this intensity, it might only last a few more hours. The drop is insane!
(SDH, 1 month, live)
The SDH isn’t even registering (so far)!
Just thinking about why they are not adjusting the cameras.. Goverment shutdown, or just sleeping still?
Mac
Yep–I haven’t received my HVO email indicating the high fountain(s) started. Usually, even if it’s the middle of the night, someone’s pressing the send button.
https://www.doi.gov/shutdown
Found a reason and it’s because of a government shutdown of some kind. First time I have heard about it.
https://www.bbc.com/news/articles/crrj1znp0pyo
Here for more information.
Ah, so that’s it. At first, I was thinking, “What does that even mean?”
Thanks everyone! FarmerOz will have his requested oh-and-ah pictures. Just to add to his future enjoyment, here is one more
This time the southern fountain is stronger and taller than the northern one. The southern fountain also is the one that drops lava/tephra outside the caldera now. Both lava fountains are leaning towards opposite directions: the northern lava fountain NE towards V1 life-webcam and V3 SW towards the tephra sand dune outside the caldera.
Let’s hope FarmerOz checks in here first thing in the morning. Those cameras have a 12h buffer, so if it’s aussie morning in 8h from now, there’s still a chance to rewind and see the whole thing.
ace, and I even got to see youtube actual activity!
Copied to interested friends….
Southern vent just shut down.
And there just went the northern vent. Episode 34 is done.
Good job I didn’t blink…!
Also, the still pic will be available to people reading this days, weeks or years in the future. So a record is easily available for those who come after.
Wonder if Kilauea has a new summit (for a couple of days)?
Not really sure, but I think it might roughly be 25-50 meters above pre-eruption levels, but that won’t be confirmed by USGS for a while due to current circumstances…
Cone would need to be 100 meters tall above the rim to do that so I doubt it right now, but if this is the new norm for a while it might get there pretty soon. I imagine USGS will be out there first day back.
The actual 1247m high peak of Kilauea is somewhere on the north side of the Caldera close to Crater Rim Cabin (in Google Maps) along the Hawaii Belt Road. The highest current altitudes of Kilauea are probably the remains of ancient shield eruptions like Observatory shield, when the erupting vent was higher than the Hawaii Belt Road.
The Caldera Rim, where tephra has been deposited recently, is around 1130m high. The “sand dune” has to be more than 100m high (as Chad wrote) to come close to Kilauea’s peak. I’d estimate that the tephra sand dune is only 30-50m high
The peak is at U’ekahuna, where the HVO building used to be. The rim that the cone is growing on was 1145m before, the last HVO talked about tbe cone is it was 30 meters estimated, so about 1175m. But that was also before E34, which made a big difference. Wouldnt surprise me if the cone is close to 1200m now. Its still probably got 60 meters or so to be the new summit but if E34 is a new trend that might happen quickly…
Though my next “proper” Kilauea update will be after the close of episode 35 (I suspect October 14 give or take a few days), I thought I’d make an exception for this one solely because of the sheer power of the episode. Two tall and voluminous fountains have led to an average effusion rate of 450.5 m³/s(!) in the just over six hours it lasted. For comparison, the previous highest effusion rate, of episode 23, was 206.2 m³/s. The VONA issued after the episode ended additionally notes south vent’s fountains attained about 400 meters in height – I believe for the first time since Pu’u’o’o’s fountaining phase. Assuming south remains debris-free (which, so far, it seems to succeed in), I wouldn’t be surprised if, in the not-too-distant future, we’ll have to compare with Kilauea Iki rather than Pu’u’o’o on this subject.
Jane Goodall has died
RIP. A great scientist and woman!
She was a real behavioural scientist, there are so few nowadays that follow the actual evidence rather than political dogma. Its hard to realise how earth-shattering her discovery of warfare, cannibalism, murder and hunting in chimpanzees was at the time. Many refusing to believe her findings for years. Wiki says:
” The chimpanzees at Gombe kill and eat as much as one-third of the colobus population in the park each year.[27] This alone was a major scientific find that challenged previous conceptions of chimpanzee diet and behaviour.[32]”
Even today, many try and pretend N.American natives didn’t really go in for mass killing of prey (as I am sure all native populations worldwide who could, did). Also that H.Sap didn’t cause extinctions of many megafauna despite actual examples (eg N.Zealand) being available wherever opportunity arose.
For this and very many other things we owe Jane a deep debt of gratitude.
Sadly her legacy is already waning in the face of politics (see: now not to get your paper quoted and published…).
Snaefellsnes is experiencing a significant seismic swarm right now (at least compared trop previous seismic activity): https://en.vedur.is/earthquakes-and-volcanism/earthquakes/snaefellsnes/.
By the way, i’m not posting a lot, but I do read the articles and comments, thanks a lot to all of you for this blog!
Three stars already this morning. All checked events are at 18 km depth
Kilauea stats as of E34.
2018 caldera volume ~0.8 km3
2020-2023 eruptions total = 204 million m3.
Ongoing eruption = 177 million m3
Combined = 381 million m3, 0.38 km3.
Ongoing fill rate 620,000 m3/day, 0 23 km3/year.
Estimated overflow August 2027 but vents will be as high as the rim possibly quite a lot earlier, maybe even mid next year.
2 minutes of Big Island News Video summarize the eruption well and show the best moments: https://www.youtube.com/watch?v=ZUppmcByPC0
I’d estimate that the cone is now ~50m below the caldera rim, and the tephra dune outside the caldera is ~30m high.
They say that the webcams will continue during the federal shutdown and alert level will remain on watch (but who continues to actually watch during shutdown?). Has the state of Hawaii enough ressources to substitute a longterm failure of the federal budgeting system?
Here they write more about the impact of the shutdown on Big Island and volcano observation: https://bigislandnow.com/2025/10/01/how-does-the-federal-government-shutdown-affect-hawai%ca%bbi-and-hawai%ca%bbi-volcanoes-national-park/
– HVO will continue to maintain its 24/7 monitoring networks across Hawai‘i Island
– the observatory’s website content will not be updated until further notice
– Scientists will continue to track seismic activity, gas emissions, and ground deformation to ensure timely updates on volcanic hazards
Snaefellsnes has had two M3.2, one M3.4 and one M3.5 today.
Still very deep though, although there’s a fifth one at M3.1 which is shallow. Not checked yet but.
It’s a long way to the top from down there if you want to rock and roll.
It’s registered at exactly the same time as the verified M3.5, so I assume they are the same and that they just missed to remove the unverified one from the list.
… and Grimsfall has recently moved significantly north and up to levels of January 2025. https://brunnur.vedur.is/gps/grimsvotn.html
A study on mantle rock: https://www.science.org/doi/10.1126/science.adp1058
“serpentinized peridotites and associated gabbros”
Did during Hadean Age exist a period of “magma earth”, when all the surface was hot and liquid like a global lava ocean?
Strikes me as unlikely unless there was a significant atmosphere.
The radiative heat loss is significant.
deg C MW/m^2
1000 0.15
1200 0.27
1400 0.44
1600 0.70
1800 1.05
2000 1.51
However, something akin to a crusted lava lake could form.
I expect Albert could comment on the Coriolis forces that would be involved across a ball of rotating liquid rock, but “destructive” springs to mind.
Tides would also be interesting….
During very large protoplanet mergers with the young Earth ( impactors the size of the moon or more ) the energy released is phenomenal, you gets a for a long time 6000 c rock vapor atmosphere around the entire planet for 1000 s of years after souch an event more than enough to heat melt Earths surface into a global magma ocean. Well Earths differentiaton itself means that the planet must have been mostly completely molten, with all iron sinking towards the core center and the ligther sillicate slag floating on top that become the mantle
I doubt that, space is VERY cold.
Perhaps if you orbit VERY close to the star, but then the tidal forces on a liquid planet may not be conducive to long term survival.
There is a very great difference between a cooler surface skin and a molten surface. We have seen plenty of those here over the years.
PS Here I am talking molten rock circa 1800K, not water circa 300K (!),
Were it mainly the protoplanet impacts that caused the magma earth? The largest and most destructive event was the creation of the Moon by a crash between proto-earth and a minor planet.
6000°C of surface temperatur comes close to the Sun’s surface, and it would be incredibly bright. Imagine an enlighted double planet system of Earth and Moon with hot liquid surfaces at the same time.
The bulk can stay at elevated temperatures for a VERY long time.
Probably millions or many tens of millions of years.
However the heat flux for very high SURFACE temperatures will cool the surface very rapidly as we see in eruptions, where lava very rapidly gets a surface crust due surface cooling. OK the crust will slide under due to higher density but another crust quickly forms. At megawatts (or even tens of megawatts) of surface heat loss, cooling would be rather rapid if it was stirred so as to have mostly free surface radiation.
One could work that scenario out fairly easily, but its Friday night!
You would expect the surface layer to solidify very quickly, while the magma below remains liquid. In effect, that is what the Earth’s core is still doing. But the solid layer is not strong and constantly breaks and convects, so it is not as effective as might be expected.
The cooling is not just the thermal radiation: convection in the atmosphere will also carry away significant heat. However, the atmosphere at this time is also very hot so it also slows down heating from the surface. At least half the depth of the mantle would have melted in the moon-forming impact.
Cooling of the mantle is fairly rapid: the mantle cools by 1000K in 100,000 years. So say 1 million years to become largely solid again.
We think that the Earth remained liquid while the moon had already formed. This is because the lunar crust is thinner on the side facing the Earth than on the other side. The plausible explanation is that the side facing use was being heated by ‘earthshine’: radiated by hot Earth.
I’m also thinking about whether such a hot planet would look in fact like Venus with a thick cloud around it. The earth contains many gasses and chemical compounds that would condense or sublime in the atmosphere.
A different aspect is that a crash between two planets (f.e. Earth and a small Mars) would disrupt the chemical-physical composition of the original planet to something new. The new, post-impact planet has to cope with this new composition, because it will have a different balance and physical behaviour of the mixture than the pre-impact planet. Heavy things have to go down, light things have to come up. This planetary differentiating process would probably continue for a while, until the planet finds its individual longterm physical laws.
Very many decades ago a physics “A” level question (probably “S”, now I think about it) asked for an expression for molecular loss in a gravitational field at given temperature and pressure. That gave atmospheric half lives and I am sure Albert could put the expression here. In essence, light hot molecules leave rapidly (eg hydrogen) and big heavy ones take geological times, depending on gravity and temperature.
So hot (due to intrinsic heat) planetary atmospheres tend to lose their atmosphere rather quickly.
Just to hold Jesper back a bit, here I am talking about a hot planet far from a heat source (eg earth) not some exoplanet orbiting insanely close to a sun where the energy is external.
So I would expect atmospheres to quite rapidly depart from a hot earth, although much might remain in earth orbit for later.
I can think of many other reasons for the moon crustal distribution and heating from earth isn’t the most plausible, TBH.
Yes, I can write down the equations but it is not a simple problem. It doesn’t work in dense atmospheres where the mean free path of a molecule is much too small to escape, even if it did have escape velocity. Earth lost its hydrogen in this way, from the 900-K thermosphere in the upper atmosphere. The Moon has no atmosphere for the same reason. Titan, similar to the Moon, does because it it so much colder.
‘Earthshine’ would be more effective than you give it credit for. After the impact the Earth was as hot as the Sun. From the Moon, it covers a 16 times larger area on the sky than the Sun, and so the Moon received 16 times as much energy from the Earth as from the Sun. As you pointed out, the Earth quickly cooled down but in the phase where the Moon solidified its crust, Earthshine would have been enough to make a difference. It is the easiest explanation for the difference between the two sides of the Moon. Our side has the lunar marias, and the other side does not, precisely because the crust was thinner and more easily pierced by large impacts.
The heat is caused by the kinetic energy.. of the impact theia impact made a wast rock vapor nebula with a very hot dense interior titanic impacts .. so violent that they vaporize entire protoplanets..
https://m.youtube.com/watch?v=PENT_hnyO-o&pp=ygUObWlyYWNsZSBwbGFuZXTSBwkJ-wkBhyohjO8%3D
How hot does an impact like that get? I’d estimate that it does extreme degrees like the interior of the sun or a nuke explosion. It can make rock vapor. So completely different to ordinary temperatures in a planet’s life.
Impact point at 30 km per second maybe 20 000 c or more its extreme forces .. the whole planet woud shine like star after a day of the mega impact the glowing hot rock vapor engulfs most of the the planet in a few minutes
Giant impacts creates alot of heat .. and can form hot dense “rock vapor photosphere atmospheres ” around a planet until it radiate and cools its forces beyond any imagination really
The entire atmosphere heated to 10 000 c during a mega impact and maybe under a few 100 s of bars of hot rock vapor pressure will take a few 1000 s of years to completey cool down and condense
In the end Io is the most fun.. Its been my favorite ball since 10 years old I plann to make more VC articles on Io later as good deep information on Io are quite scarce on the internet otherwise than wikipedia and some public Nasa articles
https://www.volcanocafe.org/a-quick-tour-of-volcanism-on-io/
How about a tour on Ionian basalt eruption styles? one of my most fun articles ever.. and well needed only one on internet for now otherwise than wikipedia that gives an overview
Kronotsky reportedly had en eruption.
Can’t see anything on the satellite but then today’s images haven’t been uploaded yet.
Nothing yesterday evening.
Still a small south-east drifting plume from Krashenninikov.
How can we estimate in theory the steps of Ljósufjöll’s path from sleep to eruption?
Fagradalsfjall 2021 was an example for a long dormant volcanic system that erupted after many millenia. Ljósufjöll was active during last RVZ cycle thousand years ago, so it erupted more often than Fagradalsfjall during last 2000 years.
Fagradalsfjall sits on the very active Reykjanes Peninsula (MAR path), while Ljósufjöll is on the more (re)tired Snaesfjellsnes peninsula. Historical lava deposits show, that eruptions of Ljósufjöll are close to Fagradalsfjall’s 2021 volume.
The first visible step that has been reached by Ljósufjöll, are occasional deep earthquake swarms. This sign is similar to Fagradalsfjall’s 2019-2021 signs, but the earthquake swarms of Ljósufjöll have been mild until now compared to Fagradalsfjall.
The two systems may not be entirely unrelated. The Reykjanes system feeds shallow dikes that reach a few kilometres and which fed the eruptions since 2021. But they also have very much deeper dikes which can extend for 50 km north (only north) and which do not reach the surface. Snaefellsnes could in principle have been triggered by such a dike.
Just a question but is there actually any evidence of this? The evidence that seems to actually exist is that the rifting is shallow and related to the eruptions, rifted terrain and grabens go beyond Reykjavik at least to Ellidavatn but maybe as far as Mosfellsbær, even maybe to the base of Esjan. The slight elevation gain might make it impossible for Kryrsuvik to erupt further north than Burfell. Or at least it has not done that yet, although the current Sundhnjukur eruptions have gone into areas not reached before so its not a given.
Maybe tension fractures form that fill with mantle material but idk if that should count as a dike, unless it is clearly liquid magma and/or actually erupts.
Even in that its still twice that far to Snaefellsness and the tension orientation is at a right angle to the Reykjanes rifting anyway. As yet we dont know how Ljosufjoll erupts but it does seem to have limited rifting and forms fissures lengthways along the axis, although short enough many are buried by later cones forming. Magma is building but not at the stage of forming a dike yet so it being a point source now is circumstantial really.
If I had to guess, Snaefellsness is a fracture zone that exists because of Iceland having two active plate boundaries. The fracture zone goes from Bardarbunga to Hofsjokull, Langjokull, then down Snaefellsness. It might also go east through Grimsvotn and Oraefajokull but that could be coincidental alignment there. The part Langjokull-Hofsjokull-Bardarbunga could be a weak transform fault. Just my theory but these fracture zones are iconic visuals of the MOR, and Snaefellsness is exactly where one would be expected if the north bundary of the Hreppar microplate is actually real.
It is a suggestion. The evidence for the deep long dikes comes from the hydrothermal activity northeast of Reykjanes. See https://www.sciencedirect.com/science/article/pii/S0377027317305474, Figure 4