Lights of the North! As in eons ago,
Not in vain from your home do ye over us glow!
William Ross Wallace (1819–1881)

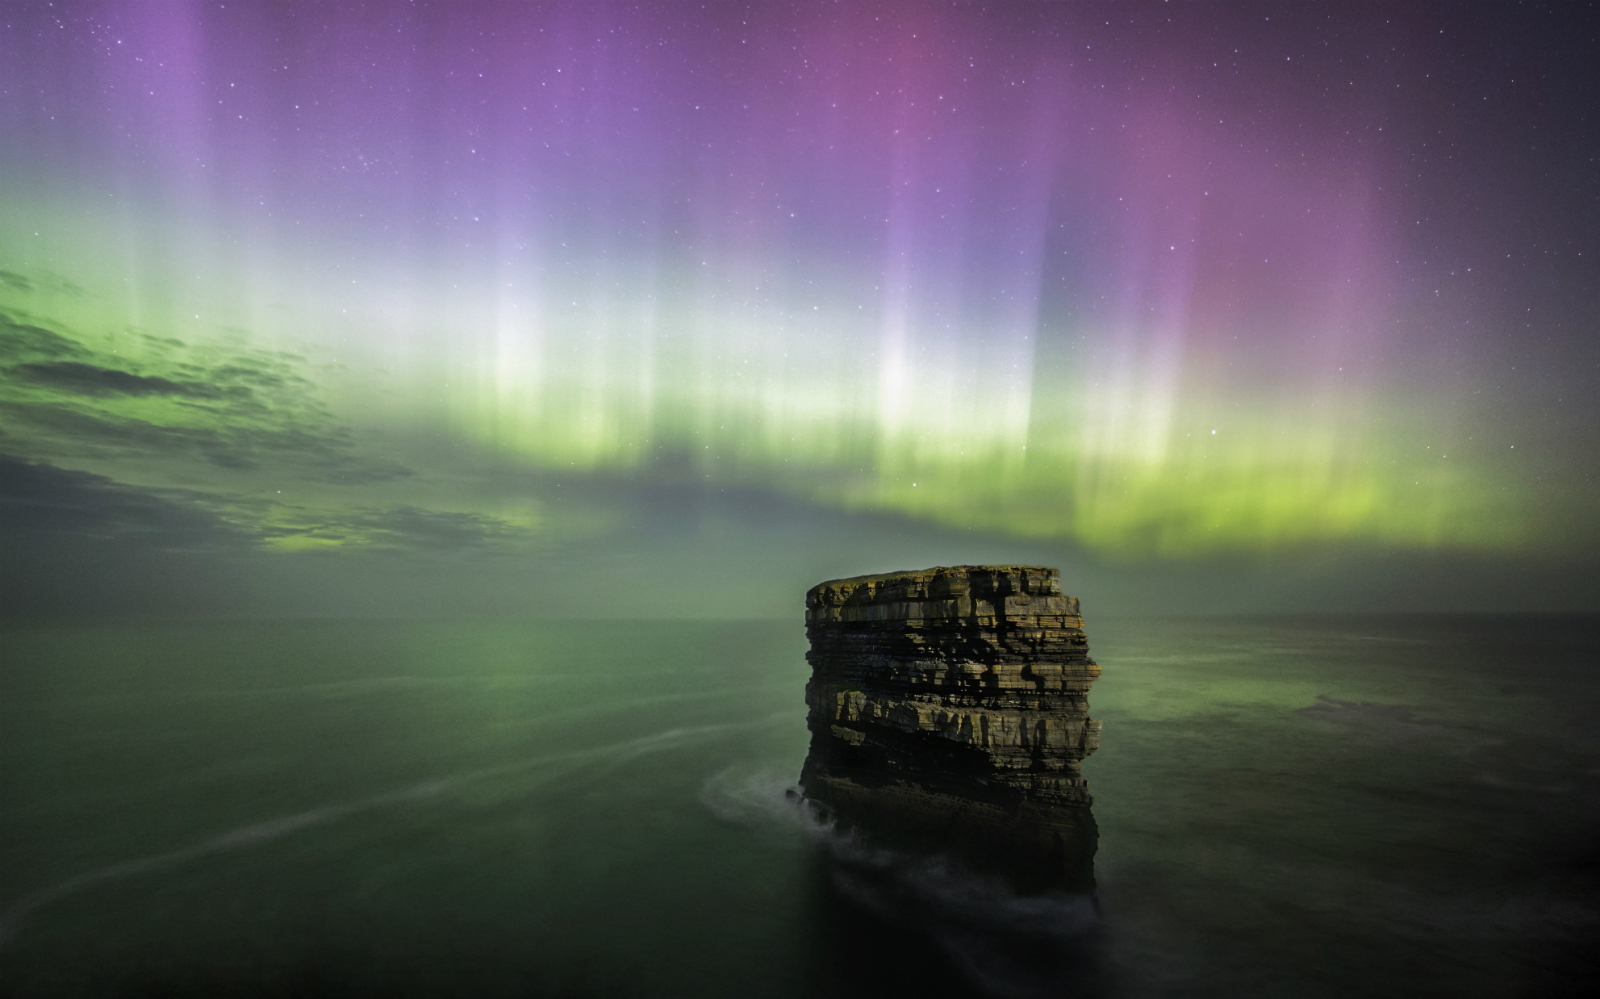
Aurora over the Snæfellsnes Peninsula in Iceland
A repost from 2018 with minor updates
Jan 25, 880 AD, was a remarkable night. The Arabian historian Ibn Abi Zar wrote about it more than 400 years later, from the ancient city of Fez, northeast of the Atlas mountains:
It was a great red splendour in the sky, from the beginning of the night to the end. An equal thing was never known before. It happened the night of the Saturday 19 of safar of the cited year [25 January 880].
African aurora was very rare. Ibn Hayyan described a later event seen in Iberia, where it is a little more common:
Toward the end of the night of the Thursday [27 April 942] a reddish colour as fire in the sky, from which a lot of rays that were reflected on the branches of the palm trees and on the top of the palaces emerged, appeared in the horizon. People thought that it was the daybreak light when Sun rises until the red colour became lost with the arrival of the morning and disappeared with the clarity of the day. It appeared from the Occident.

The oldest depiction of aurora, in a Cro Magnon cave painting.
We have lost the magnificence of the night sky. From cities we can hardly see the brightest stars, and even in dark places 100 kilometers from any city, their lights reflected of the clouds above them can be seen, brightening the sky. Real dark skies have all but disappeared. Aurora would have been a powerful experience in the years before artificial light, the dancing, eery lights which soundlessly move across the sky, illuminating the landscape in ghostly red and green.
The oldest description of aurora seems to predate writing. It may be depicted in 30,000-year-old Cro Magnon cave paintings, some of which have strange swirling patterns called macaronis. The best example is in the ceiling of the cave of Rouffignac in France. It looks like aurora – but whether that is what it is is disputed. With artists, you can never really tell.
Much later came the written descriptions. The oldest generally accepted as an ancient description of aurora is from the book of Ezekiel, dated to 593 BC: …a stormy wind blew from the north, a great cloud with light around it, a fire from which flashes of lightning darted […] the fire flashed light, and lightning streaked from the fire […] a light all around like a bow in the clouds on rainy days…
The Greek philosopher Xenophanes mentioned “moving accumulations of burning clouds“. He lived at approximately the same time as Ezekiel, and in view of the rarity of bright aurorae this far south, it may well have been the same event. There are some 50 accepted descriptions of aurora from before the (non-existing) year zero, including one from 567 BC listed in Babylonian tablets. The event of 112 BC was remembered by Pliny the Elder: We sometimes see, them which there is no presage of woe more calamitous to the human race, a flame in the sky, which seems to descend to the earth on showers of blood; as happened in the third year of the 107th Olympiad, when Philip was endeavouring to subjugate Greece. Other particularly bright auroras happened in the Mediterranean in 349 BC and around 460 BC. Not everyone was lucky. Much later, Edmund Halley was “dying to see the aurora and expecting to die without seeing it.” He had to wait for many decades before he finally saw the great aurora of 17 March, 1716, which blazed across the sky from America to Russia.
The spectacle of the aurora borealis (northern lights) or the aurora australis (southern lights – also used outside of Australia) can be mesmerizing, even hypnotic, draping the land in an unearthly colour. The light forms arcs, bands, rays, patches or veils; it is a dance of red and green, where curtains move, jump and wave across the sky, pulsing in brightness.

The percentage of nights when aurora can be seen. It is highest in a ring around the magnetic pole. Note that few of these auroras will be bright. To see a faint aurora requires a clear, moonless night far away from any artificial lights. In the UK, the best sites are the Dark Sky Parks, preferably in the north.
If you want to see aurora, pick a week around new moon, preferably autumn or winter when the nights are darkest, and travel to somewhere 15-20 degrees from the magnetic pole. The best auroras tend to be around midnight, with the sun is on the other side of the magnetic pole. Do give yourself time as not every night is clear! North Alaska is great, and Iceland has some good spectacles, with the added attraction of the occasional volcanic eruption to add fire to the glory. And if you would like to see the aurora australis, the southern tip of New Zealand may be your best bet. Avoid Mexico: it is almost never seen there. Similarly, Spain would not be an obvious choice as a visible aurora happens perhaps once a decade. Seeing a bright aurora in Morocco is unheard of. The African event described at the start of the post is most unusual indeed.
Aurora happens high in the atmosphere. Highly energetic particles from the Sun get captured in the Earth’s magnetic field, spiral around the field lines and enter the atmosphere where the field line bend towards the magnetic pole of the Earth. The high energy particles collide with the whispers of air 100 kilometer above the ground, and cause them to give light: oxygen glows green or red, nitrogen shines blue. Each colour occurs at its own height. Red oxygen (a wavelength of 630 nm) is seen high up. Green (557 nm) is lower, down to 100 km height. If red and green occur together, the eye picks up a pink glow. Blue light from nitrogen is the lowest layer. The layers terminate suddenly at a specific altitude: this sharp lower edge is clearly visible especially from space.

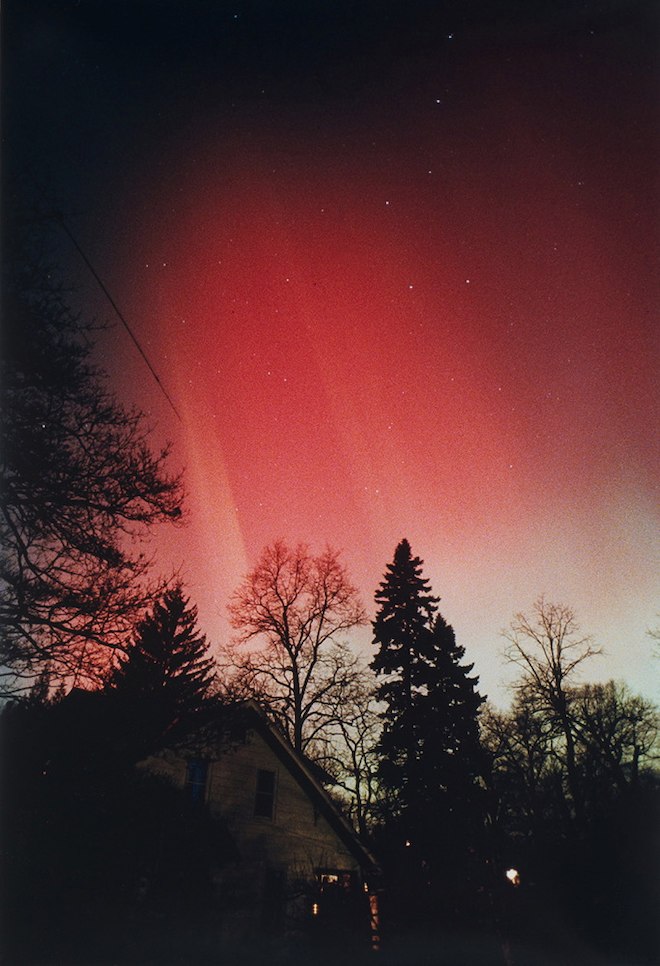
The lights form a fiery circle around the pole. There is surprisingly little aurora directly above the magnetic pole itself: the auroras encircle it 10 to 20 degrees away. A place like Churchill, Canada has aurora every clear night. To the south it becomes rarer. It takes more energetic particles for the aurora to reach say New York (and a lot more energy still to get through the city lights). Further south, a bright aurora may become a once-in-a-lifetime event. Far from the pole the auroras that do occur are normally red, and they lack the crispness of the polar lights. Even so, they are impressive. The brightest I have seen it myself was one of those rare southern reaches, and it veiled half the sky in bright red as if the sky was reflecting a distant fire – which at first I thought it was.

Were you ever out in the Great Alone, when the moon was awful clear,
And the icy mountains hemmed you in with a silence you most could hear;
With only the howl of a timber wolf, and you camped there in the cold,
A half-dead thing in a stark, dead world, clean mad for the muck called gold;
While high overhead, green, yellow and red, the North Lights swept in bars?
— Then you’ve a hunch what the music meant… hunger and night and the stars.
(The Shooting of Dan McGrew)
Blame the Sun
The particles that cause the aurora come from the Sun. Local patches on the surface of the Sun get a strong magnetic field. Two different field lines can pass close to each other, and sometimes they connect. Such a magnetic reconnection is like breaking a taut guitar string. The tension is released and the two sides of the string whip away at high speed. In the Sun, the sudden release of magnetic stress accelerates the local gas, and it flies off in a flare. High energy, charged particles begin to stream away. A large flare can produce X-rays, gamma rays, and high energy protons.
Many miss us, but sometimes the flare heads directly for Earth. It takes the particles a day or so to reach us. Flares come in all kinds of sizes. The stronger the flare, the brighter and further south the aurora. Some warrant the name ‘solar storm’. And if storms are possible, how about hurricanes? A solar hurricane could be scary indeed!
Flare sizes
Solar flares are assigned a size in a way that is a bit like the Richter scale for earthquakes. They are ordered alphabetically, as A, B, C, M and X, where each class is ten times more energetic than the previous one. A to C are too small to affect us. M-class can cause radio outages. X-class is more like it. Each class is subdivided by assigning a number from 1 to 9. The problem with this scale quickly became apparent: flares were seen that were more powerful than X9. So the numbering was extended for X-class flares only. The strongest one on record was the Halloween solar storm of 2003: it was measured at X28, 500 times stronger than an X1. But this was an underestimate: the detectors saturated at this level. Modeling suggests it may have as strong as X35. (Even X48 is reported.) It mostly missed Earth, luckily. And there is no reason to assume that this is the strongest event that could ever happen. In fact, a bigger one had been seen almost 150 years earlier.
The Carrington event
The solar cycle number 10 had started in 1855. It was about average in strength, as measured in sun spot numbers. Of the cycles that have happened since, 7 were weaker than cycle 10, and 7 were stronger.
During August 1859, a huge sun spot came into view on the Sun. It was at mid northern latitudes on the Sun, and dominated the solar disk. There was a smaller spot in the southern solar hemisphere, but otherwise the surface had been clear. The new spot spread out over a 6th of the width of the Sun. At the start of September, it erupted.

The sunspot of August 1859. Drawing from Carrington, RAS archives.
Richard Hodgson in Highgate, London, a retired publisher and amateur scientist, saw the flare and later wrote
While observing a group of solar spots on the 1st September, I was suddenly surprised at the appearance of a very brilliant star of light, much brighter than the sun’s surface. [..] most dazzling to the protected eye, illuminating the upper edges of the adjacent spots and streaks, not unlike in effect the edging of the clouds at sunset.
The event was described in more detail by Richard Carrington, who later had the event named after him. He worked at his observatory in Reigate, south of London, and wrote The image of the sun’s disk was, as usual with me, projected on to a plate of glass coated with distemper of a pale straw colour, and at a distance and under a power which presented a picture of about 11 inches diameter. I had secured diagrams of all the groups and detached spots, and was engaged at the time in counting from a chronometer and recording the contacts of the spots with the cross-wires used in the observation, when within the area of the great north group (the size of which had previously excited general remark), two patches of intensely bright and white light broke out, in the positions indicated in the appended diagram by the letters A and B, and of the forms of the spaces left white. My first impression was that by some chance a ray of light had penetrated a hole in the screen attached to the object-glass, for the brilliancy was fully equal to that of direct sun-light.
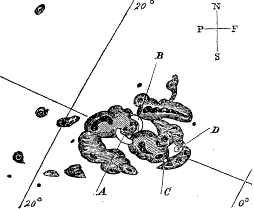
Seeing the outburst to be very rapidly on the increase, and being somewhat flurried by the surprise, I hastily ran to call some one to witness the exhibition with me, and on returning within 60 seconds, was mortified find that it was already much changed and enfeebled. Very shortly afterwards the last trace was gone, and although I maintained a strict watch for nearly an hour, no recurrence took place. The last, traces were at C and D, the patches having travelled considerably from their first position and vanishing as two rapidly fading dots of white light.
What his paper didn’t say is that he didn’t look for a repeat of the event. According to his note book, he was ‘too busy cutting trees’!
What Hodgson and Carrington had seen was a so-called white-light flare, a relatively rare event that can happen a few times per year around solar maximum. This was the very first ever recorded. But this was more than just such a flare, and what they saw was only the beginning. Almost at the same time, the magnetic instruments at Kew recorded a disturbance. This was caused by the radiation from the flare which ionized the upper atmosphere. The magnetometer quickly returned to its previous position. But 17.6 hours later, the disturbance came back and this time the instrument went off the scale. The geomagnetic hurricane had arrived. This was caused by the arrival of the charged particles ejected by the flare, but made stronger and faster because the earlier ionization had already set up a current in the ionosphere.
The disturbance reached a level of 110nT in London. The observers did not fully appreciate how unusual this was. Nothing stronger was seen at this latitude until the super flare of 28 February 1942 when the force reached 112nT. The Halloween flare of 2003 reached 114nT. But in both these cases, this was the maximum seen over a range of stations across the globe: in a Sun storm, the measured strength of the magnetic disturbance can vary dramatically from location to location. The 1859 data is based on a single location only. It is very likely that if more locations had been available, much higher strengths would have been measured.

Storms of light
The Carrington event refers to the solar storm of Sept 1 to 5, 1859. But there were in fact two storms in short succession. The first one started about 2300 UT on Sunday, August 28, intense but short-lived. The second one began on September 2 about 0500 UT, and lasted for three days. The white flare seen from London was the start of the second storm, but both had come from the same sun spot. And both storms were accompanied by worldwide auroras which reached as far as Honolulu, and reached to 18 degrees from the magnetic equator. This is not entirely unique: in later years the aurora on 4 February 1872 was even more widespread. But nothing like it had been seen in living memory.
The first aurora began on Sunday, Aug 28; it was seen from the Mediterranean to the Gulf of Mexico. The aurora re-appeared late on September 1 (September 2 in Europe), brighter and even more widespread. There are hundreds of reports and descriptions, some describing in detail how the spectacle changed from minute to minute. Picking just a few example, the Indianapolis Journal wrote: ‘It was far more brilliant than the one of Sunday night, and it certainly was much more luminous, though less marked by the darting rays and wonderful pulsations that made the first so splendid.’ John Cambell, also in Indianapolis wrote: At 3h 45m A.M. Magnificent corona in the zenith. Central portion spiral, red and white, changing instantly to a beautiful rose color, with spiral streams shooting forth into all parts of the heavens; the most brilliant streams flowing east and west.
Further south, the aurora was celebrated differently. “The influence of the Aurora Borealis has been felt in the Garden District. We see in the police reports, this morning, that several denizens of that delightful spot have been found drunk – many under a strange delusion, having taken the gutter for their own comfortable beds’’ (The New Orleans Daily Picayune, Wednesday, September 7, 1859).
The Physio-Meteorological Observatory at Havana approached it in a more scientifically detached manner: White rays with red and blue were then seen towards the west, which dilated longitudinally, oscillated laterally, were extinguished and resumed their brilliancy again by turns. […] At 2h the Aurora had attained its highest magnificence. The heavens then appeared stained with blood and in a state of complete conflagration. Havana also had aurora on Aug 28, and the Observatory commented how rare such a double event was: between 1784 to 1859, aurora had been seen from Havana a total of six times; two of these were the double storm of 1859.
A little further south, Kingston, Jamaica, reported: It appeared as if there was a colossal fire on earth which reflected its flames on the heavens. The whole island was illuminated. It looked as if Cuba was on fire, and many believe that a portion of this island had been destroyed by a conflagration. Other persons were of opinion that the light was that of an aurora, but the aurora has never before been seen in this latitude.
London and Brighton both reported a vividly white aurora. In Prague and Rome too the aurora was predominantly white. This is notable, given how colourful the light was in America. The aurora at Sept 1/2 also reached Hawaii. In Australia, the aurora australis was seen as far north as Brisbane.
Telegraph
The aurora was impressive, memorable, and perhaps frightening to those unfamiliar with it. But the sky light could not do anyone harm. There were other effects from the Sun storm which had a more direct impact, caused by the technological revolution that was going on: the rapid adoption of telegraphy.
The idea for the telegraph originated in the 1830’s, and the first telegraph was send in 1844. It was based on the discovery by Oersted that an electric current could change the direction of a magnetic needle, and on the development of the electric battery by Volta. The system was based on needles pointing at a display of letters and numbers. A push of the button closed the circuit with the battery, an electric current would move the needle, and words could be spelled out by varying the current. A person called Morse had been involved (obviously). By 1859, telegraph wires spread between al major cities. The first transcontinental wire came into service in 1861.
The telegraph used long wires, and these could pick up induction currents. During the 1859 storms, this is exactly what happened: the rapidly changing magnetic field put too much current on the lines, and the needles were moving too much to read any message. Many connections became impossible. Or worse: in Gothenburg, the telegraphist got an electric shock when disconnecting the earth. He came off lightly compared to some others. In Norway, the wires discharged sparks in the telegraph office, setting pieces of paper on fire. A telegraph operator at Baltimore even reported that The intensity of the spark at the instant of breaking the circuit was such as to set on fire the wood work of the switch board. Bright sparks were also noticed in Bordeaux and Toulouse.
Some telegraph lines did better than others. As one report states: On Friday, September 2nd, 1859, upon commencing business at 8 o’clock A.M. it was found that all the wires running out of the office were so strongly affected by the auroral current as to prevent any business being done, except with great difficulty. At this juncture it was suggested that the batteries should be cut off, and the wires simply connected with the earth. The Boston operator accordingly asked the Portland operator to cut off his battery and try to work with the auroral current alone. The Portland opera- tor replied, ‘‘I have done so. Will you do the same?’’ Boston operator answered, ‘‘I have cut my battery off and connected the line with the earth. We are working with the current from the Aurora Borealis alone. How do you receive my writing?’’ ‘‘Very well indeed,’’ rejoined the Port- land operator; ‘‘much better than with the batteries on. There is much less variation in the current, and the magnets work steadier. Suppose we continue to work, so until the Aurora subsides?’’ ‘‘Agreed,’’ said the Boston operator.
This is still the only reported case of Solar storms being used for renewable energy!
The cause of aurora
Aurora were still a mystery in 1859, and after the storm, a variety of explanations appeared in print. The Scientific American, not entirely justifying its name, proposed that it was caused by falling matter from erupting volcanoes. (The editors should have read VC.) The San Francisco Herald perhaps came closer, describing it as Nebulous matter . . . known to exist in planetary spaces’’ similar to meteors falling into the atmosphere. The New York Herald went for the least likely explanation and attributed it to to reflected light from icebergs or polar lights.
But the truth became clear once the full story appeared. The magnetic disturbance and the induced current in the telegraph lines showed that it had to be electric currents, high in the atmosphere. The alignment of the streamers with the earth magnetic field showed that the current followed these field lines, entering the atmosphere where those lines dipped down towards the poles. It clearly came from space. And the observations of Carrington showed that the cause was in the Sun. Nowadays, it is called space weather.
The uniqueness of the Carrington event
So how strong and how unique was the Carrington event? There have been many Sun storms since, a few of which caused auroras and electromagnetic disturbances. Several auroras have come even closer to the magnetic equator than in 1859. Magnetic disturbances have occurred, and although it seems that the 1859 event has not been paralleled, some came close. There have also been larger Sun spots, although not many.
Storms can be ranked on different aspects: the geomagnetic disturbance, the aurora strength, sun spot size, sudden ionospheric change. On each aspect, there have since been solar storms as strong as the 1859 event. For instance, a ‘white light flare’ has been 5 times in the 19th century. But 1859 is the only one that was among the top few on every aspect. Putting the numbers together, it seems that the energy in the flare was twice as large as any flare since. It is estimated as between X40 and X50. An event like may perhaps happen only twice per millennium. However, the real strength of the event is still being discussed. It is also important to note that solar flares cannot really be described by a single number: it depends on energy, hardness of the radiation, proton flux, and direction of the embedded magnetic field. Flares with the same classification can be quite different in their impact.
One aspect of this is that if the radiation is very hard (more energy per particle), it can induce radioactivity in the atmosphere. Such events can produce the isotopes 14C and 10Be, and this ends up as a signature in tree rings. There are three such spikes known from the tree record, dated to 660 BC, 774 AD, and 994 AD. The Carrington event did not do this. These three events are probably about as energetic as the Carrington event but more of the energy came out as X-rays. The event in 880 AD produced extreme auroras but no radioactivity. The Halloween flares of 2003 reached similar energy, caused satellite outages (an expensive Japanese Earth observation satellite was beyond repair due to damage to the solar panels) and did some damage to the electricity network in Africa. Different flares of similar energy can have very different effects on Earth.
This leaves the question what made the Carrington event extreme? The solar cycle of the time was not particularly strong, but it now seems that strong storms can happen during any cycle. But in 1859 there were two solar storms in short succession. That is unusual, and it may be part of the reason for the strength of the second storm. If a fast mass ejection meets a slower one and sweeps it up, the interaction between the two can amplify the resulting shock. The first storm was strong but not too exceptional. The second one went off the scale.
Our modern world
Our technology has developed quite a bit since 1859. In some ways we are better placed. Telegraph cables have become optical fibres, and these are safe from solar interference. But new risk factors have appeared. We depend on satellites and on power lines which both are open to the effects of solar storms. This became apparent during the solar storm of 1989, when an X10 (or so) flare caused an electric storm that affected the power lines of Hydro-Quebec. Quebec is at high magnetic latitude, and the very long power lines were perfectly placed to pick up the induction current. Large currents began to flow through the grounding points, causing the circuit breakers to flip. Within 90 seconds, the lines linking the hydro-electric dams in the north to the cities of the south were cut. It left much of Quebec without power for nine hours: restarting a complex power grid is not easy. This was a large but not an extreme storm. So what could a repeat of the Carrington really do? How resilient are we?
Aurora during the 1989 solar storm
The first effects would be on satellites. These are right in the firing line, with little protection. Communications would be disrupted by surface charge building up on the satellites. In a bad storm, such charge could leak in and damage the electronics. A study in 2005 estimated that we could lose 10% of the satellites, ranging from low-earth orbit to geostationary ones. Many of the GPS satellites could fail – and repair crews are not readily available. The study estimated the total cost to replace the satellites at 50 billion dollar, while the companies providing commercial satellites could face losses of the order of 30 billion dollar. There would also be heating of the outer atmosphere, and over several years satellites in low-earth orbits would be slowly pulled down by the expanding air. Even the International Space Station could be at risk, and would require an altitude boost. The Starlink satellites could be affected, although for me (as astronomer) that would not be a great loss.
Radio communications are badly affected, especially those using high frequencies. Mobile phone connections becomes difficult. GPS signals from the satellites give high timing errors: GPS positioning becomes unreliable and intermittent. Compass-based systems fare better but could still mis-point by several degrees. Inertial systems would be unaffected. Airplanes at high latitudes suffer from the communication problems (they would also be subject to significant radiation doses). During the 2003 Halloween storm, planes had to be re-routed further south. During that event, the FAA could not provide GPS navigational guidance for approximately 30 hours.
How about our power lines? Here lies the biggest risk. Quebec was actually a fairly mild case, where the circuit breakers prevented real damage. Since that time, capacitors have been installed on the lines to prevent a re-occurence. But a much larger Carrington event could still overload the grid, causing severe voltage regulation problems and, potentially, widespread power outages. Worse, the currents can cause internal heating in extra-high-voltage transformers, causing failure or permanent damage. The 1989 storm damaged two such transformers in the UK and the 2003 storm did so in South Africa. The manufacture of transformers can take many months, and if many are damaged, replacement could take the best part of a year. Modeling of an extreme storm suggested that 130 million people in the US could lose power, and that 350 transformers could be badly damaged. The worst affected regions would be Scandinavia, the UK, the Pacific Northwest, and the Northeast region including Quebec, New York, and New England, with power outages of weeks to months and an economic cost of 1 trillion dollars. This is a very unlikely scenario, and it assumes that there has been no real preparation. But that is what risk analysis is for: to make sure it doesn’t happen like that.
The dark side of the Sun
The storm of 1989 became a wake-up call, after decades of a quiet sun. It was only minor compared to the Carrington event. But we don’t know enough about the Carrington event to really know what happened. Neither do we know what is the worst the Sun can throw at us. That beautiful aurora has a dark side.
Albert Zijlstra, October 2018


Thanks Albert I’ll have to have a read later.
https://qz.com/massive-sunspot-linked-carrington-solar-storm-1859-1851467671
https://www.livescience.com/space/the-sun/gargantuan-sunspot-that-spit-out-the-strongest-solar-flare-in-6-years-is-now-pointing-almost-directly-at-earth
Looks like the sun is getting very busy indeed now .. The energy of this is simply phenomenal .. billions, billions, billions of hydrogen bombs at once in one solar flare, basicaly chicxulub sized explosions are frequent almost daily stuff on the sun, now one sunspot is growing larger than Jupiter
Good piece of work Albert, with the current sunspot group AR3664 (comparable in size to the Carrington group) there is a higher chance of stronger X class solar flares. Hopefully not much higher than it has emitted so far.
And to celebrate Albert’s post
https://www.solarham.com/
:Product: Forecast Discussion
:Issued: 2024 May 10 1230 UTC
# Prepared by the U.S. Dept. of Commerce, NOAA, Space Weather Prediction Center
#
Solar Activity
.24 hr Summary…
Solar activity was at high levels. The notably large Region 3664
(S17E41, Fkc/beta-gamma-delta) produced the vast majority of X-ray
activity this period. The most significant were an X1.1/2b flare
(R3/Strong) at 09/1744 UTC and an X3.9 flare (R3) at 10/0631 UTC.
Strong radio bursts, Castelli-U signatures as well as Type II and IV
radio sweeps and Tenflares were associated with both flares. Both events
produced halo CME signatures that are expected to contribute to a train
of at least five CMEs that inbound to Earth, with initial arrival likely
from late on 10 May to early on 11 May. The number of events along the
Sun-Earth line complicates the modeling process and has increased
uncertainty of arrival timing of any individual event.
The other numbered spotted regions on the visible disk were relatively
quiet and stable.
.Forecast…
Solar activity is expected to persist at high to very high levels over
10-12 May, with M-class flares (R1-R2/Minor-Moderate) to X-class flares
(R3/Strong) expected, due primarily to the flare potential of Region
3664.
Energetic Particle
.24 hr Summary…
The greater than 10 MeV proton flux remained slightly enhanced following
strong flare activity from Region 3664 but below the S1 (Minor)
threshold. The greater than 2 MeV electron flux was at normal to
moderate levels.
.Forecast…
The greater than 10 MeV proton flux is likely to reach S1 (Minor) storm
levels over 10-12 May due to the location and flare potential of Region
3664. The greater than 2 MeV electron flux is expected to be at normal
to moderate levels over 10-12 May.
Solar Wind
.24 hr Summary…
Nominal solar wind conditions prevailed throughout much of the period
with a minor perturbation observed in the magnetic field after 09/1730
UTC. Solar wind speeds decreased from initial readings near 450 km/s to
between 400-425 km/, total field strength ranged 1-7 nT, and the Bz
component varied +3/-6 nT. The phi angle transitioned from positive to
variable after 10/0300 UTC.
.Forecast…
A weakly enhanced solar wind environment associated with CME activity is
expected through most of 10 May. A stronger disturbances are expected in
over 11 May through much of 12 May due to the anticipated arrival of a
series of halo CMEs associated with activity from Region 3664 over 08-10
May.
Geospace
.24 hr Summary…
The geomagnetic field was quiet to unsettled.
.Forecast…
Periods of active conditions and G1 (Minor) storming are likely on 10
May with the possible early arrival of a series of CMEs (from 08-10
May). The bulk of the incoming CME(s) is expected to arrive early on 11
May with periods of G1-G2 (Minor-Moderate) geomagnetic storming
expected, and periods of G3-G4 (Strong-Severe) storms likely. Periods of
G1-G2 (Minor-Moderate) storms are likely on 12 May due to an enhanced
solar wind environment following the passage of the 08-10 May CMEs.
There were some recent articles on the UK National Grid website saying that even with a Carrington level event the UK electricity grid would likely only sustain minor damage roughly equivalent to a bad storm. Unfortunately they are now 404 not found. I see their author Andrew Richards no longer works at National Grid.
That’s how Sun eruptions have an impact on earth … over a very large distance (150 mio kilometers). Would an event like the Carrington one be sensible for humans f.e. by heat, light or higher risk for a sunburn?
There was speculation that in case that the magnetic poles switch their positions and weaken the magnetic field temporarily, the Auroras would occur on the whole globe. They wouldn’t be diverted by the magnetic field, but happen everywhere.
Major Sun Storms are a good reason to build power lines underground. It costs a bit more, but protects power lines against both atmospheric threats and sun storms.
Wires underground can still pick up induction currents. But presumably they are much better grounded.. The energy is miniscule compared to normal solar radiation, so we won’t feel a thing. The point is that it arrives as high energy particles (preceded by X-ray emission) which gets deposited in the upper atmosphere. The only thing to be aware off is radiation at high altitude. This affects polar commercial flights. But these flights will be rerouted anyway if the GPS has problems.
Are the particles usually “massy” particles or something comparable to photones/electrones/neutrinos? Maybe the sun storms don’t cause a heatwave, because they don’t contain very much rays that could be transformed into heat on earth.
No, these are real particles. Protons, mainly
Mainly protons because protons are simply what the vast majority of the sun is made of. Protons are simply ionised hydrogen.
It is a unimaginable long distance for Protons from the Sun to Earth and beyond. It shows the giant magnitude of the force of the Sun’s eruptions.
IIRC, buried HV cables are *some-what* protected by their closely positioned phases and, yes, metal sheathing. I don’t think superconducting DC links would suffer, given their AC/DC/AC processing. But that still leaves ‘common mode’ currents, ground loops etc. Unless transformers are equipped to deal with such, must trip breakers, isolate line before transformers over-heat…
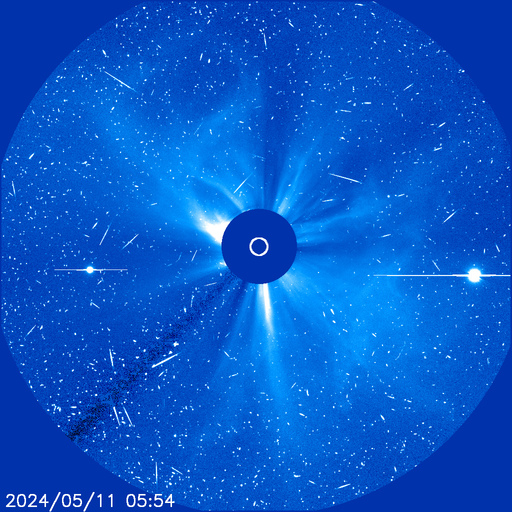
The incoming solar storm will contain multiple CME’s that are expected to overlap to create a cannibal CME.
Not sure if I’m phrasing my question correctly, but I wonder if the CME’s could “phase” to create a “wave”/harmonic stronger than the sum of the individual CME’s?
A loose analogy would be deep ocean Rogue wave…but I’m not sure if this would apply to a series of closely spaced CME’s?
If the second wave travels faster than the first, it can sweep it up and cause further particle acceleration. That may be what happened in Carrington (see the post). The first wave can also make the impact of the second one faster. In this case I would not be too concerned though.
Looking for Weather: Scandinavia is awaiting an Omega Anticyclone. This would mean weeks with a lot of sunshine and … no rain.
Contrary to this Hawaii has got winter warning in May! They expect heavy snow and very strong winds … on Mauna Kea: https://www.mountain-forecast.com/peaks/Mauna-Kea/forecasts/4205
Finaly better weather!.. stormy humid and northen as Scandinavia are are competely shrouded in cyclonic marine gloom for most of the year with cloudy dull skies, sky high humidity, low light and generaly low temperatures, ( specialy so for Denmark, Iceland and coastal Sweden ) it maybe not at all as cold as siberia and canada as its marine penninsula, but since Scandinavia is much further north than almost all other northen other populated areas, winters lasts much longer here than in example edmonton thats much further south in terms of latitudes and days are shorter. While we haves the words highest living standards. the worlds highest wages and free education and healthcare and excellent social saftey systems… Scandinavian countries still have some of the worlds absoutley highest suicide rates, and the gloomy weather coud be a part of that.. winter where I live is like one huge dreary funeral. Winter in Northen Sweden and Finland are drier and more sunny and the bright snow makes things alot more appealing and bright even if the days are shorter than in the dreary south cities here, still its only in late November – to early January where the days gets very short. But the sky conditions despite sunlight even in winter in sourthen scandinavia are below avarge here for most of the year cloudy and gloomy and is similar to the famed “anticyclonic gloom” in Australia so not very fun, Siberia have paradoxaly in some ways better winter than us, they are so dry so their winters are always sunny.. unlike ours that are typicaly cloudy and depressing…it also feels extremely cold with higher humidity than in more continetal regions. Sourthen parts of Scandinavian countries have weather similar to Ireland and UK.. BUT colder in winter and the winter lasts longer and haves shorter but warmer summers they haves, so quite gloomy but there are some t shirt days in summer. Best winters in Nordics are northen Sweden and Finland with dry air and bright snowy days… worst winters are likley coastal Norway and Iceland, S coastal Sweden with bone chilling cold wetness
“Scandinavia is awaiting an Omega Anticyclone. This would mean weeks with a lot of sunshine and … no rain” .. well in 2018 we got a record summer! months months with temperatures of 30 and over 30 c and no rain. It was the mediterannean summer air mass that was pushed up and trapped here for months due to rare atmospheric conditions, something like that, with heat lasting so long have really never been recorded here before.It was first time for many Scandinavians with really subtropical evenings and searingly hot afternoons Stockholm reached 35 c. Iceland out in the cold ocean was totaly unaffected by this heatwave. The Avarge summer in Scandinavian mainland is a modest 20 in the south and a mild 15 in the north with occanional much warmer days. I hopes for a good summer, last years one was only one week with really warm weather.
I coud imagine to live in the tropics with better overall weather… but most tropical countries are so very poor per capita compared tous here in Europe and Im myself is not citizen, so it will be Iceland anyway for me its basicaly Sweden with active volcanoes : ) but what I should work with is only very vauge… and Im very busy seeking a career now
Still Malasyia and Singapore is a no for me… way too sultry despite fairly good living standards even if I was offered a job there.. it will be Iceland anyway for me defentivly… the latter dont have volcanoes
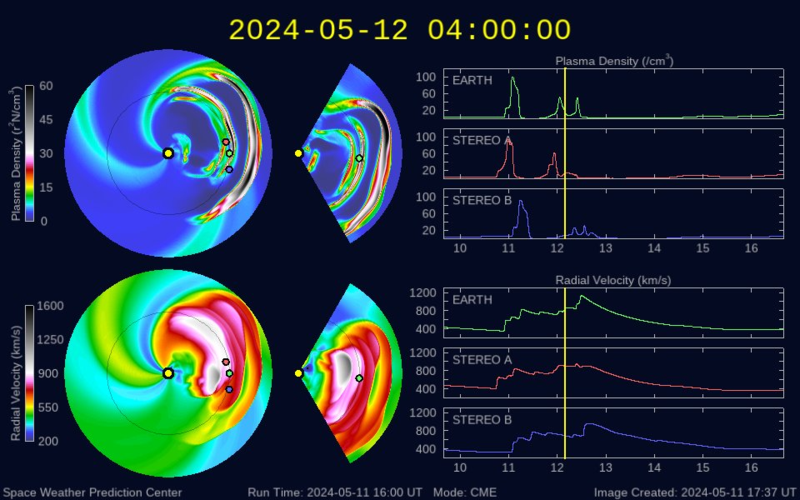
Update: The CME has hit STEREO and it’s at least as strong as forecasted.
This just posted over on spaceweatherlive.
“The first of the anticipated coronal mass ejections has arrived at STEREO Ahead, a satellite slightly closer to the Sun than DSCOVR. The impact has been significant there with a maximum Bt component of 41nT and a minimum Bz value of -33nT at the time of writing. If we see similar values at Earth (which we should) this is certainly going to cause a significant geomagnetic storm where severe G4 geomagnetic storm conditions are absolutely possible!
https://www.spaceweatherlive.com/?fbclid=IwZXh0bgNhZW0CMTAAAR0Jx-jGOiC8GwctDT7Kx5Uy9POVMqR4P2_-alcIb-lNfcv6AhNAecntQN4_aem_AXbcV2KCOLNovJBjxnz9_hjipBa1sGJKxaYQDHeK2vKKAdBcDD-orw8P7mdaqinUxFg8c6bpxRqgiBTQwV6mJFy-.html
Update#2.
The CME just hit DSCOVR with characteristics similar to STEREO.
Earth impact is imminent…within the hour most likely (1700 GMT currently).
The CME is at least 5 hrs ahead of schedule…a sign it may be stronger than forecasted?
Space Weather Message Code: WARSUD
Serial Number: 222
Issue Time: 2024 May 10 1647 UTC
WARNING: Geomagnetic Sudden Impulse expected
Valid From: 2024 May 10 1700 UTC
Valid To: 2024 May 10 1730 UTC
IP Shock Passage Observed: 2024 May 10 1639 UTC
NOAA Space Weather Scale descriptions can be found at
http://www.swpc.noaa.gov/noaa-scales-explanation
I am going all in! I am betting G5
Such a strong negative Bz will likely produce very strong auroral activity. It is worth keeping an eye out at lower latitudes. Probably too much light at higher latitudes, but who knows if it is really strong. I experienced an aurora in August in Iceland, when it was nowhere near as strong and still twilight.
Space Weather Message Code: ALTK07
Serial Number: 143
Issue Time: 2024 May 10 1718 UTC
ALERT: Geomagnetic K-index of 7
Threshold Reached: 2024 May 10 1708 UTC
Synoptic Period: 1500-1800 UTC
Active Warning: Yes
NOAA Scale: G3 – Strong
NOAA Space Weather Scale descriptions can be found at
http://www.swpc.noaa.gov/noaa-scales-explanation
Potential Impacts: Area of impact primarily poleward of 50 degrees Geomagnetic Latitude.
Induced Currents – Power system voltage irregularities possible, false alarms may be triggered on some protection devices.
Spacecraft – Systems may experience surface charging; increased drag on low Earth-orbit satellites and orientation problems may occur.
Navigation – Intermittent satellite navigation (GPS) problems, including loss-of-lock and increased range error may occur.
Radio – HF (high frequency) radio may be intermittent.
Aurora – Aurora may be seen as low as Pennsylvania to Iowa to Oregon.
Space Weather Message Code: SUMSUD
Serial Number: 269
Issue Time: 2024 May 10 1729 UTC
SUMMARY: Geomagnetic Sudden Impulse
Observed: 2024 May 10 1645 UTC
Deviation: 108 nT
Station: Boulder
NOAA Space Weather Scale descriptions can be found at
http://www.swpc.noaa.gov/noaa-scales-explanation
Space Weather Message Code: ALTK08
Serial Number: 31
Issue Time: 2024 May 10 1744 UTC
ALERT: Geomagnetic K-index of 8, 9–
Threshold Reached: 2024 May 10 1739 UTC
Synoptic Period: 1500-1800 UTC
Active Warning: Yes
NOAA Scale: G4 – Severe
NOAA Space Weather Scale descriptions can be found at
http://www.swpc.noaa.gov/noaa-scales-explanation
Potential Impacts: Area of impact primarily poleward of 45 degrees Geomagnetic Latitude.
Induced Currents – Possible widespread voltage control problems and some protective systems may mistakenly trip out key assets from the power grid. Induced pipeline currents intensify.
Spacecraft – Systems may experience surface charging; increased drag on low earth orbit satellites, and tracking and orientation problems may occur.
Navigation – Satellite navigation (GPS) degraded or inoperable for hours.
Radio – HF (high frequency) radio propagation sporadic or blacked out.
Aurora – Aurora may be seen as low as Alabama and northern California.
And now joined by an S2 proton storm
Space Weather Message Code: ALTPX2
Serial Number: 71
Issue Time: 2024 May 10 1754 UTC
ALERT: Proton Event 10MeV Integral Flux exceeded 100pfu
Begin Time: 2024 May 10 1745 UTC
NOAA Scale: S2 – Moderate
NOAA Space Weather Scale descriptions can be found at
http://www.swpc.noaa.gov/noaa-scales-explanation
Potential Impacts: Radiation – Passengers and crew in high latitude, high altitude flights may experience small, increased radiation exposures.
Spacecraft – Infrequent single-event upsets to satellites are possible.
Radio – Small effects on polar HF (high frequency) propagation resulting in fades at lower frequencies.
UK so far
At the moment the predicted peaks are in daylight hours in the UK. There will be unpredictable spikes though I expect. I’ve seen signuficant spikes when the predicted level was low a number of times.
What it looks like in Saskatoon in Saskatchewan.

Not really sure if it is the proper source, but I use this app.
Kp index now sharply down to Kp6. Suspect we’re in between CME’s?
Back at 7 again although Bz at ACE has jumped positive again. Hope it doesn’t stay that way.
Space Weather Message Code: ALTK07
Serial Number: 144
Issue Time: 2024 May 10 1831 UTC
ALERT: Geomagnetic K-index of 7
Threshold Reached: 2024 May 10 1829 UTC
Synoptic Period: 1800-2100 UTC
Active Warning: Yes
NOAA Scale: G3 – Strong
Up again
Space Weather Message Code: ALTK08
Serial Number: 32
Issue Time: 2024 May 10 1904 UTC
ALERT: Geomagnetic K-index of 8, 9-
Threshold Reached: 2024 May 10 1901 UTC
Synoptic Period: 1800-2100 UTC
Active Warning: Yes
NOAA Scale: G4 – Severe
==================
Will probably be back down to 3 when it gets dark in the UK just to be annoying!
New Zealand a few minutes ago. More pics at twitter link
https://twitter.com/AndrewDickson13
Wonderful!
You can watch the x-flares popping off at the Solar Observatory website for yesterday, May 9th, I like the 94 Angstrom line as it shows the deep ultraviolet and soft x-rays quite well. https://sdo.gsfc.nasa.gov/assets/img/dailymov/2024/05/09/20240509_1024_0094.mp4
Off topic of solar storms, but pertinent. A big question must be asked. Have we assumed that the inflation rate of the Svartsengi area was diminished (less slope on the line) for this last eruption due to leakage into the 5 cones (gradually converging to just 1) but now that the eruption is officially declared over, we are still seeing a fairly constant rate of inflation, so have we made a mistake of assuming that the lower slope on the line was due to surface leakage, rather than the other possibility that a constriction has occurred so that the magma flow rate is less than before? See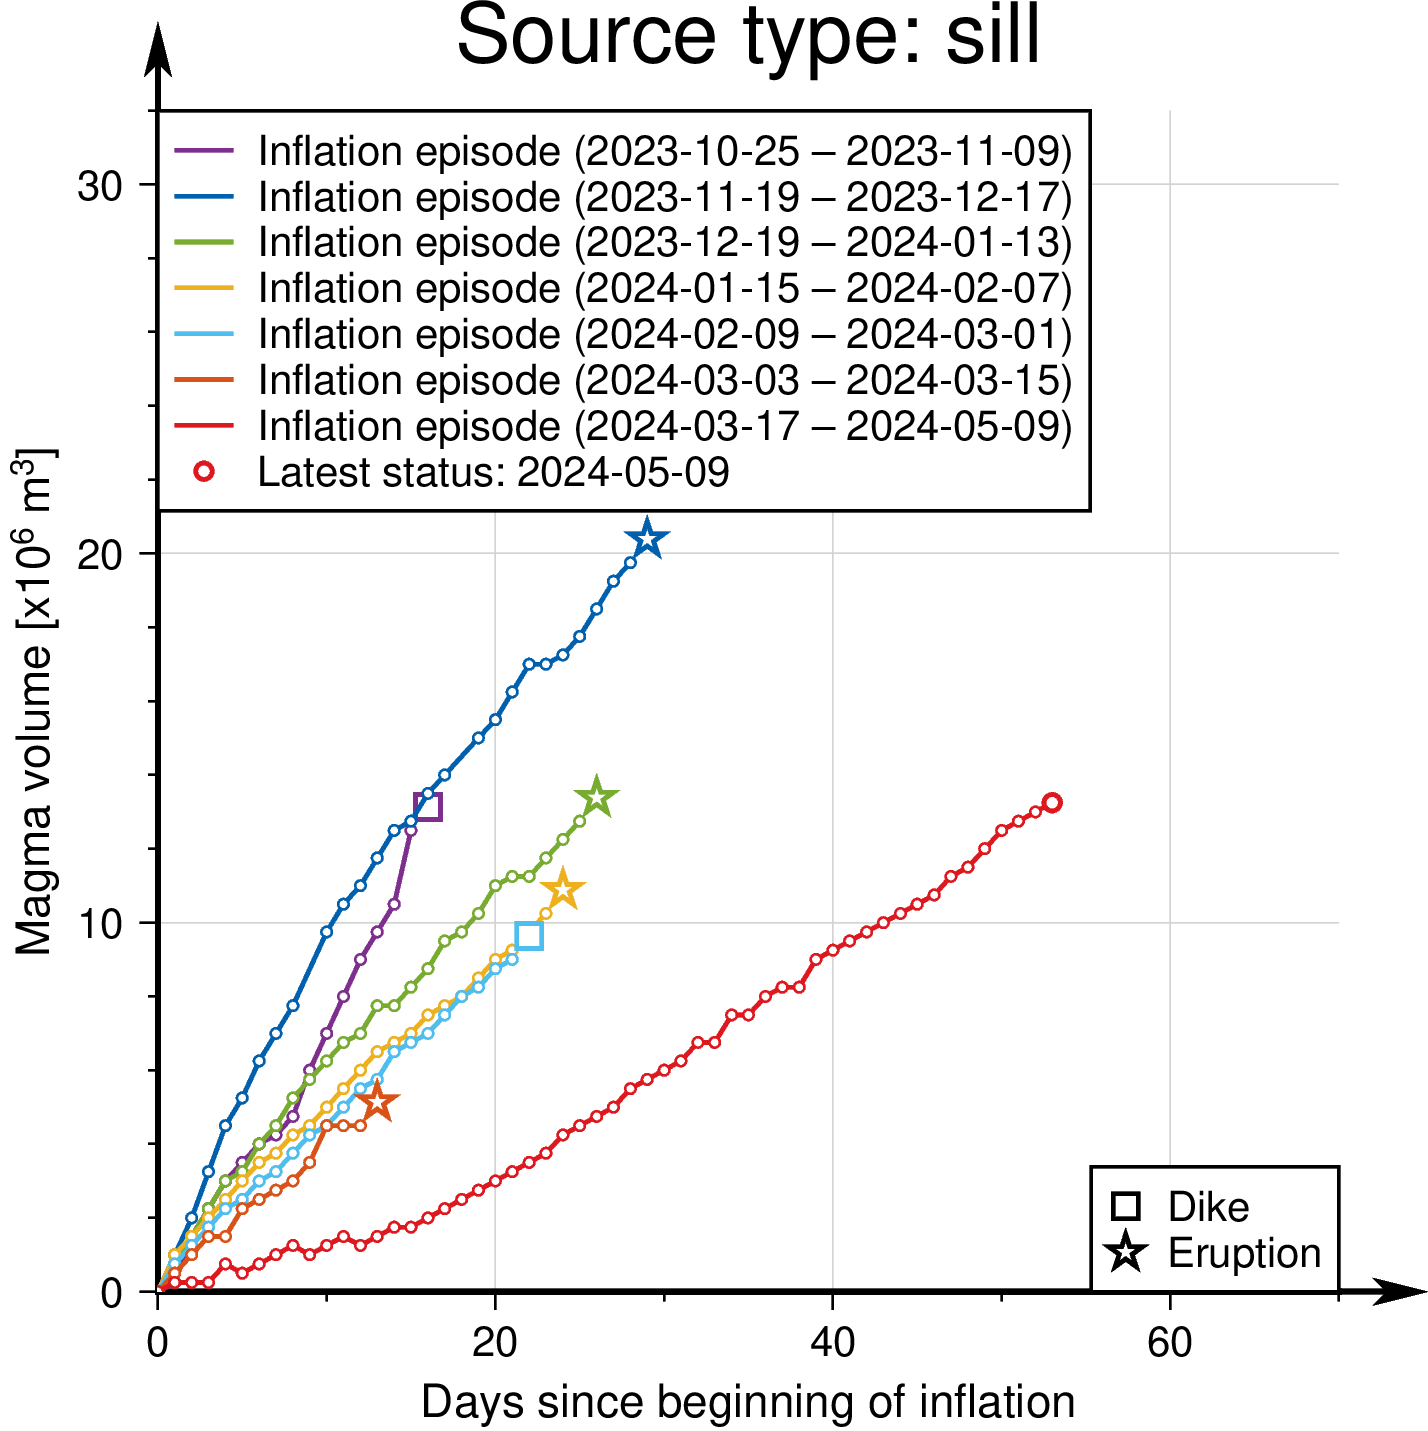 for the latest information on accumulated magma. A significant change in recharge rate might have occurred, becoming less.
Thoughts?
I also used the graph to obtain average flow rates:
Inflation rates:
Episode 1 (2023-Oct-25 to 2023-Nov-09)
angle: 66 deg
20.51 x 10^6 m^3 average flow rate / 20 days (16 days)
Episode 2 (2023-Nov-19 to 2023-Dec-17)
angle: 56 deg
13.54 x 10^6 m^3 average flow rate / 20 days (29 days)
Episode 3 (2023-Dec-19 to 2024-Jan-13)
angle: 46.4 deg
9.59 x 10^6 m^3 average flow rate / 20 days (26 days)
Episode 4 (2024-Jan-15 to 2024-Feb-07)
angle: 41 deg
7.94 x 10^6 m^3 average flow rate / 20 days (24 days)
Episode 5 (2024-Feb-09 to 2024-Mar-01)
angle: 41 deg
7.94 x 10^6 m^3 average flow rate / 20 days (22 days)
Episode 6 (2024-Mar-03 to 2024-Mar-15)
angle: 41 deg
7.94 x 10^6 m^3 average flow rate / 20 days (13 days)
Episode 7 (2024-Mar-17 to 2024-May-09)
angle: 34 deg
6.16 x 10^6 m^3 average flow rate / 20 days (54 days)
Reference on chart:
tan(47.6 degs) = 10 million m^3 magma for 20 days
I would take it that we’re looking at around 6×10^6 m^3 / 20 day flow rate now.
Caveat: All the above assumes that I did the math correctly from the data on the chart.
Without doubt, the slow inflation was due to part of the magma feeding the eruption. As soon as the eruption started to slow down, the inflation started to increase again. This didn’t happen overnight, but gradually. The correspondence is too good to be a coincidence.
IMO have suggested the possibility of a leak into the dyke. That could have released some pressure. However, they also made a comparison with Krafla, stating that increased pressure may be required to start an eruption.
Around 2nd April we already got a small acceleration of uplift all around Thorbjörn. The next increase of the gradient can still happen anytime.
If we look on the previous graphs, they show a tendency towards more flat acclivity. March was most flat, November (intrusion) most steep. Does this indicate that the peak of the current Fires has been passed? During the 30 (?) years of eruptions there can be f.e. four cycles of episodic eruptions, seperated by years of dormancy.
I can confirm a spectacular display in Scotland a short time ago visible even in the middle of a city. Directly overhead as well. Didn’t have my camera and my phone is a bit too old to do it justice.
Plenty twitter pics.
Here’s one from Glasgow
https://twitter.com/john_ellis/status/1789067655674019846
And there we have it G5 extreme
Space Weather Message Code: ALTK09
Serial Number: 6
Issue Time: 2024 May 10 2334 UTC
ALERT: Geomagnetic K-index of 9o
Threshold Reached: 2024 May 10 2254 UTC
Synoptic Period: 2100-2400 UTC
Active Warning: Yes
NOAA Scale: G5 – Extreme
NOAA Space Weather Scale descriptions can be found at
http://www.swpc.noaa.gov/noaa-scales-explanation
Potential Impacts: Area of impact primarily poleward of 40 degrees Geomagnetic Latitude.
Induced Currents – Widespread voltage control problems and protective system problems may occur; some power grid systems may experience component failures or protective device trips resulting in blackouts or disruption of service. Pipeline currents can reach hundreds of amps.
Spacecraft – Systems may experience anomalies to include: extensive surface charging, unexpected orientation and attitude changes, uplink/downlink errors, and satellite orbit degradation.
Navigation – Satellite navigation (GPS) may be degraded or unavailable for days.
Radio – HF (high frequency) radio propagation may be impossible in many areas for one to two days.
Aurora – Aurora may be seen as low as Florida to southern Texas and southern California.
CALLED IT!!!
Another X
Maximum 11 May 2024 01:23:00 GMT X5.8 Integrated flux: 4.6e-1 J m-2
After Kp abruptly dropped to Kp6 about 2 hrs ago, a new spike in plasma density has driven the index back up to Kp8/G4.
The auroral oval shows faint aurora now over eastern N.A. and may become camera-visible down to ~ 37N once full darkness sets in. For us out west, we’ll have to wait another couple hrs for our first chance.
Talk about class being in session!
Back to Extreme
Space Weather Message Code: ALTK09
Serial Number: 7
Issue Time: 2024 May 11 0246 UTC
ALERT: Geomagnetic K-index of 9o
Threshold Reached: 2024 May 11 0240 UTC
Synoptic Period: 0000-0300 UTC
Active Warning: Yes
NOAA Scale: G5 – Extreme
I didnt see it this time but there are a lot of videos of the Aurora Australis from my immediate area taken last night. Its not just the northern lights that flare up in the CMEs 🙂
This is my own photo taken last September:
https://i.imgur.com/FUHerf9.jpeg
All of the new pictures I have seen though have an intense red hue, far more than what I saw and apparently very visible even in old phones. I did wake up very early and the night was brighter than normal just never occurred to me to look outside… 🙁
I was lucky enough to see the auroras. Around midnight local time here in Sweden, the entire sky lit up with colours. A lot of intense red hues as you say. I don’t think it makes a difference if you watch the borealis or australis side of the phenomenon. This time of year, the sky towards the north is the typical Scandinavian bright summer night. Too bright to show the aurora. But the aurora was strong enough to show up straight towards the south, where the sky was still dark enough, so I got to enjoy the show anyway.
I saw it tonight. Not a lot of red or clear structure but half of the sky was a green glow.
Regarding the affects a repeated Carrington event would have on the modern infrastructure, is it not unreasonable to think maybe it is just a lot more robust to this stuff than we thought? Or, that the actual position of the geomagnetic poles is more important and can wildly affect results?
I keep reading articles about how events like that happened statistically far apart enough that its obsolutely insane odds that we have not expetienced it and we are only years away from an instant apocalypse and global dark ages… I have seen the same thing said about volcanism too, that Iceland is going to do another Laki and choke out Europe or that we get another Pinatubo. We did just get another Pinatubo, actually a bigger version, the biggest bang on the planet since the time we tried to grab that title ourselves in 1964. And Kilauea in 2018 erupted SO2 at nearly Laki rates for 3 months on the upwind side of Hawaii without sterilizing the island, people lived 2 km away from it…
Not saying there arent risks our modern society hasnt faced but I find it hard to believe stuff that happens a few times a century just didnt happen during the whole of the last one. The Sun probably does potential Carrington events pretty often maybe even every cycle and it was just a bit of bad luck the Earth was in the line of sight for two of them in tandem in 1859.
Location and context are important. Hunga Tonga happened in a very remote area and had a pathetic sulfur load so it’s not really comparable to Pinatubo. Only the most paranoid individuals believe that Pinatubo scale eruptions are likely to have devastating ramifications. The 2018 Lower Puna eruption was a wet fart compared to Laki. Just one of Laki’s eruptive episodes erupted more magma and SO2 in 2 days than Kiluaea did in 4 months. https://agupubs.onlinelibrary.wiley.com/doi/full/10.1029/2001JD002042
It might seem crazy but nothing that no volcanic eruption or solar storm that has been directly observed with modern instrumentation is comparable to the events of the past. Hunga Tonga is nothing compared to even a low-end VEI 7 and no solar storm since 1921 has challenged the Carrington event.
Laki was intense for an effusive eruption but its still not that fast compared to a stratospheric eruption, ant despite what has been claimed it was in no way a plinian eruption, the VEI 4 status is justified. The important factor for voluminous effusive eruptions is longevity and average eruption rate. Laki averaged out was about 3x that of Kilauea or Holuhraun, but factoring that intense start would probably bring the majority of the eruption to a similar baseline, with variability. No amount of vog crossing the Atlantic is going to compare to living literally next to the source anyway, which is more of the point I was trying to make. There is also the major factor that 1780s Europe wasnt exactly a garden of eden and most people were living in pretty terrible conditions, French Revolution comes to mind, the British exploring the world trying to escape their tiny overpopulated island after the US kicked them out…
My point with solar storms is that it seems very unlikely that a common event just doesnt happen for a century at the same time we happen to advance. Maybe Earth hasnt been directly hit but no doubt the Sun has made flares if comparable intensity many times since. There was a flare as big as the Carrington event in 2012.
I think you’re talking about flares and CMEs and in that, you’re right that Carrington-level flares are not at all that uncommon. A solar storm is the earth’s reaction to a CME or Coronal stream
Yes I mean flares or CMEs of similar strength and intensity to the Carrington event. I imagine the one in 1859 was so powerful because it was basically a direct hit, and the chance of that is low. So the risk factor is probably more complicated than just the occurence of the flares.
I did read too that superflares at sunlike stars are from stars that are highly magnetic much more than the Sun is today. Its not really clear if this is a cycle or if they are always like that though, as they are otherwise similar to the Sun in both rotation and size. The fact that the only recorded affect of the 777 flare is a bright aurora probably means it wasnt a superflare though, which might be intense enough to do a lot more than that, maybe even start fires from the heat. Superflares might be rare periods of highly intense activity that are widely separated.
The article linked by Albert below remarks that superflare stars have very large and long-lived sunspot groups that last through many rotations, compared to the Sun. It doesn’t give any clear reasons as to why this happens though.
Thank you albert.
The map of ‘chance to see aurora’ is inspired.
It looks as if I can get to Tromso and stay a few days for ~£1000 all in and if the right weather window is selected (last minute) chances are I would see an aurora. Cheap for as interesting natural event.
Churchill is a tad expensive though.
I think it’s not dark enough there at this time of the year.
It isn’t. If it isn’t already, it’s very close to midnight sun there.
I was actually thinking of about November. Now is not possible and the weather is nice here (momentarily).
I would suggest October instead. Auroral activity seems to be higher around the equinoxes. I have theorised that it is related to angles relative to the sun.
The weather is also often more favourable
Tromsø is a good choice for Midnight Sun. Aurora there needs longer and darker nights.
Cloud cover might be an issue on the coast?
from switzerland – santis observatory
https://twitter.com/i/status/1789132750139584912
The recent explosion on the sun, scary knowing that the sun thousands of years ago have had ”magnetosphere hyperstorms” that makes carrington look like a a little dwarf. The ancient mega storms might have come from a once-in-10,000-years “superflare,”events that are many thousands of times more powerful than a regular solar flare, A direct hit by such a superflare today would have catastrophic consequences for our globally wired society, One more ”recent” event A.D. 775 event may have been 50 – to 100 times more powerful than the carrington event
A strange sight then seeing intense Aurora in Singapore and Kailua Kona whole upper atmosphere ionized by all the radiation
Then there are young red rapidly spinning dwarf stars that haves weekly flares many 10,000 times more powerful than the largest solar flare ever recorded here on Earth, souch flare stars must be totaly poppmarked jammed with sunspots a is a fast way to kill a habitable planet
https://watchers.news/2024/05/10/major-x3-9-solar-flare-erupts-from-ar-3664-the-10th-x-class-flare-in-just-7-days/
A young red dwarf woud be fun thing to photograph by future probes..some of these so crazy jammed popped with starspots that its light output varies all the time, the sun of ours… may have 10 large at a time at high solar maxima. But here with a red dwarf its many 100 s 100 s of starspots, some spots merge into dark areas covering much of the stars surface like nothing else we have on our sun. Really ultracool red dwarf stars.. with a well below 3000 c photosphere… the coolest photosphere of a real m dwarf 1 726.85 degrees Celsius… the starspots there coud be so very cold that clouds of metals and sillicates forms in them in a hydrogen atmopsphere, I dont think the coolest Red dwarfs have any plasma photosphere like our sun.. here its fully molecular hydrogen
What temperature on stars surfaces turns molecular hydrogen into a plasma? our sun at almost 6000 c is almost fully ionized its too hot for recombination of true molecules, on ultracool m dwarf photospheres its diffirent I think
Still at 1 726.85 degrees Celsius it woud be a white shine for our own eyes… but compared to our sun… it woud be a very warm toned white light.. like a warm homey lightbulb at 2000 k compared to the more blue light that our sun puts out. The smallest red dwarfs puts out so little blue light that you may not have a blue daysky… instead being whiteor pale. The sky color also depends very strongly on the atmospheres density and pressure ( rayleigh scattering ) and not only by the temperature of the star. But most Red Dwarfs and K Dwarfs ( not as small as example above ) will produce pale blue dayskies on planets with resonable atmosphere pressure… the more air pressure the warmer the light and paler the blue skies becomes.
I woud like alot living under a K dwarf in the habitable zone with an atmosphere somewhat denser than ours, then you will have plesant homey warm toned days and spectacular sunsets… and everything will be soft toned… you may not need sunglasses on souch an alternate Earth
The 774 event was about as energetic as the Carrington event, as is mentioned in the post. You are overstating it.
Well read from wrong estimates… but previous events are not to mess with… I have also read that other sunlike G stars coud also go absoutley crazy… but our sun is not in souch an era now.. quite calm even if ti does not seem so today
But how do you know the 774 event was the same as Carrington when the carbon spike is much bigger? Wikipedia attributes the Miyake events to super-flares:
https://en.wikipedia.org/wiki/Miyake_event
As the post states, the particles had higher individual energy. But the total energy is not considered to be much larger than the Carrington event: it is within an order of magnitude. (That assumes that it was a single event. Several large flares over a period of months could also produce the observed signal.) There is no report of widespread aurora from 774, so it was not exceptional in terms of induced current in the atmosphere. The impact on Earth depends on many aspects of a flare. For instance, the largest solar storm known in terms of high-energy particle flux was in February 1956, an otherwise unremarkable event. It had a ten times higher particle flux than the damaging 1989 storm, and I think (to be checked) it is seen in isotope measurements which the Carrington is not. But papers that claim that 774 was a ‘superflare’ will get much more news coverage than ones that assign it a ‘large flare’. See https://www.annualreviews.org/content/journals/10.1146/annurev-astro-112420-023324
I see, thanks. It’s a complex issue so I don’t understand some things.
For once we did well here in leafy Surrey, UK. A nice display of Aurora indeed.
Quite a timely re-run of the Carrington article, Albert and thank you!
We had a comment that was put into the reject queue by our demon. With apologies, the rescue attempt of the comment failed. The commenter noted that the Kilauea inflation is decreasing.
The last samples in the Icelandic GPS readings are a bit shaken up by the solar storm.
Aurora from Redding, northern Calif…
https://ibb.co/QNkpcBb
trying image again
Here in NorCal (looking towards Mt. Shasta), the storm peaked between 11p.m. and 12:30 a.m.
The magnificence of seeing the pillars of light were mesmerizing.
Hoping more is on the way. Late yesterday’s X 5.9 flare produced a major proton event and full halo CME that is at least partially Earth directed. After staying up well into the wee hours, a nap this afternoon will let me watch for more aurora tonight.
Here’s the latest (so far) from the British Geological Survey magnetometers.
Don’t see that very often.
Probably no G5 repeat tonight but you never know. And as I write I see we’ve just reached G4 again!
Space Weather Message Code: ALTK08
Serial Number: 39
Issue Time: 2024 May 11 1650 UTC
ALERT: Geomagnetic K-index of 8, 9-
Threshold Reached: 2024 May 11 1647 UTC
Synoptic Period: 1500-1800 UTC
Active Warning: Yes
NOAA Scale: G4 – Severe
Current outlook of the SWPC. Probabilities seem to increase. Chances for our webcams in Iceland I guess. Thx Albert for the post.
Source: Twitter (formally known as X)
1st: formerly, not formally
2nd: didn’t think of the Icelandic weather + daylight
3rd: I’m going to wear the paper bag again
As far as tonight’s aurora chances, IMHO there is wild card involved. The X5.9 that occurred around midnight PDT (about 16 hrs ago) and produced the first and only major proton event (see image) is screaming towards Earth and by the time it reaches Earth could possibly partially overrun a cannibal CME due in a few hours earlier.
If the geomagnetic fields cooperate, another G4-G5 is certainly possible (but not a given).
We shall see.
The latest CME forecast from SWPC.
Weird, low quake activity at Kilauea but there was quite a strong tremor just today. There is a daily variation but much lower intensity.
There is a faint signal elsewhere but it seems this tremor is very local to RIMD
It seems Lewotobi has effused a lava flow 4.5 km long. Must be a thick crystal-rich andesite flow. It’s expected from this volcano since the edifice is mostly built from thick lava flows.
https://twitter.com/kosmi64833127/status/1789397165619458496
Fernandina is still erupting too.
Yup as well as Erta Ale that does small scale pahoehoe activity in its two pit craters,thats being buried its basicaly very very slow shield building at a slower supply pace than Puu Oo, Erta Ale maybe similar to the late stage activity of the larger Icelandic monogenetic sheilds.. just that Ale is a continetal polygenetic shield volcano, Nyiramuragira is also doing something similar now filling up its caldera with alkaline pahoehoes. These two like Kilauea woud be excellent tourist volcanoes… if they was not so hard to acess unlike Hawaii thats a drive in volcano
https://browser.dataspace.copernicus.eu/?zoom=16&lat=13.60387&lng=40.66879&themeId=DEFAULT-THEME&visualizationUrl=https%3A%2F%2Fsh.dataspace.copernicus.eu%2Fogc%2Fwms%2Fa91f72b5-f393-4320-bc0f-990129bd9e63&datasetId=S2_L2A_CDAS&fromTime=2023-11-11T00%3A00%3A00.000Z&toTime=2024-05-11T23%3A59%3A59.999Z&layerId=1_TRUE_COLOR&demSource3D=%22MAPZEN%22&cloudCoverage=30&dateMode=MOSAIC
The northen part of Ales caldera is now filled by grey pahoehoe, maybe a small intra caldera lava shield is forming like 2017… only to collapse again later into a new pit crater during lava withdrawl underground in the magmatic system
Nice. These volcanoes go under the radar, so the only way to know what they’re doing is from satellites.
Looks like the southern vent has also been overflowing. There’s no lava lake anymore, not sure when it went away. It has two hortino complexes which overflow occasionally.
Nyamuragira, and Nyiragongo are also doing intracrater lava flows.
Ambrym has produced fissure eruptions inside its craters. There was one toward the end of 2023, and another a few weeks ago, I think. ExtremePursuit posted them on Facebook.
https://browser.dataspace.copernicus.eu/?zoom=13&lat=-0.41516&lng=-91.432&themeId=DEFAULT-THEME&visualizationUrl=https%3A%2F%2Fsh.dataspace.copernicus.eu%2Fogc%2Fwms%2Fa91f72b5-f393-4320-bc0f-990129bd9e63&datasetId=S2_L2A_CDAS&fromTime=2023-11-11T00%3A00%3A00.000Z&toTime=2024-05-11T23%3A59%3A59.999Z&layerId=6-SWIR&demSource3D=%22MAPZEN%22&cloudCoverage=30&dateMode=MOSAIC
And thermal view of Fernandinas tube system and ocean entry, as chad says it have likley recovered from the late 1960 s caldera collpase and more magma is stoored and avaible now for eruption. there are other souch pahoehoe fields on Fernandina ,, but this is the first time in modern history I think we see fernandina do a tube feed eruption that lasts for some time, Sierra Negra also have large paheohoe fields so some eruptions in galapagos lasts for some time perhaps up to a few years, specialy the lava sheilds at Santiago that may have lasted decade or much more
Not sure Nyamuragira is hard to physically get to, just unsafe in location. Same for Nyiragongo there are a lot of roads going right past it, and paved too. Its a pleasent place to live in a more peaceful world, at least when the lava lake isnt high. It seems like the rapid lake drainouts and huge lava lake and caldera could be a geologically recent phenomenon, maybe only the past few centuries.
Yup… the wars and poltical squabbling ruins what coud be an incredibely pleasant place to live in, there is lots of resources abd tourist ponetial so huge potential for wealth… the whole virunga national park is simply awe stunning really, haves some of Africas most dramatic scenery. The volcanoes are dangerous for soure … if Nyiramuragira keeps filling it will probaly collpase again soon when the magmatic column gets too heavy. There was an ENORMOUS ammount of sulfur over Nyiramuragira last week covering much of central africa in Windy app.. now its way much less so wonder if an intense intra caldera eruption took place, but I have not seen any pyrocumulus anvils in satelite images nor any changes in in the caldera in sentinel app, so perhaps missreading … IF there is a lava lake there it coud have been violent degassing …but difficult to know since its so hard to acess
Still Hawaii will be the most impressive beasts for soure
Possible small intrusion next to Pauahi Crater, at Kilauea volcano. Halema’uma’u has not deflated, so it seems like a very small “leak”, I don’t think there will be any eruption. Micro-intrusions are characteristic of Kilauea’s UERZ.
Capture from PAUD seismometer. The likely intrusion lasts a little over 15 minutes and reaches earthquake rates of over 5 earthquakes per minute, as much as can be appreciated in such a seismogram. All earthquakes emanate some hundreds of meters east of Pauahi Crater. Maybe a small dike propagating east from the connector under Pauahi. But the volume involved must have been utterly insignificant since none of the tiltmeters show a notable signal. It does show the ground is strained, though. As pressure rises, bigger dike intrusions will probably happen in the area, maybe some will erupt from the bottom of the craters.
If you follow the fault lines that ruptured in the last intrusion on the SWRZ, they do line up with the Pauahi area somewhat. There could be a common tectonic element even if the magma will come from a different rift.
There is a DI event going on presently, the next intrusion could be in a couple days when it ends.
Looked like this on STCD and JCUZ
Waiting for the increasing pressure in halemaumau to blow open the ERZ connector… the small pit crater eruptions in 1960 s where very nice for soure remeber the lava falls into one of these even a lava vortex
How shallow have intrusions to be to cause “passive volcanism”? This shall apply to any volcanic activity without the rise of magma until the surface. F.e. higher heat, gas or steam emissions. Yellowstone’s hydrothermal system or Great Geysir of Iceland are examples for this passive volcanism.
Can anyone explain what’s going on in this video please? From the first night of the aurora.
https://www.instagram.com/reel/C62AykqoH6Y/?igsh=eWMwOGV5c2NueXhi
Sundhnukar V is on it’s way.
And Leon is getting laaaaarrrrrger.
Alas, still daylight in Iceland. Why?!
This time of there is only around 2-3 hours of daylight and in the far north in June, the sun doesn’t set. Even though the sun sets in most of Iceland, it doesn’t really get fully dark.
Wednesday May 15th would be 60 days from March 16th. If the end of the lonely erupting cone means a speed-up of the development, the eruption will happen earlier. All in all I’d assume a subjective probability of 100% that the eruption will have begun on or until May 15th.
It’s both possible that the eruption dies completely after 1-2 days or that it continues on low level on a certain cone for weeks again.
A lahar on Mt Marapi has killed at least 41 people.
https://www.dailymail.co.uk/news/article-13411071/Cold-lava-sweeps-villages-near-Indonesian-volcano-killing-40-people.html
I am a little late for the party, but here is my video about the Aurora on May 10th from Vorarlberg/Austria: https://youtu.be/zY7t5fiFAiw To me the Aurora looked stronger than in 2000 and 2003
Possible tremor at Grindavik.
It looks like it was only for a short period, looking in more detail.
New jump today, maybe the speed-up towards the next “Lava Flash Flood” has begun:
They say that the Sun Storm manipulated the GPS data. So we were a bit eyeless about what’s going on in Sundhnukur lava field. Now after the storm the data are going back to ordinary levels.
There’s a small note in Icelandic indicating that the irregularity was caused by the solar storm. This model is based on GPS readings, and the GPS measurements were really shaky during the solar storm.
Having said that, the next event could start any minute now (independent of the jump in the graph). My deadline has passed, so I missed the bet, but the initial statement of “any day” is still valid.
Indeed, the jump was caused by the interruption of the Sun Storm. We have to wait if the graph continues on the used growth path or changes its grade.
Yes, the solar storm would have caused significant calibration problems for the GPS so this point is best ignored. The slope of the line over the past month is not dissimilar to that of the past three episodes but is lower than that of the first two episodes. There are several possible explanations why the slope got less after the initial eruption(s): the pressure feeding into the sill from below may have lessened, the sill is leaking into the dike, or the sill has become more extended.
There is little indication at the moment that the inflation over the past month was affected by the eruption, so I expect the eruption was being fed from a different reservoir. That could be magma emplaced closer to the surface during the earlier phases, which kept the eruption going but was not being replenished. The eruption had been running down the tank for the past month, and was running on fumes the last week or two.
During March, the inflation was clearly slowed down and then gradually started to increase again. At the same time as the inflation increased, the eruption rates reduced until a point where it stayed fairly constant below 3m3/s. I think the eruption and the sill were being fed from a common deep source, but the low effusion rate during April was not enough to have an impact on the sill inflation.
One thing that I’m wondering about is the fact that the Mogi model of the inflation is reset to zero after each event. Is that a good way to treat it? What does the same Mogi model say about the amount of magma that leaves the sill each event? We see on the GPS curves that they don’t return to their prior levels, so some magma is likely left in the sill (or maybe sill complex is more correct). What effect does this have on the repose times? Could it be better predicted if the model was not reset to zero each time?
Maybe there are several polygenetic volcanic “cells” along the fissure systems that have their individual plumbing systems. The eruption of 16th March happened in one cell that emptied until early May. The next eruption is going to happen in another cell which may behave a bit differently to the last one.
Its kind of strange really that the next fissure eruption didnt happen. There was already an open vent but it just slowly died, and now the amount of magma accumulated is more than any of the prior eruptions so far.
Apparently the fissure stage of the last eruption was the most powerful of all of them so far and was over 1000 m3/s with more than 100 meter fountains along much of the fissure, was similar in strength and scale to the start of Holuhraun, stronger even, the small volume betrays the enormous intensity of these fissure eruptions. The pressure now is more than what made that happen already so the next eruption could be even faster again. Its not unlikely the new cone will reactivate and send alot of lava rushing to the barriers and ocean. Its also not unlikely the road and pipeline are going to be covered again and maybe even the barriers at Svartsengi tested.
Unfortunately the longer it takes to happen the larger the eruption will be. The old trend might have broken, eruptions might now be further apart and larger, maybe much larger eventually. Grindavik really seems just at the mercy of luck at this point, the eruptions are definitely viased towards the southern ends of the active rift.
New post is up! The bewitched land
https://www.volcanocafe.org/the-land-between-the-mountains/