Today is 270 years since the destruction of Lisbon. The earthquake of All Saints day 1755 in Lisbon changed a nation and is still remembered across the continent. Hence a republication of our 2016 post on this event. A few words on the effect on Scotland have been aded to the original.

Lisbon seen from the east during the earthquake. Exaggerated fires and damage effects.(Copper engraving, Netherlands, 1756). National Information Service for Earthquake Engineering image library
At one time, Portugal ruled the world. Its explorers discovered the Cape of Good Hope, created colonies around the Indian Ocean, reached China and Japan, founded the city of Nagasaki, and claimed much of South America. The glory days of the Portuguese empire lasted from 1415 to 1750, and left a rich heritage in Portugal. But geology was the nation’s Achilles heel.
Portugal’s capital, Lisbon, midway along the Portuguese coast, is not close to a plate boundary and is not a place to expect a major earthquake. History decided otherwise. The Lisbon earthquake of 1755 is among the worst disasters to hit Europe in modern times. It devastated the Portuguese empire. Still, many articles, newspapers and even some scientific literature overstate the magnitude, number of casualties, and impact on society; scientific papers comment on the fact that some statements appear exaggerated. Let’s look at the facts.
The earthquake

St Paul’s church, Lisbon, after the 1755 earthquake. http://nisee.berkeley.edu/lisbon/
It came from the Atlantic Ocean, during the celebrations of All Saints day. In Lisbon, Sunday, 1 Nov 1755 was a sunny day, warm for the time of the year. Around 9:35am, gentle shaking started, as from heavy carts, and a rumbling sound came from the ground, lasting about 1.5 minute. A minute later, there was a sudden violent shock: strong shaking lasted 2.5 minute, causing panic. Another minute later, there was another shock, perhaps stronger than the previous one; this time the shaking lasted 3.5 minutes, slowly becoming less violent. These nine minutes left Lisbon in ruins, its population destitute from the immense destruction. All major churches in Lisbon collapsed, killing many of the congregations. Over 80% of the houses were damaged. Deep fractures were left in the city. The first aftershock came at 11am. The aftershocks continued for months and some were themselves violent.

http://www.ezilon.com/maps/europe/portugal-physical-maps.html
Lisbon was not the only place that was badly affected. There was major damage in the Algarve; Faro was almost completely destroyed. Damage in southern Spain and Morocco was extensive. North of Lisbon the damage was considerably less. The shaking was felt across Spain, France and Italy, to about 2500 km away.
There is a detailed and precise report on the earthquake from Cadiz, in southern Spain, 350km southeast of Lisbon. The same three phases were observed with a similar duration (perhaps the last phase lasted a bit longer), but the third phase was notably less violent than the second, whereas in Lisbon they were more comparable.
Tsunami
The population of Lisbon fled to safety, away from buildings. Many went for the harbour. Around 10am, some 30 minutes after the quake, a mountainous wave came up the Tagus river. Within 5 minutes the water rose to a height of 5 to 6 metre; the wave penetrated 250 metres inland impacting especially the western areas of Lisbon. Many boats overturned. A large pier with many people sheltering on it sank and completely disappeared, probably due to liquefaction.
The first wave was followed by 2 or 3 more, over 1-2 hours. The first major aftershock occurred in between these waves. In the midst of the destruction, there was one lucky break: the tsunami hit an hour before low tide, so that the base water level was low and the tsunami was slowed down by the outgoing tide and flow of the river.
On the coast, the harbour of Setubal was swamped by the tsunami with water reaching the first floor of buildings, 6 metre high. Further south, the harbour of Lago was ruined and had to be moved afterwards due to the sediment. Here the waves came over the city walls, 11 meter high: the water traveled 2.5 km in-land. Blocks up to 4500 kg were deposited on the coast. Portimao was badly hit. Faro escaped lightly, protected by a sandbank in front of the city (but this was scant consolation as the city had been destroyed by the earthquake instead). Elsewhere in the Algarve, the highest waves reached 20 metre, perhaps higher. In Agadir, Morocco, the water also came over the city walls. There was tsunami damage on the island of Terceira on the Azores. A 3.5 meter high waves reached Antigua 10 hours after the earthquake. There was damage in Recife, Brazil. In Cornwall, UK, the waves were 3 meter high.
Some reported tsunami heights seem overstated. For instance, for Cadiz, in Spain, a wave height of 17-19 metre is often stated. But the town survived unscathed: as it is 11 metre above sea level, the tsunami was less than that, probably 5-10 metre. Some reports mention very high tsunamis in Morocco, but this is disputed: the wave heights may have been around 5 metres instead.
In the majority of places, the reports state that the water initially rose: there are far fewer descriptions of the water initially receding. That may be related to the fact that it was already low tide, and an initial outflow may not have been noticed.
Elsewhere in Europe, to the north, the earthquake triggered resonance waves (seiches) on lakes, rivers and harbours. They reached 60 cm amplitude in Loch Ness, and were observed from Switzerland to Finland including the Netherlands and Stockholm, and possibly even along the coast of Greenland. There was a seiche in the Forth of Firth, and there may have been coastal damage in Dundee as the waterfront was raised afterwards by 14 feet.
In the UK, large waves were seen along the south coast but little actual damage was reported. Computer models indicate that the region between Penzance and Lizard Point, near the tip of Cornwall, would have been worst affected; elsewhere wave heights were less than 2 meters. The extensive continental plateau around the British Isles disperses the waves and provides a degree of protection against tsunamis. Spain and Portugal lack this protection. However, this protection did not extend to the north: folklore (but no papers) recalls destructive waves in Orkney.
Fire
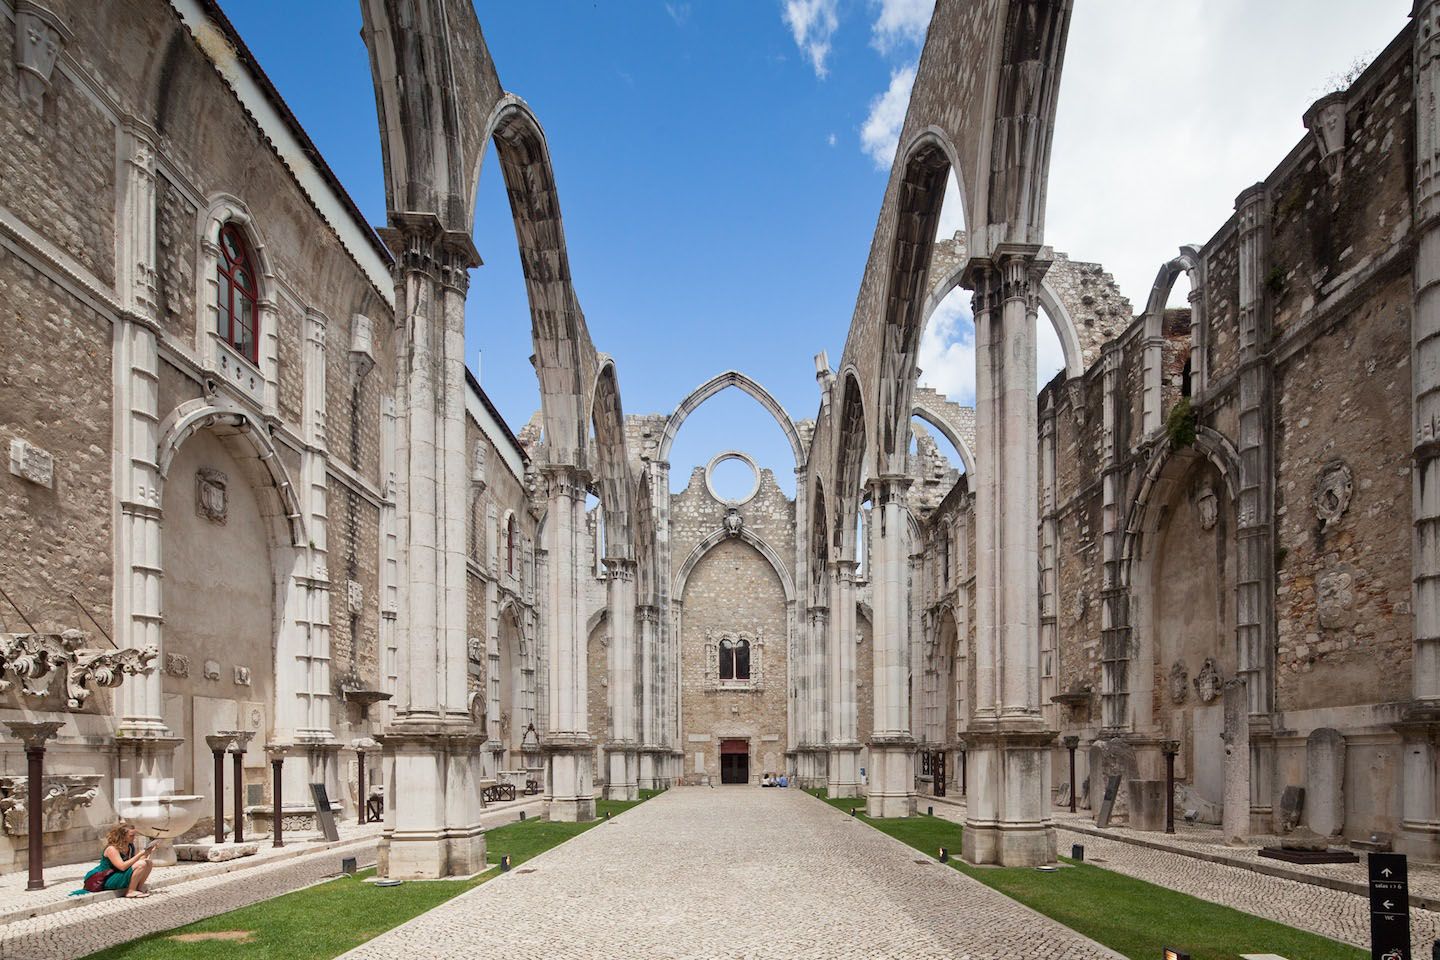
The ruins of Carmo Convent, Lisbon, destroyed in 1755
After the earthquake, fires broke out, some from cooking fires and candles, and some set by looters. These quickly raged out of control and large areas of downtown Lisbon but also surrounding districts burned down. Some buildings which had escaped major earthquake damage, including the Royal Palace and the Patriarchal Cathedral were instead gutted by the fires. Lisbon burned for 5 days. In medieval times, fires were a major hazard for cities as the narrow streets and inflammable building materials made them impossible to control. Once a fire started, chances were that the entire town would burn down, with many casualties. Better control of building materials later improved the situation but city-wide fires remained common.
Lisbon was destroyed by earth, water and fire, but most of the physical damage was done by fire.
Casualties
The death toll in Lisbon is generally given as between 30,000 and 60,000. Recent evaluations of the historical records have suggested that some 12,000 died in Lisbon, close to 10% of the population. Theses studies put the total death toll across Portugal and Spain at 15,000 – 20,000, in agreement with the 14,000 recorded fatalities in Portugal and Spain. The death toll from the tsunami is estimated at 900, of whom 600 were on the sinking pier.
The recorded population in Lisbon fell by just over 31000 people, from before to two years after the quake (these records exclude young children below the age of 7). The decline includes people who moved away from the destruction and it can be considered as an upper limit to the death toll. Portugal was well governed and the records are believed to be accurate. Taking an average of the minimum and maximum numbers gives perhaps 20,000 casualties in Lisbon. The death toll away from Lisbon was likely a few thousand, noting that the badly-hit Algarve was thinly populated. This gives a total estimate of 25,000, a bit lower than commonly quoted.
The number of casualties in Morocco is not well known. The coastal towns were hit but how badly is disputed. There was another, unrelated earthquake in the Southern Atlas mountains on Nov 18 or 19, which although weaker caused destruction and casualties in in-land towns such Fez, and its effects are often confused with the Nov-1 earthquake. Casualties attributed to the Lisbon earthquake may have been very limited, or have been as high as 10,000.
The total death toll of the Lisbon quake is thus in the region 25,000 – 35,000. This was not the deathliest European earthquake in recent history (60,000-80,000 died in the Sicily earthquake of 1908, including 2,000 in the tsunami). But the Lisbon earthquake hit the heart of an empire.
Economy
The economic cost was extreme. In Portugal, it amounted to 40% of the national GDP. This is among the worst on record. For comparison, the 2004 Indonesian earthquake and tsunami led to damages of order 7% of GDP in all affected countries apart from the Maldives. (For those of a curious nature: the direct cost in the US of the 2008 financial crisis came to 15% of GDP.) The 1755 Lisbon event was a human disaster but an economic calamity.
Taxes were increased by 4% to pay for reconstruction and for safeguarding the devastated regions from pirates. Even so, the cost exceeded the capacity of the Portuguese economy. Portugal ceased to be the economic powerhouse it once was. In many ways the events of 1755 signalled the beginning of the decline of its empire.
Characteristics of the quake
The Lisbon earthquake has some unusual aspects. These include the type of damage and the extreme distance over which the seiches were seen.
Multiple reports note how large buildings, such as castles and churches were worse affected than smaller houses. Many of these buildings, supported by arches, did not survive the shaking. Large buildings have low resonance frequencies. Earthquakes bring shaking with a range of frequencies, both high and low, but for this earthquake, the low frequencies (slow shaking) seem to have dominated.
Also notable were the three different phases. The first phase showed minor shaking accompanied by a strong rumble. These were the so-called P-waves (P stands for primary), a sound wave through rock, often heard but rarely felt. P-waves travel at typical velocities of 4-6 km/s and are the first waves to arrive. The second phase would have included the S-wave (S for secondary), which travels about 40% slower. S-waves are much stronger than the P-waves.

Rayleigh surface wave (source: wikipedia)
Reports from ships in the harbour mention how the city seemed to be rolling back and forth. This is typical of a third type of waves, Rayleigh waves. While P and S-waves travel through the rock, Rayleigh waves travel over the surface of the Earth. They give a rocking motion, back and forth, and up and down. Rayleigh waves have a typical period of around 20 sec, longer than S and P-waves which have periods of around 7 sec. A longer period means a lower frequency: strong Rayleigh waves could therefore explain the pattern of destruction, being worse for larger buildings.
Rayleigh waves fade more slowly with distance than other kind of waves: this and their low frequency can explain the seiches seen on lakes thousands of kilometres away, without requiring an excessively large earthquake.
Surface waves are produced in shallow earthquakes. They come in two types, Rayleigh waves and Love waves (the latter rock sideways, a motion not reported in Lisbon). Love waves tend to be absent from oceanic earthquakes. They strengthen from reflections of the Moho separating the crust and mantle, but the Moho is much less pronounced underneath oceans. This indicates that we are looking at a shallow earthquake, somewhere in the ocean, away from the continental shelf.
Houses in Lisbon streets with a south or south-west orientation appeared to have had less damage. These houses supported each other. Thus, the Rayleigh waves came in from that direction. The earthquake occurred somewhere in the deep Atlantic Ocean, south-west of Lisbon.
Finally, the second and third phase of the quake, felt both in Lisbon and Cadiz, were too far apart in time to be different waves from the same event. It is likely there were in fact two earthquakes in quick succession. As the strength ratio differed in Lisbon and Cadiz, the two quakes probably did not come from the same location. The second earthquake may have been a bit closer to Lisbon.

Shaking map of the Lisbon earthquake. Source: Oliveira (2008)
Distance and location
The earthquake happened roughly south-west of Lisbon, and there is no doubt it was out at sea. If nothing else, the tsunami provides a clue! The indications for Rayleigh waves also fit this. The absence of Love waves suggest a location off the continental shelf, in the deep ocean. However, there is a lot of deep ocean in that direction. Can we get an indication for how far away it was?
The image shows the shaking map, which shows that the worst effects were along the coastal strip, from Lisbon down around the tip of Portugal. Between Portugal and Morocco is the Sea of Cadiz. The map indicates that the epicentre would have been to west of this, closer to Portugal than to Morocco.
A first indication of the distance from Lisbon comes from the time delay between the P-wave and the S-wave. Typical P-wave velocities through crustal rock are 4-6 km/s, whilst S-waves travel at 2.5-3.5 km/s. There was a 2.5 minute delay between the two: this gives a distance to the epicentre of roughly 300 kilometre.
There was also a time delay between the earthquake and the tsunami, around 25 minutes for Lisbon. The tsunami travels much slower: a 25-minutes delay is roughly 300 kilometre.

Three proposed locations for the Lisbon earthquake. Richardson et al. 2010 nora.nerc.ac.uk/2767/1/Tsunamis_assessing_the_hazards.pdf
The image shows three proposed locations for the earthquake (it is taken from a study of tsunami risks to the UK). The distance of 300 km from Lisbon is consistent with locations A or B. Location C may be a bit too close to Lisbon although it is not excluded. If there were indeed two earthquakes, they may not have the same location and only one of the two may have caused the tsunami.
Magnitude
The Lisbon earthquake is often stated to have been an M9. This extreme size should be taken with caution. Earthquakes of this size only occur in subduction zones, and there is no such zone south-west of Lisbon (sometimes it is argued that there may be one developing, but this is based on the presumed size of the earthquake and the argument becomes circular). Calculations of the magnitude based on the damage and extent give lower values. The most recent estimate of the magnitude is 8.5+-0.3 (Martinez-Solares & Lopez Arroyo 2004). Earlier authors estimated M8.7+-0.4.

Earthquake magnitude. Black curve: magnitude probability based on shaking. Dashed line: number of earthquakes versus magnitude. Red curve: combined probability curve for the magnitude of the Lisbon earthquake of 1755, peaking at M8.35.
Now consider that weaker earthquakes are much more common than strong ones. If you have a range of possible magnitudes (8.2-8.8, in the first case), it is more probable to be in the lower range as these occur more often. There is a trick of statistics for taking this into account. The black curve in the figure shows the published likelihood distribution for the magnitude, 8.5+-0.3, (assuming a normal distribution). The dashed line shows the probability of an earthquake of a certain magnitude. The actual probability is obtained by multiplying the two: that is the red curve. This reduces the probable magnitude to about M8.35+-0.25, say M8.4.
The 1755 event was thus likely low-to-mid 8. This is just about within the range of what the off-shore area is capable off. M9 would be difficult to explain.
At Fault
There is little doubt that the Lisbon event is connected to the Gibraltar-Azores transform fault, separating the African and European plates. Near the Azores, in the middle of the Atlantic ocean, this fault is clear (see this excellent article for a description), but follow it towards Europe and the fault becomes diffuse: rather than a single fault line: it becomes a series of parallel, short features over a width of 200-300 kilometre. Close to the Azores it is a transform fault, with sideways motion at a snail-pace of 4mm per year. Near the continent the two plates move towards each other. There is no subduction: subduction happens if one of the plates is colder (denser) than the other, and therefore sinks. In this region, both plates have the same age, temperature and density. Like sparring politicians, neither is willing to give way. In the absence of subduction, the region becomes a crumple zone, and tries to form an oceanic mountain range.

Azores-Gibraltar fault. ATJ: Azores triple junction; TR: Terceira Ridge; EAF: East Azores Fault; GF: Gloria Fault; GB: Gorringe Bank (From Bezzeghoud et al 2013).
Some earthquake data suggests a new Africa-Europe plate boundary may be forming, which in the future will replace the current diffuse boundary. In such a complex region, the plate boundary can move, with bits of plate jumping back and forth between Europe and Africa, a kind of continental pass-the-parcel.
The figure above shows the location of recent earthquakes around the Azores-Gibraltar fault, and is taken from Bezzeghoud et al 2013. An earthquake-free zone is visible between 24 and 18 degrees longitude: this gap is the seismically inactive Gloria Fault (GF). East of this, from 18 to 11 degree longitude, the Gloria Fault enters a complex region which has relatively frequent major earthquakes, include an M8.4 in 1941, M7.8 in 1969 and M7.0 in 1975. Around the Gorringe Bank (GB), the fault becomes indistinct and deformation is spread out over a width of 300 kilometre: this is the diffuse region. While elsewhere along the fault the earthquakes are shallow, in this region they extend to 150 km depth.

The Gorringe Bank region. Taken from Claudio Lo Iacono et al. Geology (2012), 40, 931-934
The Gorringe Bank (sometimes called the Gorringe Ridge; it is named after the discovery in 1875 by Captain Henry Gorringe) may be a crucial part of the story. Whereas elsewhere the two plates slide along each other, with varying degrees of violence, here the earthquakes indicate a head-on collision. In the absence of subduction, there has been as much as 50 kilometres of crustal shortening and folding. An underwater mountain chain has formed; two of the seamounts, Gettysburg and Ormonde, reach to less than 100 metres below the sea surface. (During the ice age parts of it would have been near the sea surface, and perhaps wave erosion have affected the peaks.) To the north is the Tagus abyssal plain, 5100 meter deep, and to the south is the Horsehoe abyssal plain, only slightly shallower. The latter is where the Gloria Fault would run had it been well defined, and is the location of most of the large earthquakes. Remove the sea, and the Gorringe Bank would be the second tallest mountain chain in Europe, taller than the Alps! At the northern edge of the Gorringe Bank runs the Gorringe Fault.
Early reconstructions assumed that the Lisbon earthquake occurred in the Horsehoe plain, where the 1979 earthquake was located. But the timings of the tsunami do not quite fit, and they favour a location a bit north. That would place it in or near the Gorringe Bank. But this is also problematic as the Gorringe Bank appears inactive. A third possibility is the MPF (Marques de Pombalt Fault), but this seems too small for such a major quake. It has been suggested that the MPF extends further north, perhaps connected to the Lower Tagus Valley fault (underlying Lisbon), and that the region in between snapped. Finally, a horizontal fault plane has been suggested underlying the region. The strongest argument for this is a lack of evidence against it! It is perhaps a bit worrying that 270 years after one of the strongest and most destructive earthquakes in modern Europe, the fault which caused it has gone in hiding.
Part of the solution may come from the study of the tsunami wave heights in the Americas. These are quite dependent on the location and orientation of the fault. Detailed modeling has shown that it is not easy to get strong tsunamis in the Caribbean from Spain. The only model that predicted this is one with a NE-SW fault within the Horsehoe plain. None of the quake models mentioned above have this! An ancient transform fault may have existed here dating from the opening of the Atlantic, but there is no reason to assume that such a 100-million-year old fault remains active. Ancient faults, like old-age pensioners, should enjoy the modern world, not try to reshape it!

Tsunami height models for the Americas. From Barkan et al. 2009
The longest fault in the region is the Horsehoe fault, at 120 km length. Other faults are no more than 100 km long. The largest earthquake that can be expected from the Horsehoe fault is M8-8.3. This fits our estimated magnitude of the Lisbon earthquake of 8.4+-0.3. Larger quakes are difficult to get within this fault system, unless several faults rupture simultaneously.
The fact that Lisbon experienced two separate jolts is often ignored. This may not have been a single quake, but two in quick succession. There may be more than one smoking gun on the sea floor.
A fault ruptures at about 2 km/s, about the same as the speed of the S wave. If the fault was pointing towards Lisbon, the total duration of the earthquake is the time of rupture, plus the difference in travel time between one side and the other. That gives a rupture length of 60-120 kilometres, in good agreement with the known lengths of faults in the region. Do remember that you would need two.
Tectonic heritage
The Iberian peninsula, encompassing Spain and Portugal, has been a semi-independent plate. 40 million years ago it was attached to Africa, south of a spreading ridge, now extinct, in the Bay of Biscay. Later Iberia separated from Africa, rotated 35 degrees counter-clockwise, and attached itself to Europe. This plate-jumping was part of the closing of the Tethys Ocean and formed both the Mediterranean and the Pyrenees. The fault line separating Africa from Europe jumped south to accommodate the changing allegiance of Iberia. This jump, and Iberia’s rotation, may have left fractures behind.
Risks for the Future
Recurrence times for intraplate quakes are long. For the 1755 quake, the recurrence time has been estimated as between 1000 and 10,000 years. Older coastal tsunami deposits have been found along the Algarve, similar to those left by the 1755 tsunami, approximately dated to 2400BC and 6000BC. This gives a recurrence time of perhaps 4000-5000 years. Smaller tsunamis are more common in the region, however. Under-water studies have found turbidite (deep sea mud-flow) deposits, as could have been generated by large earthquakes. Both the 1969 and the 1755 event have left well-dated turbidites. Earlier ones have been dated to 218 BC, 3010–3960 BC and 7765–8065 BC. Turbidites indicate a recurrence time of 1800 yr, but not all of these will have generated major tsunamis.
There is evidence for a large landslide on the northern edge of the Gorringe Bank. It left a scar 2 kilometer deep, leaving a hole of 30km3, and has been carbon-dated to 30,000 years ago. It is not known whether this caused a tsunami but it could have caused destruction across the Atlantic.
Further faults of Lisbon
This was not the first devastating earthquake to hit Lisbon. The Tagus river follows a fault line, and large earthquakes can and do occur along it. In 1531, the city was hit hard, when an earthquake along this fault struck the centre of Portugal, east-northeast of Lisbon, with an estimated magnitude of M7. The main shock occurred on 26 Jan, early in the morning; there had been two precursor shocks earlier that month. A third of the city was destroyed, and the shaking caused flooding in the Lisbon estuary, possibly due to a landslide in the river. Some reports suggest that the housing stock may have been worse affected than in the 1755 event. If correct, apart from a lesser quality of the houses, it may also mean more intense high frequency vibrations. There was also a severe earthquake in 1321, again with widespread destruction, and other significant quakes occurred in 1147 (also leaving the city, just captured from the Moors, in ruins), 1334 (destroying the cathedral roof) and 1356. In 1909, a quake hit north-east of Lisbon, with a magnitude of 6.5. Since 1909, the region has been seismically calm.
There have been many discussions of the chances of a re-occurrence of the 1755 event. But such an event may only occur once every 5000 years or so, leaving the next one a long way off. A more immediate danger is a potential repeat of those medieval quakes. Lisbon is a beautiful city – but it is built in a dangerous place.
/Albert Zijlstra
References
Thanks to Iain McDonald for unearthing the impacts of the 1755 tsunami in Scotland.
-Review of the 1755 Lisbon Earthquake Based on Recent Analyses of Historical Observations. C.S. Oliveira, 2008, in: Historical Seismology. Modern Approaches in Solid Earth Sciences, vol. 2, p 261-300
– The effects of the 1755 Lisbon earthquake and tsunami on the Algarve Region, Southern Portugal. David K. Chester, University of Liverpool
– The Historical Review of the 1755 Lisbon Tsunami. Angela Santos, Shunichi Koshimura. Journal of Geodesy and Geomatics Engineering 1 (2015) 38-52
– Tsunamigenic earthquakes in the Gulf of Cadiz. L. Matias et al. Nat. Hazards Earth Syst. Sci., 13, 1–13, 2013
Large, deepwater slope failures: Implications for landslide-generated tsunamis. Claudio Lo Iacono et al. Geology (2012), 40, 931-934
– Seismicity along the Azores-Gibraltar region and global plate kinematics. M. Bezzeghoud et al., Journal of Seismology, (2014) 18:205-220
Far field tsunami simulations of the 1755 Lisbon earthquake: Implications for tsunami hazard to the U.S. East Coast and the Caribbean. Roy Barkan, Uri S. ten Brink Jian Lin, Marine Geology 264 (2009) 109–122
– Holocene earthquake record offshore Portugal (SW Iberia): testing turbidite paleoseismology in a slow-convergence margin. E. Garcia et al, Quaternary Science Reviews 29 (2010) 1156–1172
The great historical 1755 earthquake. Effects and damage in Spain. J. Martinez Solares, A. Lopez Arroyo, Journal of Seismology 8: 275–294, 2004.
– The 1755 Lisbon tsunami; evaluation of the tsunami parameters. M. Baptista et al., J. Geodynamics Vol. 25, pp. 143-157, 1998
– Earthquakes and tsunami in November 1755 in Morocco: a different reading of contemporaneous documentary sources P. Blanc, Nat. Hazards Earth Syst. Sci., 9, 725–738, 2009


Fascinating! Thank you Albert!
Very nice to remember this on All Saints’ Day today. Thank you.
Surprising is though that 80% of the city was destroyed, but only 10% died. I wonder whether the death toll is not precise enough. Children, women and servants might have been undercounted. Lost work force was noted, and well, that was mostly men.
In a comparison between the Lisbon and the Messina Earthquake it should be considered that calculations might have been more precise some ~ 150 years later.
This Gorringe Ridge as an origin makes perfect sense if we think of earthquakes in the Himalaya. It is lower, but the mechanism is the same: continental-continental collision.
Many of the houses were destroyed not in the earthquake but by fire. The people weren’t in the houses when the fires broke out. But number of casualties is notoriously difficult to judge for the past.
Your use of the word “inflammable” sent me to the dictionary. Flammable building materials? Inflammable building materials? What’s the diff?
“…two words that look like antonyms but are actually synonyms.” The English language strikes again.
Thanks for that and another fascinating article, Albert.
I love hyperbole.
Deep Beneath The Pacific Ocean, Earth’s Crust Is Tearing Itself Apart (Science Alert, 1 Nov)
This is about the Juan de Fuca plate subducting. Which will take a while to complete. Imagine, if you will, a train derailing over a million years. Science journos are fun.
Sorry Albert, but this article is frustrating to me. Do we really know the exact location where the earthquake(s) occurred? There seems to be too much guesswork here. I am hoping that more research occurs to uncover what really occurred. (no, I am not talking about people writing about their horrific experiences)
The general location is known, just not which particular fault segment(s). The fault at fault is likely quiet now: it will take a long time to rebuild the stress. We know it was not a subduction quake. The tsunami suggests (but does not proof) that it wasn’t a pure transform motion. That points at the area listed in the post, where there is a compression component. There are other places in the world where we need to know more about hidden faults: off the coast in Lebanon where major quakes have happened, in the sea off Istanbul. What they have in common is transform motion along a plate boundary. There can be side shoots of such faults, or parallel segments, and these can spring surprises. The particular one from 1755 is not a concern at the moment, but which others are there? But Lisbon is more at risk from the in-land faults in the region, and that is where the research should focus.
Owen fracture zone?
https://en.wikipedia.org/wiki/Owen_fracture_zone
Very slow. I don’t know the earthquake history here!
Was sourthen Portgual with its westerly winds a relativly mild refugia during the LGM? where human hunter gatherers and tribals coud shelter, was there any snow in winter?
Thanks for this study Albert!
The apocalyptical earthquake influenced many philosopher of Enlightment who sought for answers about this. It happened in a time, when the interior of planet Earth was unknown. Philosopher Immanuel Kant tried to explain the origin of earthquakes with subterranean caves filled with hot gas. It took many steps of natural philosphy and early pre-Geology sciences until they got evidence about the hot fire planet on which we live. Alfred Wegener’s theory of continental drift is only 110 years old, and also this theory needed 50 years to be finally accepted.
Perhaps the birth of seismology?
Agreed: I remember being in ‘upper school’ when the definitive ‘plate tectonics’ paper was published. Our younger geography teachers went out and got drunk to celebrate the new paradigm. The older teachers held a wake for the old ways, to mourn the up-ending of their ‘classic’ text books and curriculum…
‘Syncline & Anticline: The sea comes in, the sea goes out, but we do *not* know why…’
—
FWIW, with the Carib arc ‘trench’ evolved unto volcanic , the ‘Drake Strait’ and ‘South Sandwich’ region remarkably ‘quaky’, having a new subduction zone *perhaps* develop off Lisbon / Gibraltar is fascinating…
That subduction zone will to wait a bit. The Atlantic ocean isn’t old enough yet to subduct. Perhaps another 50 million years is needed. There is some subduction in the Mediterranean, and of course in the Caribbean, in the Tethys remnants.
I have to rely on science journalists and popular science sites to interpret this stuff for me!
Lisbon 1755 (long periodicity) is mentioned in the relevant context, here –
https://www.livescience.com/planet-earth/rivers-oceans/sleeping-subduction-zone-could-awaken-and-form-a-new-ring-of-fire-that-swallows-the-atlantic-ocean
Millions of years, what biological life-forms will be present?! 😲
Sadly, the paper this story is based on cannot be read because of paywalls. Geology does not believe in open science. But it seems to be based on the subduction zone that existed briefly in the western Mediterranean, west of Sicily. That slab of Tethys open floor subjected westward, somehow rotated 180 degrees and ended up underneath Gibraltar. It is not related to the Atlantic Ocean but extends slightly beyond Gibraltar, south of Portugal. It is a relic, and not active. This paper seems to suggest that it will move further westward, but since the subducted block is already vertical, that probably is just Europe moving a bit eastward. (I can’t check: the paper is unreadable.) There as talk about subduction along the Southwest coast of Portugal, but that based on the 1755 earthquake being M9 and therefore had to be a subduction quake. That argument no longer holds as the estimates for the magnitude of this quake are much lower nowadays – still M8 (the lowest is I think M7.8) but at a level where subduction is not needed.
Acceptance of continental drift was patchy. I know the US thought it absurd, in the UK it seemed to be ‘common knowledge’ in my youth the only problem was a mechanism, which people looked for. The geological evidence is completely unarguable.
Its a difference in conceptual belief. One says its wrong until proven right (mechanism included) the other says this is the best theory but with gaps that need filling.
I fall into the latter department. Sometimes the evidence gets to the point when you question the current theory, dark matter (&etc) being a case in point, with so many parallels to phlogiston its uncanny.
Some smart people discovered very early, centuries before Alfred Wegener that Africa and South America look like two pieces of a puzzle. 1596 Abraham Ortelius was one of the earliest cartographers who discussed it. But they were still tied to the biblical Flood Myth and a geological time frame of 5-6 thousand years. Even after secularization of science and a longer assumed geological time they discussed flood events as the reason for the divorce between Africa and South America during 19th century.
However, from end of 18th century we can observe the typical progress of science by assumptions, failurs and confirmations.
I recall having read something about the AZORES-CAPE ST. VINCENT RIDGE being involved in the Lisbon earthquake. But that was quite a while ago…
Just checked via AI. Remember having read an article about that in Portuguese when traveling to San Miguel.
“Seismicity
Frequent earthquakes: The region has a high level of seismic activity, with small earthquakes occurring frequently.
Historical events: The area is noted for some significant historical events, including the 1755 Lisbon earthquake, whose magnitude was estimated to be about 8.0.
Largest recorded earthquakes:
1931 earthquake: A magnitude 7.2 earthquake occurred in the Azores-Cape St. Vincent Ridge on May 20, 1931.
2007 earthquake: A magnitude 6.1 earthquake occurred in the region on December 2, 2007.
Recent events: As recently as July 2025, a magnitude 5.8 earthquake was recorded in the area. ” – Google’s AI
It was definitely on this fault zone which is the transform fault that separates the Eurasian and African plate between Spain and the Azores. Within that zone, the Gorridge Ridge (close to Portugal) is the likely origin. Because of a bend in the zone, the transform motion has caused compression here an raised an enormous (but submarine) mountain range,
Note there were two events, so possibly two of the segments failed. There was another event in 1761 which may have been a bit closer to the Azores, based on reports of how it was felt in various places.
At Lamorna Cove in West Cornwall one of four tsunamis threw boulders 3m above the high-tide mark. There are still very large boulders high on the beach, but its not clear how many of them are still where the tsunami left them or if they have been moved by later storms which hammer that part of the coastline.
There’s a nice paper on tsunamis and the UK at:
https://www.researchgate.net/publication/26641044_Historic_Tsunami_in_Britain_since_AD_1000_A_Review
I’ve read that the “Storegga Slide” caused a tsunami which finally, allegedly, did away with Doggerland.
Evidence has apparently been found in Scottish sediment layers.
Doggerland really piques my imagination. In future it seems inevitable that here we’ll lose even more territory. I wonder how that will be accommodated and managed. Netherlands, crikey!
There is a bit (brief!) on Doggerland in https://www.volcanocafe.org/the-north-sea-and-the-zuidwal-volcano/
Albert – I should comment about your nice article. My impression is there is a nascent subduction zone to the SW of Portugal. If it gets its subductive boots on it will join the subduction zones south of Cyprus, Crete and Italy as Africa continues to move north. One wonders how long until Portugal and Morocco merge together, and the Mediterranean will be no more.
That zone is further east, in the Mediterranean and the Straits of Gibraltar. It is inactive, presumably because there is very little old ocean floor left there. There was a paper last year that claims that the zone could extend into the Atlantic Ocean in 20-50 million years.
The actual mechanisms of subduction zone formation are very difficult to pin down. New ones haven’t begun in a long time and since, by definition, they form at the bottom of oceans it’s extraordinarily awkward to explore the detailed geology down there.
Theories I’ve seen indicate that a substantial length existing crustal weakness needs to already be in place for a subduction zone to start. An ocean edge transform boundary for example. Then ocean crust of suitable age and density needs to be there as well. As for what happens next to actually get it going? Good question.
I’ve heard mention of an incipient subduction zone off of Haida Gwaii (British Columbia, Canada). A magnitude 7.8 thrust earthquake occurred in the region in October 2012, and this event prompted research into the configuration of the plate boundary in the region, which found the Pacific Plate underthrusting beneath the North American Plate in (potentially) an incipient subduction zone. One of the more recent papers is Brandl et al., 2025 (“Seismic imaging reveals a strain-partitioned sliver and nascent megathrust at an incipient subduction zone in the northeast Pacific”).
Interestingly, an ocean-edge transform boundary, the Queen Charlotte Fault, is there. Prior to 2012, it was believed that major earthquakes in the Haida Gwaii area would primarily be of the strike-slip variety, similar to what is seen along the San Andreas fault system in California; a major thrust earthquake was somewhat unexpected to my understanding.
Speaking of British Columbia, albeit further south in the Cascadia subduction zone, they really need to take a look into any potential fault lines in the Vancouver area. I suspect local crustal faults would exist there, but to my knowledge, they have yet to be mapped. The rapid change in elevation from the Fraser Delta and Burrard Inlet to the North Shore Mountains feels somewhat suspect in itself, especially when considering northward motion in the Cascadia forearc; several east-west oriented faults exist because of the “crumpling” the northward motion produces, most famously the Seattle fault zone. In fact, just before the 2012 Haida Gwaii earthquake, geologists had discovered three crustal faults between Bellingham and Blaine (Kelsey et al., 2012); the Drayton Harbor Fault, the Birch Bay Fault, and the Sandy Point Fault. USGS ran a simulation of a M6.9 event along the Birch Bay fault, which had MMI 7 shaking reaching the central city area of Langley, BC; Ferndale, WA, closest to the fault rupture, would see MMI 8.5 shaking per the simulation. A fault like that directly beneath Metro Vancouver itself would spell a lot more trouble than the Birch Bay scenario, and the Kelsey paper mentions the possible existence of faults beneath Metro Vancouver as a potential future area of research.
The southern QCF certainly does have a significant thrust component to its motion.
As for the Yakime Fold and Thrust Belt? Oh yeah. If an earthquake goes off on the Seattle Fault or an equivalent for other metro areas such as Victoria, Vancouver, Surrey, Bellingham, Olympia, Everett or Tacoma goes off then those cities are in for a world of hurt. Not just a shallow, large earthquake; but a shallow, large earthquake with considerable vertical motion component underneath a large body of water. Tsunami time!
I’ve been away with the fairies but am trying to return to harsh reality and catch up with The Cafe.
What a terrific community lives here. I wish the “real world” was like this.
Anyway, thank you Albert for the Lisbon 1755 article.
I remember reading about liquification during that event, but I now can’t find any info. (Perhaps I have missed it in the Cafe.)
But I did find something I’ve never before read about; aquifers –
https://agupubs.onlinelibrary.wiley.com/doi/full/10.1029/2019JB017753
Exerpt, aquifer effects, (from Lisbon 1755):
“groundwater and spring anomalies were even recorded in America (Figure 1; Martínez Solares, 2001).” ….. crikey!!
In 1755, no charity or State agency was distributing bottled water. The whole ghastly event is beyond my imagination, but maybe it compares with poor post-Melissa Jamacia.
Marc Szeglat naturally writes much about European events. I learned from that vlog about Laacher See and it’s surroundings, so interesting.
Also according to him, Campi Flegrei isn’t really settling down, but he’s been referencing the slew of recent research published. The local authorities are conducting part of the potential evacuation plans on Nov. 4-5th. So that’s good.
“Nine out of ten potential eruptions do not happen”, so I hope Campi Flegrei behaves nicely.
Marc, being a journalist, seasons his writing with a bit of sensationalism, I see it but take it as a bit of entertainment, haha.
I was surprised by the essay that there is no subduction zone. Where does the subduction zone between Africa and Europe end? It is somewhere between Greece and Turkey, also in the Aeolian islands (Lipari, Stromboli, Vulcano) and along Italy.
So the Triple Point of the Azores is not a meeting of divergent and subduction zones, but of a divergent and orogeny zone. What does this mean for the behaviour of this triple point?
Goma is growing at alarming speed! wider and broader and very quickly towards the volcanoes as well, the next Nyiragongo lava lake drainout coud perhaps happen in 15 years so it does not bode well for the expanding cityscape. Woud be good if we coud get the first closeup shots from the both craters for the first time since 2021
https://earth.google.com/web/@-1.64977293,29.23388971,1559.45157091a,6651.29460119d,35y,8.92019948h,27.02430507t,0r/data=ChYqEAgBEgoyMDA2LTAzLTI0GAFCAggBQgIIAEoNCP___________wEQAA
2006
https://earth.google.com/web/@-1.64977293,29.23388971,1559.45157091a,6651.29460119d,35y,8.92019948h,27.02430507t,0r/data=ChYqEAgBEgoyMDIzLTA3LTIyGAFCAggBQgIIAEoNCP___________wEQAA
2025
https://browser.dataspace.copernicus.eu/?zoom=13&lat=-1.44515&lng=29.22483&themeId=DEFAULT-THEME&visualizationUrl=U2FsdGVkX1%2BBKSi2wjwiOTbkArbb7ix0piOPUtUeE6vk8j3Ty%2FHAnBYndR7pmxcP0HdCNe9tktzmZXZ9JHu%2FLN8hcquCQ3ZjydwVQAsHc7yDH1bW4TmsTyXmBzwvvj8g&datasetId=S2_L2A_CDAS&fromTime=2025-11-02T00%3A00%3A00.000Z&toTime=2025-11-02T23%3A59%3A59.999Z&layerId=1_TRUE_COLOR&demSource3D=%22MAPZEN%22&cloudCoverage=30&dateMode=SINGLE
Recent space shot of Nyiragongo and Nyiramuragira massive gas plumes
https://earth.google.com/web/@-1.65926974,29.25733757,1602.38336771a,0d,48.69009572y,349.807292h,100.01964413t,0r/data=CgRCAggBIhoKFmdqM3dNQkhsM2NGcUFRdENFQlV0TlEQAkICCABKDQj___________8BEAA
Goma less developed outskirts with impressive volcanic pyrocumulus condesation and acid rainfall virga, showing very well how much heat these two open vents are constantly generating non stop!
Albert when do you think there will be next summit expeditions to these two volcanoes? any forecast?
It is a war zone. That means no scientists, just tourists. Satellite monitoring will continue though
This may sound a little late to the party, but at 12:45 AM Hawaii time, Kīlauea’s north vent has overflowed. Countdown to episode 36 has begun then. (It has experienced at least 3 more overflows since).
The overflows do not seem as energetic as before – yet. There is also more sulfur deposition visible, which in Reykjanes happened when the degassing became cooler. I would guess we are still a few days from the next episode. Perhaps.
Vulkane.net has weighed in with a discussion on Mauna Loa, most of the points have been touched upon here but they repeat in so many words that there’s more magma stored than before the 2022 eruption.
After 2022, I thought ML was done for the remainder of my lifetime. I suppose it’s too much to ask for another period similar to 1843-1950!
Recently, there has been some swarming over the north flank that has caught my attention. I have now checked the HVO page, and it shows microseismicity over the caldera and pit craters area ramping up over the last 2 days. These seem to be the first signs I’ve seen that Mauna Loa is becoming overpressurized. Combined with the accelerating inflation over the past few months, then an eruption within a few years is not unlikely (but I imagine more than two years away). It’s also likely this time it will erupt further down the rift zones.
Exciting times for Hawaiian volcanism…
Mauna Loa used to erupt very frequently. That changed after 1950. Before that, it was common to have eruptions within a few years of each others. It is difficult to predict how soon it could erupt again, but based on past behaviour that could even be quite soon. (That is not a prediction!) Would it affect the on-going eruption of its neighbour?
Only from 1843-1950 Albert. Before 1843 the last eruption was in 1809, unobserved. Between 1700 and 1843 there was only maybe 3 eruptions, maybe a few more but the intervals were wide, 1700 was when Mokuaweoweo formed, or close enough. The 1950-now era isnt unusual just the 0 point started while it was very active.
If the 2022 eruption is now starting to be fully recovered, about 3 years later, it implies a supply rate of 50-80 million m3 a year, as 2022 was about 0.25 km3 of magma leaving the summit. Which is about 22% to 36% of Kilaueas supply at the same time. Kilauea isnt about to stop so this might be the best evidence the alternating behavior of the two volcanoes is probably not real, Mauna Loa now might be as active as most of the 1840-1950 era.
It also means the supply rate to Hawaii is likely around 0.3 km3 a year, for at least 3 years…
It seems that the 18th century was all in all on Hawaii less productive than 19th and 20th century. There is likely a varying activity of the hotspot. Centuries with higher productivity and centuries with lower productivity (just like Reunion is a bit lower now). This variation of general Hawiian up and down overlaps the dynamic development between Kilauea and Mauna Loa.
Kilaueas entire ERZ was resurfaced in the 18th century. About 2 km3 of lava. Potentially its caldera also mostly filled in, and the 1790 collapse would have been enormous. Its not unlikely the collapse was as much as 10 km3, with an equally big eruption out on the Puna Ridge. Its possible the massive flow at the very tip of the ridge is from 1790, without dating its unclear. Keep in mind this eruption is theoretically only maybe 30% smaller than Laki, and in the same decade… 🙂
Mauna Loa also probably wasnt totally quiet, it likely erupted in Mokuaweoweo, and did erupt apparently at a tiny radial vent on tbe northwest side in 1730, so might have filled up Mokuaweoweo at least some way within decades of its formation. Mokuaweoweo also probably formed after 1700 so it counts, 3 km3 Hapaimanu flow on the SWRZ under Ocean View.
Hualalai also erupted the the Kaupulehu flow in the second half of the century, about as big as Mauna Loas 2022 flow.
So 18th century was probably not lower, just the big event at the end was out of sight.
Mauna Loa hasn’t done a summit eruption yet since 1949. If we assume that SWRZ, summit and NERZ have a certain share of eruptions, sooner or later the summit has to get its eruptions again.
2022 the eruption belonged to the subtype of NERZ which sends lava flows towards the Mauna Kea saddle (Humuʻula Saddle). This subtype of Humuʻula Saddle eruptions happened in late 1935 to Jan 1936 and 1899. After these eruptions the dormant period lasted for 4 years in both cases. The subsequent eruptions were in both cases summit eruptions (1903, 1940) that lasted for 62 days 1903 and 164 in 1940. 2022 the eruption began on Nov 28th, 1935 on Nov 23. Very close to each other. 1935 the eruption lasted for 40 days, so longer than the 13 days 2022. This difference shows that 1935 Mauna Loa had higher magma supply than 2022. It means that also the next eruption will likely be smaller than 1940.
Based on the historical data only we can predict a summit eruption 2026-2027, if the pattern after a Humuʻula Saddle eruption is going to be repeated again.
Problem is it did erupt at the summit in 1975, 1984 and 2022, it just didnt stay there. The 1935 eruption was also long because it had a low altitude flank vent onorth of the rift, 2022 didnt do that. The eruptions were very similar otherwise.
Im not so sure there is actually any patterns to Mauna Loa though. Its erupted on the NERZ 3 times in a row now. And 1907-1926 was 4 SWRZ eruptions punctuated by 1 summit eruption and no NERZ eruptions.
I’d define a “summit eruption” on Mauna Loa as one, in which the overhelming volume is ejected on the summit and the eruption lasts for at least three days.
Ususally each major eruption of Mauna Loa has a certain point, where the eruption chooses to stay for 90% of the time span of the eruption. There are serveral different areas which can get this point of eruption. The summit is one of them. It has to get one major eruption again, but it is difficult to predict the point in time when it will be again. But we had two historical examples, when a major summit eruption happened after a Humu’ula Saddle eruption. They show that this link is possible and has an elevated probabitliy.
If I had to guess, Mauna Loas current tectonic situation probably makes it really hard to stay at the summit. Supply rate is probably relatively low and the magma chamber is large and seemingly elongated along the rift axis and this might make it hard to erupt slowly at the summit. In the 30s and 40s, Kilauea was very quiet, so Mauna Loa probably had all the supply most of that time.
We have to look for eruptions towards the Humu’ula Saddle during quiet periods of Mauna Loa. How did the next eruption look like?
The only historical example is the eruption of 1843 towards Humu’ula Saddle, when Mauna Loa still was relatively quiet. After it followed a summit eruption in 1849 that lasted for at least 27 days. The table says “No lava flow or earthquakes reported, only a lofty column”. Maybe during quiet periods Summit Eruptions happen without significant volume of lava, f.e. a passive lava lake, Strombolian lava fountains, unusually strong Fumaroles.
Kamchatka is rumbling again, with a new earthquake swarm. Probably still aftershocks.
The aftershock swarm turned out to be a foreshock warning. There was an M6 this morning, small for the region but following the pattern in this area of foreshock events.
Kilauea has growing amplitude on GPS monitoring:
The growing cone and shield inside the caldera means that the force, that is needed to make an eruption again, has to grow as well. So inflation before the onset of an episode grows with the number of episodes, and the deformation during the episode also grows with the number of episodes.
Episodical eruptions of the summit caldera are likely different to those on Kilauea Iki, Mauna Ulu and Pu’u O’o. Summit eruptions are limited by gravity, while the others are limited by the supplied total volume of magma for the eruption.
Thanks for the article (don’t mind at all that it’s republished). I was completely oblivious to the existence of the Lisbon earthquake until I visited in 2017. They say the tsunami and fires from toppled candles were the worst parts of the disaster.
In my current neck of the woods, there’s this: https://earth-planets-space.springeropen.com/articles/10.1186/s40623-020-1139-y
That bright red NW-SE axis has been the location of several M5-6 earthquakes over the past century, most recently in 2018. All faults there remain small and subsurface to my knowledge. I’m curious how this area will evolve across geologic time and what effects there will be on nearby volcanism. In a land of old, scary faults and boundaries, a fresh one may be being born!
At 1:38 AM Hawaii time, the south vent at Kīlauea has begun to overflow.
Those are some pretty lava streams on the V3 cam!
Meanwhile the north vent overflows are starting to become a bit more powerful. Last one also happened in sync with the south vent, but that’s probably just coincidence.
Birthday 29th october present: an OLED computer monitor! OLED displays are known for perfect blacks, perfect contrast and true color through self-emitting pixels. No annoying blue backlight at all. Gift from partner: indeed there is no lcd backlighting whatsoever; the pixels themselves glow, emitting light. When a pixel is turned off, the local screen goes completely black, providing exceptional color, contrast, and darkness. Volcanic eruptions, astronomy images, fireworks and video games really POPS with color and contrast on these types of monitors I also haves it on my phone. Episode 36 will be a joy through this very special technology, 4 layers non organic OLEDs are also in developments
Looking at a space image in this is like looking at into another world! thats how magical OLED s really the Eagle Nebula really really pop this is a magical experience and just the same with night videos of volcanic eruptions overall the color and blacks are so much better than my old LCD
These screens are completely magical episode 36 and reykjanes next eruption will be a JOY for me to see through the perfect self emission pixels of my OLED screen… this is absolutey magical to experience on a large screen and not only my phone 🙂
Oled pixels are also round and that smoothes the image, so 4K gets a very retina like and life – like apparence seen from distance Google Earth looks better than ever really, this was a fabulus 30 years present 🎁
Yes, Jesper. I have an MSI OLED screen. It looks lovely, but pixel failure, on-board software that has a mind of its own, and trying to avoid burn in are hazards! Enjoy the screen but give it lots of love and care.
Thanks for reposting this article, I am enjoying it as much as I did the first time.
Looking at Azores volcanoes, it seems there is low and slow but long duration rumble at Sta. Barbara on Terceira. My understanding is if there is eruption it is more likely underwater. Is there any info about the current swarm?
https://sismos.civisa.azores.gov.pt/
Geologyhub covered it a few weeks back:
https://www.youtube.com/watch?v=5wvkcK6dh0s
It seems that the most likely locations for an eruption would either be at the summit or out west in the ocean.
Maybe a little music will purge Kilauea of that old lava.
https://www.youtube.com/watch?v=es0iSQPxdIA
Mac
Some nice footage from our VC colleague Mike Ross’s agency. Especially from about 30 seconds into the vid. They did an overflight of the volcano on Monday.
https://www.youtube.com/watch?v=GMI_GGImkz4
From Geonet’s activity report yesterday.
Looks like the pulses at the south vent at Kīlauea are starting to increase, although this doesn’t mean it’ll lead to the start of Ep. 36, although getting close. The fact that the north vent also overflowed is interesting, as before Ep. 35, only the south vent overflowed (also maybe north vent, although the overflows are minor compared to current before south vent took over). Once the north vent gets going again, that would mean Ep. 36 is starting and this one could get exceptional.
South vent has been overflowing almost continuously for several hours now, with only a few shorter breaks. Now V3cam has been adjusted for a better view, and for camera exposure, and it’s beautiful!
Episode 36 seems to be just around the corner.
Is it just me or is the south vent intensifying its “pulse”? I might take back what I said about the north vent…
No, not just you. The flow is currently massive and the dome fountain seems to be trying its best to change into a proper fountain. This is probably the final push before it sets off.
I could be proven wrong in the next twenty seconds, but maybe there’ll not be a high fountain this time? The volume seems to be as big as during the other episodes at their peak.
Gas rich magma seems to be coming up now. The dome fountain is breaking up in foamy cascades. Buckle up and bring the popcorn, it’s showtime!
Or maybe not. Nothing to see here, move along.
… yet.
Speaking of which, the lava pond at the north vent has returned at the rim. That intense south vent pulse could be a precursor to something else here.
Jesper pointed out to me in a private chat that the tilt started to drop during that last overflow. That’s how massive the flow really was. It has now returned to inflation again. It will be interesting to see what happens during the next overflow. It the same thing happens again, then maybe we could be in for a period of shorter cycles and massive overflows instead of high fountains. Just like Fagradalsfjall did in 2021.
Still building up, it seems. The lack of fountaining indicates that the gas content wasn’t yet high enough. It is now taking a breath before trying again.
And another try. A bit of pulsing now. The flow is so strong that the magma drowns the gas. Perhaps if the flow reduces a bit, the gas can break up the magma and make a proper fountain
Not this time either. And again a similar drop in the tilt. There was a net tilt drop between the start of the first and the start of the second large overflow. Is it being held back by a DI event?
Looks like another try starting at 8AM HI local time, fairly hefty doming at 8:22 but not seeing any gas yet
And at 8:54 everything drained back in in under 30 seconds…
10:20 back at it again. Still no fountain by 11
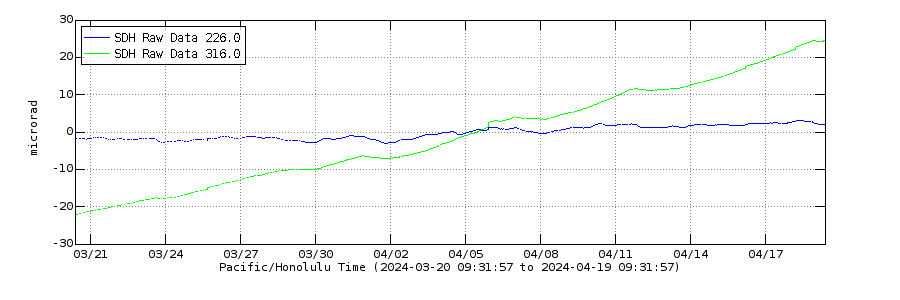
Deformation hasn’t reached the level of previous episodes yet. The main episodes began, when deformation came close to 10 microrad. We’re still in the overall inflation phase. Gas pressure is increasing and high enough push out some degassed magma.
When the actual episode begins, first the degassed magma comes out with high volume like a huge Bloody Mary, second the gasrich magma follows with tall/explosive lava fountains.
It appears the system is partially clogged.
The Lisbon quake is the most interesting historical quake for me. Good article.
Has anyone got any thoughts on the uptick in earthquakes for the past few weeks on Gran Canaria? Seems to have started around the 13th October.
They seem to roughly be clustered around a NW to SE trending area between Agaete and El Sao in the NW of the island; which aroding to some geological maps is roughly where the boundry where the Alkaline-Basalts end and the Post-Roque Nublo volcanism begins.
Seems to be small quakes with a couple of M2’s in there.
It’s a little bit odd as it’s usually quiet in terms of earthquakes so not sure what the cause is exactly.
Don’t read if you don’t like spiders. Or draw the line at 100,000 of them
https://phys.org/news/2025-11-sulfur-cave-spiders-arachnid-megacity.html
Heh, a nothing. 😀 I’m an Aussie. Everything here is deadly.
I no longer have any spiders, because I hand-feed wild noisy miners (Manorina melanocephala), like this one on my knee. They eat all the spiders. And the mosquitoes too. Well worth the effort of feeding them, plus it’s fun.
Some birds have really attached themselves to humanity, and do well out of it. Sparrows and starlings did it in Europe long ago, living of our agriculture. The recent ones seem to be the omnivores with an appetite for fast food.
This is a weird episode for Kīlauea right now, if it is even one. Massive pulses roughly every hour, causing notable decrease in tilt. I know I may sound like a broken record, but if this is a precursor, most likely going to be something truly unexpected in the main event…
(UWD Tilt, 2 day, static).
Someone mentioned it looked like Fagradalsfjall, but I think it’s a little more extreme. If this is the main event, it might last a while.
The build-up towards the episodes runs in cycles, in which gasrich magma pushes out some degassed magma in the shallow parts of the pipes. But the gas pressure is not high enough to let the gasrich magma reach to the shallow system. This causes a overexpansion during the outflow of lava. A draining of lava/magma follows. During the pause, gas pressure is accumulated again until it has reached the level to do something again.
It’s indeed like Fagradalsfjall’s lava geysir or a typical water geysir. But it turns into the great eruption, when gasrich magma rises high enough into the shallow summit system. Then a massive output of degassed magma begins, and it is followed soon by gasrich magma that does an effusive-explosive eruption.
At https://www.youtube.com/watch?v=lceMVKYnRfU “Campi Flegrei Volcano Update; Stop Spreading Lies, It Isn’t Erupting Soon” by GeologyHub
The Azores did eruptions in 1757 on Sao Jorge and 1761 on Terceira. According to Wikipedia the 1755 Lisbon quake was a megathrust quake: https://en.wikipedia.org/wiki/List_of_megathrust_earthquakes#11th%E2%80%9318th_century
The impact of the quake in Lisbon and Europe means that it likely also did something in the Azores. A megathrust quake can shift the plate boundary over a long line (f.e. the Christmas 2004 Indonesia quake). So it seems credible, that the volcano-tectonic situation on the Azores changed somewhat with the quake. Sometimes small changes have big effect like the Butterfly Effect.
The volcanic pollution in Virunga is very impressive and severe, local tour companies in Rwanda near Goma border posts many facebook photos weekly. The whole entire region is completely gassed by a hazy fog, infact I should collect their photos, cite them as source, and make a Volcanocafe article of this, its one of the most severe VOG that I have ever seen
Very impressive VOG from Nyiragongo and Nyiramuragira they are one of the worlds top sulfur outgassers among volcanoes so I should make an article of these photos
https://browser.dataspace.copernicus.eu/?zoom=12&lat=-1.68461&lng=29.33865&themeId=DEFAULT-THEME&visualizationUrl=U2FsdGVkX18tdh6s4DgrtyYpU7qVBJuPBYDb0yvyjuCoHN6P1ThFt%2Fpvipst55YE6qW0p8s3Ef7%2F8W4vaL1pMgm4KgfwU5xemxOmQA5bLda3bnpHOa%2Bd8nBEn%2FCwaYvY&datasetId=S2_L2A_CDAS&fromTime=2025-11-04T00%3A00%3A00.000Z&toTime=2025-11-04T23%3A59%3A59.999Z&layerId=1_TRUE_COLOR&demSource3D=%22MAPZEN%22&cloudCoverage=30&dateMode=SINGLE
Gassy indeed I will post the ground photos later
This is amazing and probaly haves something to do with the ammounts of magma generation at depth thats likley MUCH more than whats comming up, I haves FB friends in Goma and they complains about the air quality and the acid rain burning the local crops
The lower vent is now overflowing while the other one is quiet.
It seems that the V2-vent is now dominant over V1, although both are active (but so far not simultaneously). I haven’t seen much hydrogen flaming so far – there was a little from V2 just now. There has been an internal change in the conduit. Perhaps the gas has found another escape route. Perhaps another day before the fountaining? Just a guess.
It’s struggling to flash the conduit into foam, the plumbing may have evolved beyond the fountain stage. It may be too early to tell yet, but it’s not looking too good for the fountains. This was bound to happen eventually. I hope we do get some more episodes, but it’s looking more unlikely by the time.
The DI event of the past two days seems to be over. We are back in the queue for a fountain episode. I hope
I did react that there’s a lot of steaming from the ground between the vents. Is it more now than it used to be? The ground has also turned a bright sulfur yellow around the steaming parts. It looks very similar to what it looks like when lava escapes out from a cone under the crater rim. Something we have seen many times during the Fagradalsfjall and Svartsengi episodes in Iceland.
Is there a central conduit between the vents that doesn’t erupt, but that releases gas from the magma?
Remember how thick the new lava is there too, it was 100m thick after E24 way back in June, honestly its probably at least 50m more than that now with how much the vents have built up. A lot of the degassing is probably just that alone, combined with the long interval since the last episode.
If it follows the trend its been going, E36 will be the biggest episode of this eruption. Supply rate before E35 was on tbe order of 700,000 m3/day, so thats potentially over 14 million m3 ready to go.
One thing that might make this even more crazy layer is that the tilt has flattened on both SDH and UWD, and no overflows now either. There might be a DI event that is countering tbe magma supply, delaying it for a day or two longer. But the DIs always end with extreme resupply and thats going to compound with the eruption being primed, and with an extra couple million m3. This could be wild
Actually, if my number is correct then E36 will surpass the 200 million m3 point, and 405 million since the caldera started filling in latest 2020.
How close does the total volume since Christmas 2024 come to Stromboli’s volume above sea level?
A strongly simplified cone calculation for Stromboli: 3km² * 924m/3 = 0.924 km³
(with radius = 1km and π = 3)
Its about 20% but in 10 months so maybe fully in 50 months, which is in March 2029.
The sulphur deposits have become much more obvious. That happened in Reykjanes towards the end of eruptions, and seemed to indicate cooler gas. My take is that indeed the gas is finding more escape routes away from the hot magma conduits. The fountaining happened when so much gas forms that the gas bubbles coalesce and the magma-with-gas-bubbles turns into a gas with entrained magma. That hasn’t happened yet in this episode. But the overflows are episodic and that suggest gas does build up. The two vents may be acting as each other’s safety valve! Give it another day: we may still get fountains.
Has to be lower than about 130 C to get yellow sulfur. Above that it will be red or black, since it self-polymerizes.
I’ve done a lot of work with elemental sulfur, as a chemist, its deposition seems to be encouraged by steam or water vapor. That’s my informal observation anyway. So yes, low temperature fumaroles.
Thanks for that information! It was my impression from previous eruptions, so it is nice to hear there is an explanation
The eruption has been very gassy throughout 2025, both concerning lava fountain activity and heavy fumarole activity between the episodes. The heavy fumaroles indicates the process of degassing shallow magma, which is erupted during the late inflation phases and the first minutes of the episodes.
B1 webcam shows that many fumaroles appear in the lava field of episode 35. Either it’s old lava that releases gas or there have opened new exits from magma below.
https://www.usgs.gov/media/images/last-24-hours-b1cam-kilauea-caldera-down-dropped-block-and-halemaumau
Early morning, so temperature is lower. That makes the fumaroles appear, as the water in the outgassing condenses
While UWD station has flattened deformation, SDH has risen above the level of inflation preceding episode 35:
 ?fileTS=1762509860
OUTL-GPS station shows that deformation of the episodes works mainly by N-S movement of the station. Does this indicate that magma flows from south to north below this station towards the vents?
No. It means that magma collects underneath Kilauea. This creates a bulge, but the GPS is too far to feel the bulge. The bulge also pushes the ground sideways and extends the crater. The GPS does feel this motion. Note that the GOPS is slowly going down. That indicates that the deeper magma chamber is being a bit depleted by the eruption. It is living on the resupply from 2024.
Does this mean that we should expect that the eruption is going to end after 12 months in December? Is it more likely to die slowly or more likely to die with a big final bang?
It won’t last forever. But the GPS decline seems slow enough that this eruption phase could last longer than a year. The episodes have grown larger but also longer apart. Based on that, I expect it will end by the quiet periods becoming longer and longer and finally there won’t be a new episode. But the recharging of the shallow magma is continuing at a constant rate at the moment, so this is not close. Perhaps more likely is that an earthquake destabilises the system and ends this magma-geysering phase. Geysers require a stable system
Well, with the govt shutdown, Tutu Pele is having to make do with less.
If Pele was just presented with the Big Beautiful eruption Bill, then the next outburst could indeed be wild.
News about Terceira (Azores): https://www.civisa.pt/gabinete-de-crise-reuniu-para-avaliao-da-atividade-sismovulcnica-em-outubro
In October they raised the Alert Level to V3. Seismic activity is above background level. They observe “a growing trend compared to that observed in the first months of this year” “and although little intense, crustal deformation continued to occur in the area where the seismovolcanic crisis develops.”
V3 Alert Level means on the Azores:
“Volcanic system in the reactivation phase – High activity, frankly above the reference levels, with evidence suggesting or confirming magmatic influence. At any time the activity can intensify at the level of seismicity, the pattern of degassing can be changed and/or strand movements, lahars, steam explosions or groundwater eruptions may occur. Although more rarely, tsunamis can be generated. The situation may escalate to a pre-eruptive state, and in extreme conditions it may not be possible to alert to the imminence of volcanic eruption in a timely manner.”
https://www.civisa.pt/cvs-escala-vulcnica#escala-vulcanica
Saw this light and I found it odd that it glows. Looked back into the livestream and looked to be glowing in the same spot from the beginning.
Is it some kind of fumarole? Or the precursor to some new vent (or maybe the Ep. 30 fissure deactivating)?
That spot is at the outer edge of the recent lava flows
Well, north vent is overflowing now at Kīlauea.
…and it’s over. But, it’ll try a few times before it does a bit of something…
And it overflows again.
And seems a new vent tore at the wall of the north vent.
This could be interesting if it keeps up.
Look at the video timed at 7:41 on V1. It is wonderful – I don’t think I have seen lava do this before.
Its a Brussels style fountaining! 😁
For those who didnt visit Brussels yet…
Mauna Loa accelerated in October. Does it explain the current hesitation of Kilauea with a negative correlation?
Meanwhile, HVO is still in “move along, nothing to see here” mode about ML. “Within background of seismicity” and “only minor inflation”.
Enh…I dunno. Admittedly, there were two months of continuous inflation before the November 2022 eruption, but I can’t help thinking this is an ant on the elephant’s back situation.
I’d assume that it’s still a long way until next volcanic crisis and eruption. But it looks like the first step to a positive tendency.
Summit vertical motion shows that Mauna Loa in fact has continued on the level of deformation since June 2025, on which it was interrupted in November 2022:
Is Mauna Loa still in an overall positive trend that was interrupted by the 2022 eruption, but continues? Maybe the positive deformation before 2022 wasn’t only the prelude to the eruption, but a sign of a general more active Mauna Loa in next decades.
North vent sprung a small leak
Yep, Ep. 36 is on its way.
The lava looks quite sluggish still
I guess it looks like it still has a long ways to go, but the fact a new vent appeared on the wall of the north vent could mean the system is very pressurized to the point new vents would rip through. This could be a very exciting episode here…
The hole got a little bigger.
It was very quick 9:18 to 9:20 and then drained back down.
Not sure. The more I look at it the more I think the conduit is done with high fountains. Both the south and north vents have erupted while deflating slightly and without turning into fountains.
It’s a tricky one. As long as the overall trend is inflation I think it could still be up for some high fountains, but it’s definitely not guaranteed in any way. Maybe the ground opens up and we get another fissure instead. Maybe regular large overflows is the new way. Who knows?
The flames are impressive at the moment. But they come only from the new vent in the wall which shows that the degassing is through this new route. The lava flows are much less than during a full episode. The real event may still be to come. Or not – volcanoes are predictable only when they want to be
Looking now. The new higher hole in the north vent is erupting lava that is mostly draining in the older edifice. Is this evidence that the supply route has changed, there is not a huge difference of height between the two, but the ridge above the new hole has been degassing, in my opionion higher that other areas of the two vents. Are we seeing a change in plumbing?
Time 16:36-16:45 by time stamp on V1
It is 9:34 pm Hawaii time and that north vent leak is sending lava back down into the north vent, can anyone explain this?
It is 9:55 pm local Hawaii time, hydrogen fames are shooting out of the leak (for at least 4 minutes to 9:59 pm), but where is that hot lava draining to? The ground seems to be steaming a lot now around the north vent, particularly on the right hand side. This is from the V1 cam.
10:05 pm local Hawaii time and the hydrogen flames are burning through the rock towards the south vent, this is going to become very interesting to watch now.
21:13 local Hawaii time, a broad area north of the north vent leaker is heating up, perhaps the central vent is opening up? the ground definitely has gotten much hotter now and some of the very hot gas is seeping through also.
The flow was switching from the lower sub-vent of the north vent to a higher one on the left back wall, now back again. I remember having seen something similar in the pre-fountaining phase of the last episode. This vulcano is like an organ with many pipes and each has its own frequencies, but as the eruption goes the pipes and thus the frequencies are in constant change. The bigger trend seems to be frequencies getting lower and amplitudes higher.
The northern vent has been erupting continuously, although not constantly, since yesterday (Nov 7th) afternoon with only short breaks:
https://www.youtube.com/watch?v=tk0tfYDxrUA
The eruption is still cyclic with stronger and weaker moments, but it hasn’t really stopped. Episode 36 appears to be the first since December/January to have a steady eruption for some time during inflation.
V2 cam on the northeast rim of the caldera shows the progressing lava flow from a distance:
https://www.usgs.gov/volcanoes/kilauea/v2cam-kilauea-volcano-hawaii-east-halemaumau-crater
The upper wall vent is now the only one erupting and is becoming more explosive. The hydrogen flames have ceased. If the past predicts the future, we are now on the path to the main fireworks. Might even get three fountains. Or none
The flames are scary, impressive to see! its the entrace to depths of oblivion: Sammath Naur comes to mind which is more or less the same thing a gas eruption vent in Mount Doors side. Thats saied Frodo, Sam
and Gollum woud realisticly never have been able to survive inside that volcanic fissure due to the radiant heat from the lava below heating up the whole space its rock walls like a kiln furnace …
Smeagol: Clever Hobbits, to climb so high!!!!!!!!
[jumps on them, pins Frodo to the ground and grips him by the throat]
Smeagol: Mustn’t go that way! Mustn’t hurt the Precious!!!!!
Frodo: You swore! You swore on the Precious!
Smeagol: [mocking] Oo-hoo-hoo-hoo…!
Frodo: SMEAGOL PROMISED!
Smeagol: Smeagol LIED!!!!! ARRGGHH!!!!!!!!! ( choking Frodo )
Later Sam hits Gollum with a stone