
Journalism is about impressions; science is about numbers. VC is standing in between these. We appreciate the immensity and power of volcanoes (and also appreciate that relatively speaking, these are manageable disasters. The human impact is awful for people concerned, but is not on the scale of major earthquakes or tsunamis. On balance, volcanoes create more than they destroy). But we also like to understand what is happening, and that means looking at data. Bear with me if numbers aren’t your thing! (But if that is your situation, I recommend you steer away from lotteries and stock markets, and keep a healthy suspicion of banks and car-dealers.)
The people living in Leilani were not told about any volcanic risks when the sites went up for sale. VC user quinauberon unearthed a 50-years-old advert which paints a very optimistic picture of the future of the area. (It also lists a misleading price that is only a down payment – something that in many places would now be illegal.) They could have found out the real risks by asking insurance companies – those always know. I once did a small bit of research on life expectancy of smokers, using a new method. It showed that smokers lived on average ten years less than non-smokers. Afterwards, I found life insurance rates and used them to derived life expectancy. It gave exactly the same number. Insurance companies always know best – but do not expect them to volunteer their data: they make a living by not telling you the real risks. One of the comments on this site gave a quote for volcano insurance for a house of 3000 USD per year. (That would be just for the event of lava overrunning your property: a bush fire started by nearby lava would be covered under fire insurance). That number suggests that the insurance company didn’t expect Leilani to last much longer than 100 years.

But this is in the past and now everyone knows the risks. There is an opportunity for an investor with unneeded cash to buy property in the area at a knock-down though realistic price. (Perhaps this should read: a knocked-down price.) (And of course, there is a second housing estate in the area, Nanawale estates which is not currently in the line of fire but build in an equally lava-ravaged environment. I just mention it.)
This is the importance of numbers. Can we put some more numbers on the current eruption? How does it compare? Are we talking world-cup size or also-ran?
Duration

The eruption started on May 3rd and has lasted three weeks so far. Puna eruptions in the past have been as short as one day (1961), so this is already more than some. The famous 1840 eruption lasted 24 days – we are getting close. The 1955 event lasted 88 days, and the 1960 one 36 days. Of course, Pu’u’O’o dwarfs them all: it lasted 12,870 days. Eruptions closer to Kilauea can last longer, but in Puna, 1-2 months is typical. From that, one can expect that we are half-way through the current eruption, with an uncertainty of a factor of 2: it could end tomorrow or it could continue for 2 more months, but based on past events, any longer would be less likely (not a Lurking ‘black swan’: we don’t have enough data to compare with Australian wildfowl).
The fissure activity has begun to migrate, with the most distant fissure losing pressure and one in the middle firing up. That is a sign that we are past the peak. Halfway may not be a bad guess.
Area coverage
A typical Puna eruptions resurfaces 10km2 with tough yet a tad uneven asphalt. As we have seen in this eruption, a lot of that comes after the initial phase, once the old sticky stuff has been dislodged and the hotter, more fluid lava starts to arrive. How are we doing up to now?
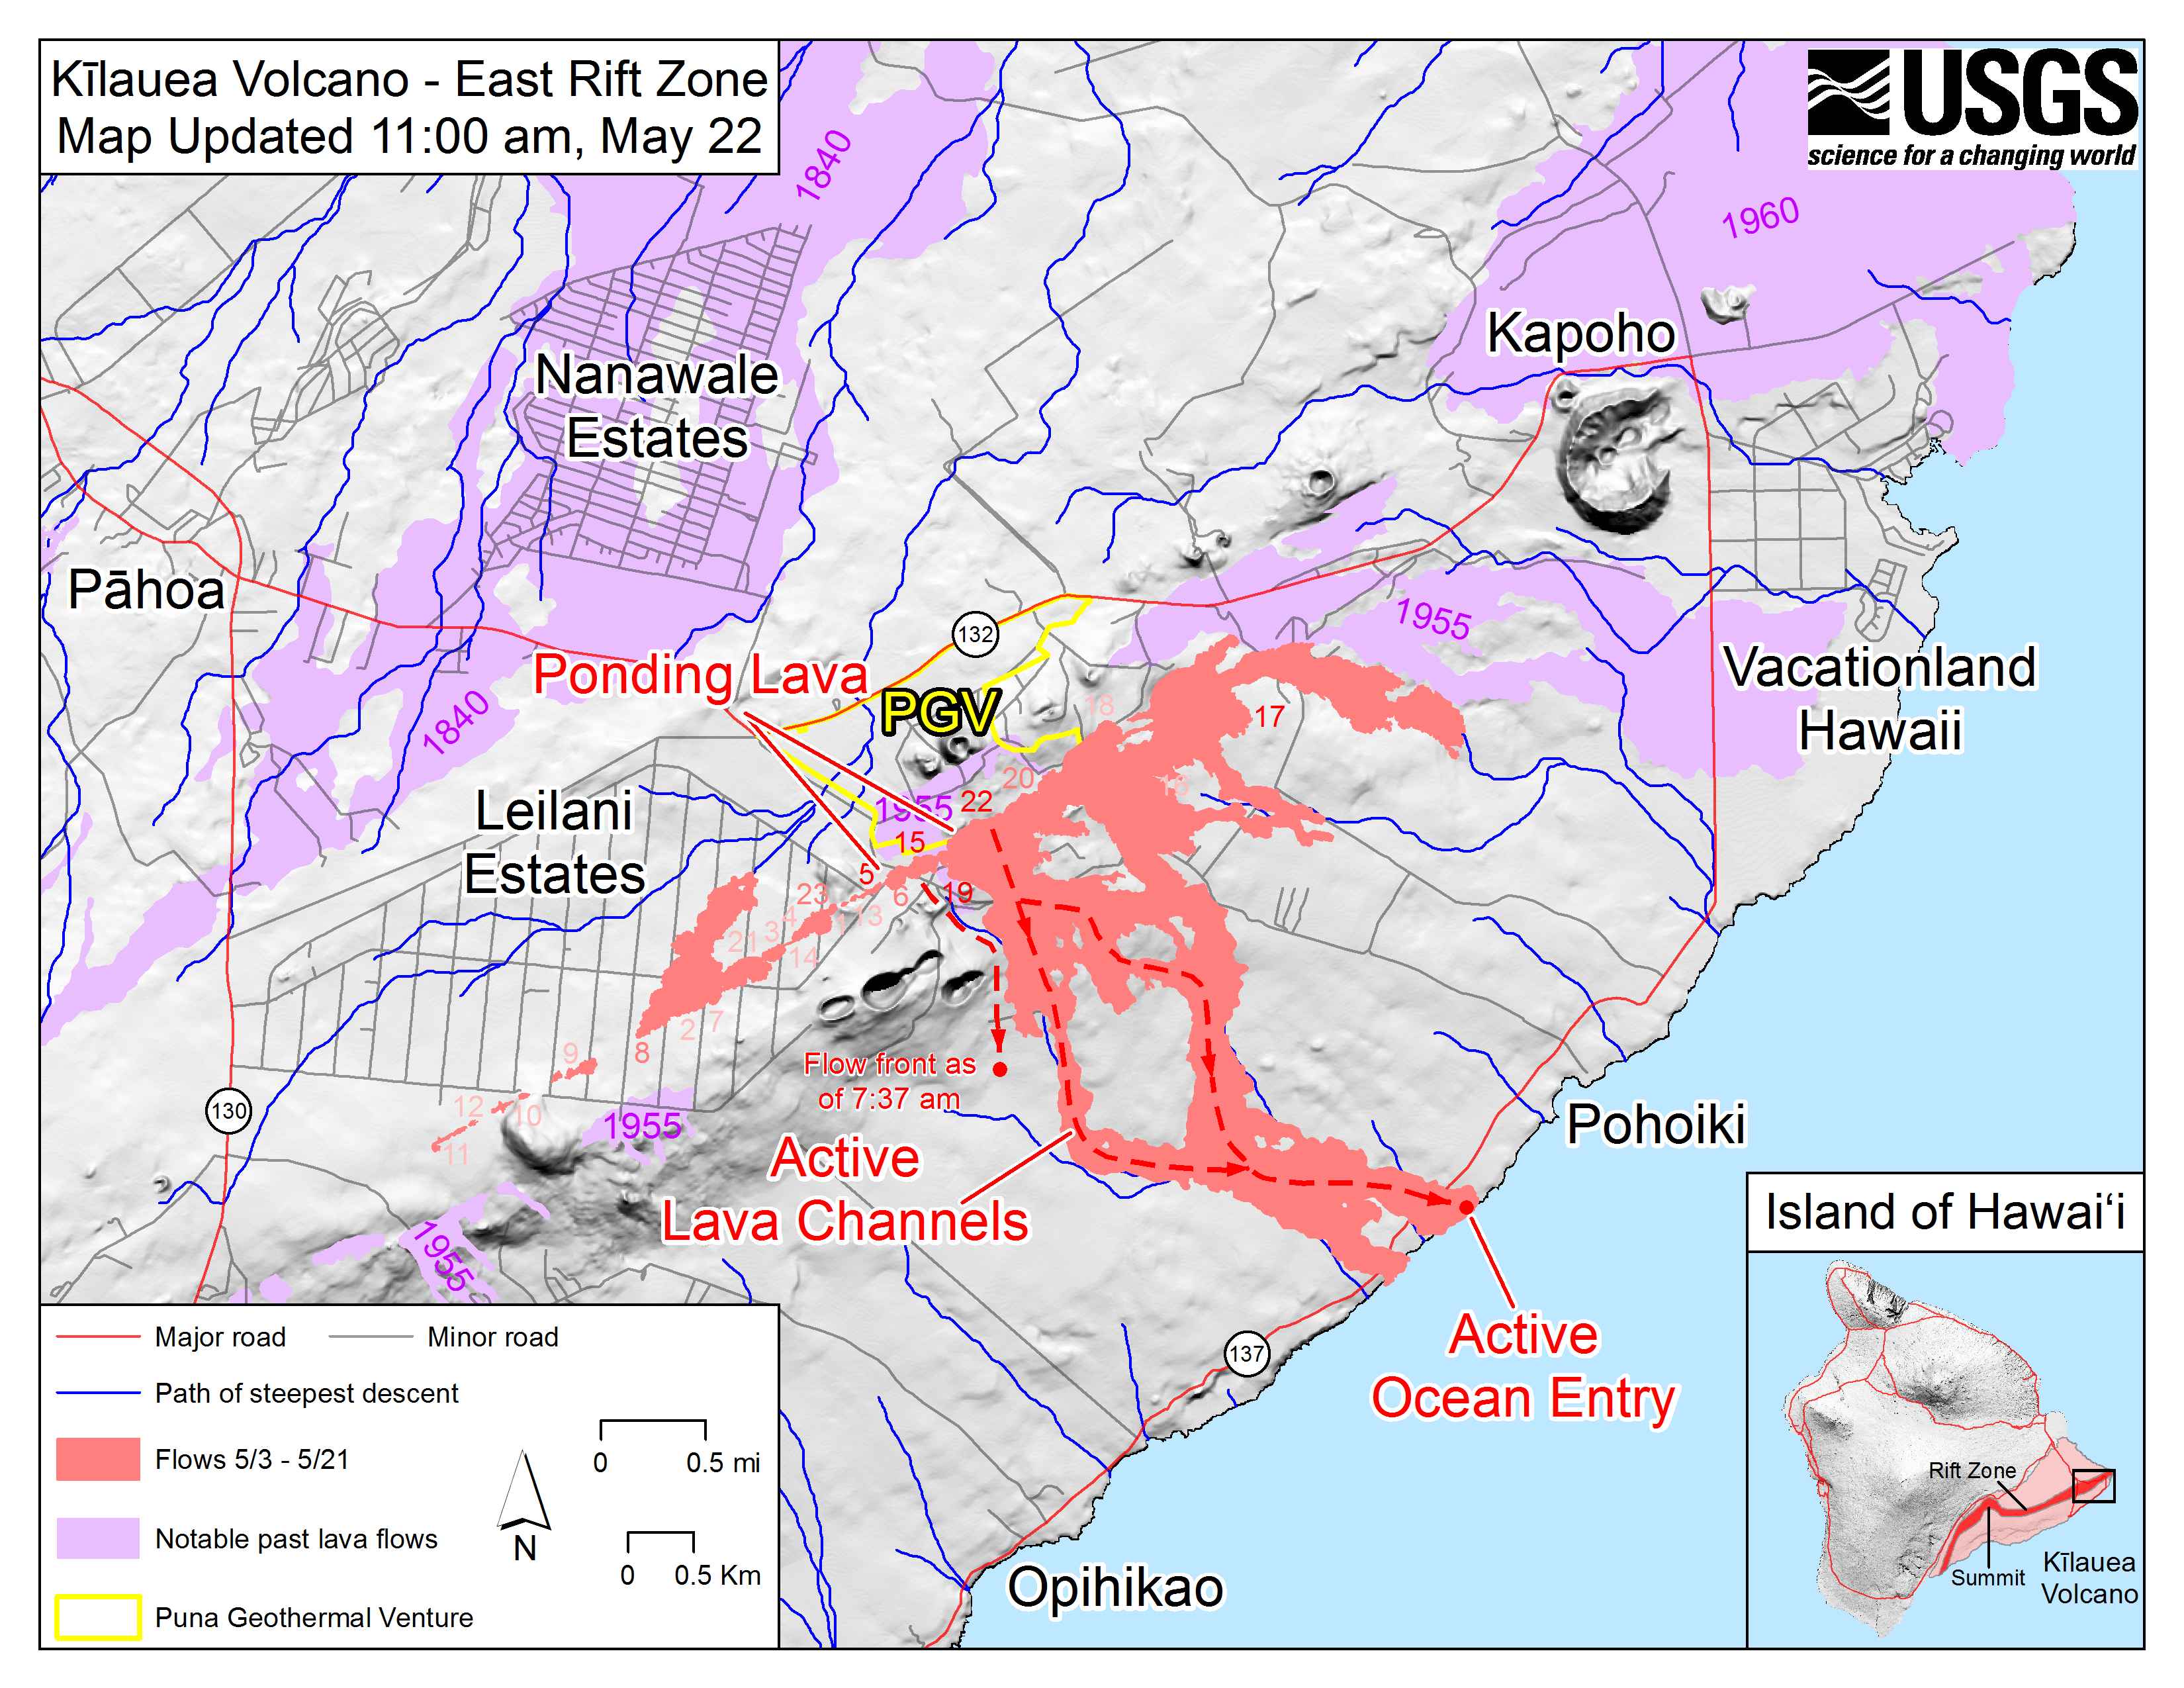
Click on map for full size
Here is the most recent HVO map. The pink shows the extent as determined on May 21, and the arrow shows the enlargement from the flows coming from fissure 15 (or thereabouts) a day later. The flow from fissure 17 has probably stalled and perhaps ceased. We also know that the lava is encroaching on the PGV but that is not yet on the map. Fissure 23 (near 5, just inside Leilani) was reported as fountaining and may be start to feed a lava flow to the southwest if it can find a slope.
The full length of the line of active or inactive fissures amounts to 6 km. Assuming that a width around it of 100 meter is covered in lava gives an area of 0.6 km2. The flow northward of fissure 8 extends about 1.5 km and is about 200 meters wide, so that is 0.3 km2. The flow from fissure 17 southeast-ward is 2 km long and 300 meters wide, so 0.6 km2. The area between fissures 20 and 17 I is almost fully covered: I estimate this as 1 by 2 km, or 2 km2. The area between fissure 15 and 20, down-slope until where the lobe starts, is roughly 2 by 1 km, also 2 km2. Finally, the two lobes to the ocean I estimate as 3 by 1 km, or 3 km2.
Adding all this together gives a current area of the lava of 8.5km2. This is rather rough and may be under- or overestimated. But it seems that this is now becoming a fairly typical-sized Puna eruption. To get into Olympic-sized territory, it needs to at least double in area. However, if more of the fissures re-activate, that is not inconceivable.
(Note added: the area is today reported as 1700 acres which is around 7 km2. The number given here was not a bad estimate.)
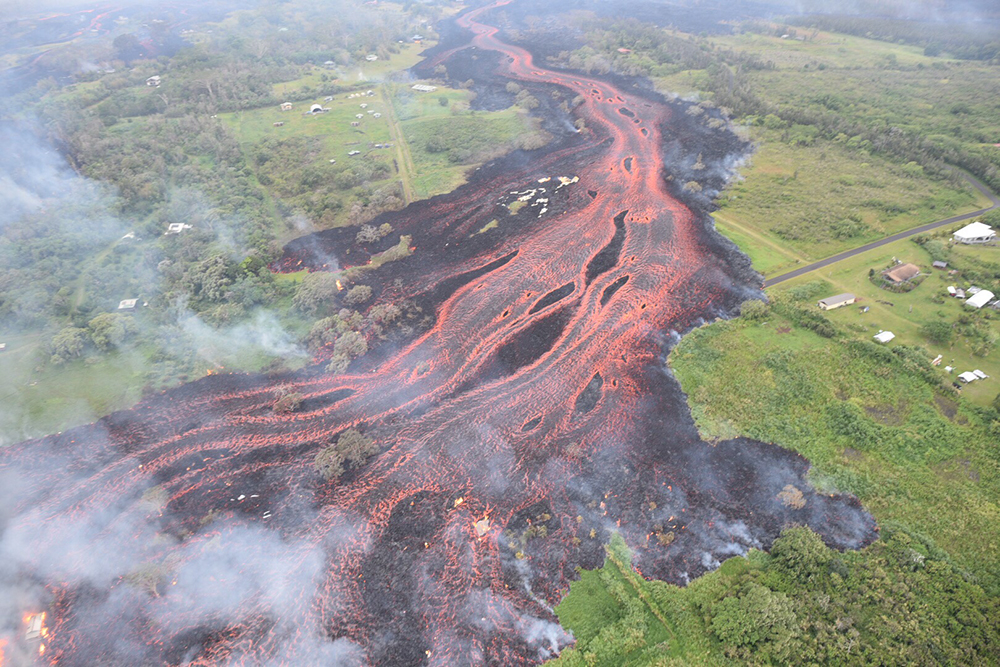
The images of the eruption show very nicely defined lava channels: rivers of lava in well-constrained beds. This is one of two modes of lava transport away from a vent. The other mode is through lava tubes. Lava channels cool faster (as they are exposed to the air) and therefore carry the lava less far. As long as these channels are present, the flow field can widen quite easily. Once lava tubes form, all the expansion will be at the lava front.
Volume
This is anyone’s guess! Assuming that the lava everywhere is 5 meters thick, the volume times the thickness gives an erupted volume of a bit less than 0.05 km3. But this is probably an overestimate. A volume of 0.1 km3 is quite typical for a Puna lava flow and that may be where we are heading.
How much magma was injected into the rift below Puna? We can guess from the lava lake at Halemaumau: assuming a 200 meter wide crater, in which the lava was lowered by 400 meter, the amount lost is around 0.04 km3. Pu’u’O’o also lost its lava but this was a much smaller source. The lost magma is stored in the rift. Assuming a dyke 1 km tall and 20 km long, it would require 0.02km3 to fill it. Much of the new magma will thus still be inside that dyke. As the pressure becomes lower, the dyke will narrow and will try to push some of this magma out: this can give eruptions at unexpected locations, up-rift, which can be significant but cannot match the output of the main eruption. Part of the ‘dyked’ magma will fail to come out and remain in situ after the events have ended, and form the sticky stuff in future eruptions.
How does the lava production compare to international standards? The king of lava is Iceland: it produces around 20km3 per millennium, or 0.02 km3 per year. The rate for Kilauea is difficult to calculate because it varies so much over time. Between 1840 and 1950, lava was produced at a rate of 0.01 km3 per year. After 1950, this jumped to an average of 0.05 km3 per year. Over the combined period, Kilauea can match all of Iceland! Add Mauna Loa, and Hawaii’s rate become twice that of Iceland. Not bad! (The reason is that Iceland is a spreading rift zone: 90% of its magma is used to fill the spreading rift and never gets anywhere near the surface. In Hawaii, most of the magma comes up, as it has nowhere else to go.)
If this was a newspaper article, we would now state how many Olympic-sized swimming pools this eruption would fill. This is, however, not a scientifically accepted unit of volume. In fact, it varies from pool to pool, as only the length of the swimming pool is specified in the rules of the Olympic games, not the depth. But let’s say it is 2.5 million liters, and you find that the Puna eruption so far would have filled 20,000 of them. As we only need one such pool every four years, that would have taken us to the year 7,018 AD before all the recipient pools were build. By this time the lava would have been stone cold, difficult to get into the pools and not easy to swim in.
Energy
Volcanoes are prolific energy producers. In fact, the main scale used to classify volcanic events, the VEI scale, is a measure of explosive energy.

This scale has one obvious problem: the units don’t match. The main number is the volume of tephra production. But energy should be measured in Joule, not cubic (kilo)meter. And if you want to use the power, that is energy per second, so it becomes important how long an eruption lasts. The Pu’u’O’o eruption produced more than 4 km3 of lava, but it lasted more than 30 years. It therefore is not count as a VEI5, even though there does not appear to be a specific rule that forbids this!
The Kilauea summit eruptions produced tephra: judging from the images, there is a layer a couple of centimeters thick over an area of a few square km. That brings the summit up to VEI1 -perhaps VEI2 at best.
How about the fissure eruption? On the scale above, that would be a VEI3 by now. However, one should note that the ejected volume in the table should be tephra, i.e. pulverised rock. The fissure mainly put out lava – molten, not pulverised rock. If this has been tephra, it would be a few times larger in volume, i.e. VEI4. But it is clear that a scale devised for explosive events gives nonsensical results if applied unthinkingly to effusive eruptions. Can we do better?
Let’s work with the number of 0.05 km3 of lava ejected in Puna, and let’s assume it has a temperature of 900 C above the normal Hawaiian temperature. The energy needed to heat 1 kg of lava by 1 degree C is 1000 Joule. The lava weighs rather more than 1 kg. 1 m3 of lava weight 2500 kg, and therefore 0.05 km3 weighs 1.25 x 10¹¹ kg. To heat this by 1 degree C requires 1.25 x 10¹⁴ Joule. To heat it by 900 C therefore takes 1.1 1017 Joule. This is how much energy the lava carries! The Puna geothermal plant would have taken 100 years to produce this much energy. They may have missed an opportuinity.
This is the thermal energy in the lava. There is also energy needed for the melting itself, called the latent heat. This is in addition to the energy needed to heat it to the melting temperature. It takes 4.0 x 10⁵ Joule to melt 1 kg of rock. For the amount of 0.05 km3 of lava, the energy needed to melt it is 5 x 10¹⁶ Joule. Add this to the thermal energy, and you get a total energy content of the lava of 1.6 x 10¹⁷ Joule. Enough to cover the entire energy requirements of humanity for a few weeks.
The potential energy can be added: assuming it erupts at 500 meter and flows down to sea level, this generates an amount of energy equal to mass times height times gravitational acceleration, and give 600 TJ. This is significant in itself but pales in comparison to the heat.
Now the fun bit. This amount of energy is equivalent to around 40 megatons TNT. The largest nuclear bomb ever detonated had a yield of 50 megatons. Puna is suffering the impact of an event with an energy close to that of the largest weapon humankind (or unkind) has ever created. That give some perspective to what the people there are living through!
How does that compare to the VEI scale? We need to calibrate it to another eruption with a VEI number. USGS has reported that the explosion of Mount St Helens was equivalent to 7 megatons, with an additional 17 megatons of thermal energy. That eruption produced about 1 km3 of tephra making it a VEI5. Puna has (so far) produced about twice the energy of St Helens. If this energy had been used in the same way as St Helens, i.e. a thermal to explosion energy ratio of 2.5:1, this could have produced a 2km3 tephra cloud. To get above 10 km3 would require a five times larger eruption. That seems unlikely at the current time, and it remains in VEI5 territory.
I therefore declare the Puna eruption of 2018 to be equivalent to a VEI5. It is world cup territory – but likely to be knocked out in the group stages. In that respect, perhaps Puna is a bit like little England.
Albert, May 2018


If this eruption is a VEI 5 in terms of energy output, how big would holuhraun be? Or the skaftar fires… (or the 1000+ km3 roza flow of the columbia river basalt…)
That would have been my question now.
It scales with volume. Bardie was 30 times larger than Puna (as of this moment) and it is VEI6 territory. Skaftar was ten times Bardie, so VEI7. Somehow those numbers seem to make sense – although obviously the mechanisms are very different, and effusive eruptions don’t go stratospheric so don’t have the widespread impact of a single explosion.
Bardie was a VEI 5 no VEI 6. VEI 6 starts from 10km / 3. And Puna is currently a small VEI 3.
By volume yes (although do remember to multiply the effusive volume by a factor of 3 to get the tephra volume). By energy, no. Explosions produce cold ejecta: the tephra is shattered mountain rock. The thermal content it much less than that of effusive lava. The lava content of explosions is often minor.
There is only one VEI table and you can only look at the height of the eruption cloud or the volume. I find this VEI table very bad. But since there is only one table, we have to stick to it. Either volume or height of the eruption cloud. You would have to create a new VEI table. 🙂
I think everyone agrees that VEI has its problems. It is very unclear what it is trying to measure. You used volume before as the main indicator. Height is a different number which is related to volume but is not the same thing. It depends on power more than energy, and for explosions it depends on direction of the explosion. Sulphate particles go higher than tephra, so which one do you count? You get secondary updrafts around the events, powered by pyroclastics or by lava – do these count? The volume is far more specific and easier to use, but is not an energy unit.. I wanted to point out that if you compare energies, effusive eruptions rank much higher than the volume would imply. The energy carried by the lava should not just be ignored. If you would like to develop a new scale, I would not object!
One way to tie VEI’s volume numbers to energy would be to apply the milling formula, would it not? Take the DRE, then ask how much energy it would take to convert that volume of solid rock of the appropriate composition (for most explosive erupters, that’d be andesite) into tephra of the usual grain size. Add in the kinetic energy needed to launch it to the plume height. Stir once, let sit for 30 minutes, and season to serve.
I did this for Kelud and got pretty close to other estimates.
In order to do a proper milling formula, you need the resulting grain size and the size of the original rock. For Kelud, I used the size of the dome.
nicely put in perspective, so long there is no more then a bid of spatter going to the side of power plant, if it doesn’t you would have to recalculate
Bardarbunga covered 84km / 2 and 1.1 km / 3 erupiert. Hawaii is a children’s pipi. sorry for the expression. The only difference is that no people live in the place where Bardarbunga erupted. Unfortunately, this is different in Hawaii. Hawaii is a little baby from Bardarbunga. A very small baby.
Albert – typo in the text:
“Add this to the thermal energy, and you get a total energy content of the lava of 17 Joule.”
Shouldn’t this be 1.6 x 10¹⁷ Joules?
Fixed. There was an html mark-up issue
I think Hawaii is a VEI3 up to date and barbing was a VEI5. This is my opinion. And that fits too. Hawaii is not a VEI5. Sorry with google translated.
For those watching the civil beat live feed this time yesterday you might have overheard CNN doing a story of the guys who got hit. Here is the CNN youtube link of that (sorry if it was already posted)
https://www.youtube.com/watch?v=3-UesaEvVhA
that guy was putting his life at risk to save the house. Some of those lave bombs were over a foot in size and the lawn was covered with them
I also still have the question of why this eruption would be the same size as the 1960 eruption when the amount of deformation at the summit is 3 times bigger? Also with probably 90% of the lava erupted in the past 4 days and SO2 emissions tripling since that point, would it be more reasonable to count the point when the eruption properly started as being only 4 days ago, meaning the point where it was directly comparable to 1955 and 1960 (and 1840, 1790, 1750 etc)?
Technically the eruption did start 2 weeks ago, but up until 4 days ago the amount of lava erupted was negligible and possibly not even connected to the dike directly, as evident that the new magma didn’t erupt out of fissure 11 and 12 but at the most downrift section and only later breaking through. The biggest flow of the 1955 eruption happened at the most uprift vent too, so waning eruption doesn’t actually mean the eruption will get smaller as the vents go uprift.
Are you sure that 50,000.000 m3 is the current volume? That would mean that the eruption rate would be about 12 million m3 per day. The eruption rate in 1960 was reported as 2 million m3 of lava per day, and even the value for 1840 is 10 million m3 per day (the volume of 1840 was actually much higher than the 1960 or 1955 eruptions, at a minimum it is 265 million m3, HVO has said it was the biggest eruption on the lower rift zone in the last 2000 years). Mauna loas 1950 eruption was a bit over 16 million m3 per day. If your estimate for the size of this eruption is right then either the other estimated volumes of other eruptions are wrong or this eruption is kilaueas most rapid eruption in historical time…
Why is everyone assuming that the lava erupted in this eruption will mainly come from halema uma u? The 1924 intrusion from the summit didnt made it, the reaction from the summit to the 1955 eruption was lagged by several days and I believe there was another failed eruption intrusion before 1840 right? To me this eruptions in Lower Puna seem to be feed by magma already stored at the ERZ (including the old intrusions magma) and maybe some of Halema uma u magmas make it to the eruption.
Well HVO has actually said that the lava erupting now is from under pu’u o’o and that magma is basically the same stuff as what erupted in halemaumau because of the open conduit that had to have been there in order for pu’u o’o to erupt so long.
The main difference is that magma from under pu’u o’o was already largely degassed because of the heavy degassing happening at the overlook vent, so the fountains now aren’t that high though they are very voluminous as evident by the fast moving channelized flows into the ocean in less than a day, reminiscent of the fast flows of the early days of pu’u o’o in 1983. If the new gas rich stuff from directly under halemaumau gets to the vents then things could start fountaining much higher. It will be extremely obvious if that happens though…
The lava erupted up until May 17 was old stored magma, as evident through the eruption of andesite at fissure 17 (which is probably still ongoing although minor). The lava after then is new magma.
Also rusty awoke yesterday 2pm 🙂 (UTC+00:00)
In before headlines calling the England team a VEI-5 eruption! More like VEI-5 disaster hehehe
Give them a chance. A bit of effusive praise can do wonders.
There does not seem to be any explosions or rumbling going on on the civil beat live feed anymore…but i can hear the nightlife, the sound of rain, and somebody sleeping i think in the near facinity
USGS Scientist Gives Hawaii Eruption Presentation (May 22, 2018).
It does seem it is not possible to distinguish between Halema uma u and middle ERZ magmas but they believe that up to now it was at least mostly Pu’u’o’o magma.
Maybe the summit magma will have more gas—maybe 🧐
Think in the past they have determined the source based on the olivine / MgO content.
For example, Wright & Fiske’s paper: https://www.researchgate.net/publication/275150147_Origin_of_the_Differentiated_and_Hybrid_Lavas_of_Kilauea_Volcano_Hawaii
Two considerations:
1) using VEI for non-explosive eruptions really stretches the index beyond what it was meant to do. The fact is that Hawaiian fountaining events have very low VEI (Kilauea Iki was a 2, Mauna Ulu was a 0) because they have low volume, localized tephra blankets, and low eruption columns. The Leilani Estates episode is probably a zero. Fountain heights have been much smaller than Kilauea Iki or Mauna Ulu. Similarly, the ash bursts at the summit are minuscule by the standards of explosive volcanism. The 1924 eruption is the best analog, and that was a VEI 2. The thermal energy output approach is an interesting one, but the historical record then becomes dominated by high-temperature, long-lived basalt eruptions. By these standards, the Erta Ale lava lake would be many orders of magnitudes larger than the Pinatubo eruption (Wright & Pilger have done interesting work on the topic: https://www.higp.hawaii.edu/~wright/ijrs29.pdf). Let’s compare apples to apples.
2) I think there are some pitfalls in assuming the current episode can be compared to the 1955 or 1960 lower east rift zone eruptions in term of their duration. Previous events were stand-alone eruptions, whereas what’s happening now is an episode in the Pu`u `Ō`ō eruption. For all intents and purposes, Pu`u `Ō`ō has temporarily relocated downrift. While I agree that the more probable scenario is one where this episode lasts a few months before Pu`u `Ō`ō reestablishes itself at the main locus of the eruption, I don’t think we can discount the possibility that a new eruption focus establishes itself in Leilani Estates and stays there for several years or decades.
This is probably not just another episode of the pu’u o’o eruption. If you have seen the LIDAR scan of pu’u o’o taken about a week ago you can see that within the crater there is also a deep pit crater that extends about 350 meters below the edge of the crater, far down into the pre-1983 base rocks. That indicates that the magma body under pu’u o’o that has existed since at least 2011 and probably all the way back to 1992 has been completely destroyed and as such if an eruption actually does occur here again it will probably be years down the track and resemble the leilani eruptions more than the slow tube fed flows that we know previously. That would be long enough for any subsequent activity to be considered its own eruption.
Rip pu’u o’o, 1983-2018
HVO have said that if eruption resumes at pu’u o’o then this will be considered episode 62, but if pu’u o’o doesnt erupt again then the leilani eruption will be considered its own eruption and pu’u o’o will have stopped on April 30 2018. If an eruption happens at pu’u o’o in 10 years then that will be considered a different eruption that happened to be in the same area.
The overlook crater is ignored in this, which presumably means HVO considers it to be a completely separate eruption from pu’u o’o. The overlook crater will erupt again when this stops, probably a few months later and then recreate its lava lake and fill up the crater again and continue.
I dont think this is part of the Pu’u’o’o eruption either. I would consider this as a part of the recent phase of strong activity of the ERZ beginning around 1955. I dont see an eruption lasting for decades or several years so far downrift since I think that the lowest vent of this king is Heiheiahulu and from there on there is a predominance of fissures which are characterized by short lasting eruptions (several months?). But what may happen is that we have a series of fissure eruptions separated by short periods of time which would also be catastrophic for Lower Puna, like 1955 and 1960 but maybe if we are unlucky with more fissure eruptions coming after that
There is also the possibility of this being a paired event like 1960 was to 1955. This eruption sets up the conduit, and in 3 – 10 years kilauea is inflated back up to or above the level it was at before this eruption and it breaks through down the rift and erupts in the leilani area again or somewhere nearby.
To 1: Full approval
I didn’t know that paper. The numbers that come out are comparable, although the radiant energy is not the quite the same as the internal thermal energy. Sure, the VEI scale is meant for explosive eruptions. But it is often used for other things anyway, i.e. the volume of Toba is used to assign it a VEI ranking even though much of that eruption was effusive. It compares apples to a bag of mixed fruit. Ideally, the VEI scale should only be applied to the explosive part of an eruption. The basic problem with VEI is that its prime number is a volume whereas it actually tries to measure energy.
I compare thermal energy of effusive eruptions with total energy (explosive plus thermal) of explosive eruptions, and find that the energy content of even medium-sized effusive eruption (Puna) is large, compared to explosive eruptions. In terms of energy-equivalence, effusive eruptions are big events. And that is backed up by other measures. Puna has so far lost 10 square kilometers to lava. An eruption that covers 10 square kilometer in thick tephra would be a major event. We underestimate effusion.
Anyway, I am sure this discussion could go one for longer than the eruption itself!
I asked USGS about the size of the outbreak currently. Here is the answer. USGS : This is a tough question, because the VEI scale is targeted at explosive eruptions that output a lot of volume all at once. It’s not really designed for effusive eruptions. If you look at the list of past Kilauea eruptions maintained by the Global Volcanism Program (http://volcano.si.edu/volcano.cfm?vn=332010&vtab=Weekly), the vast majority are VEI=0, with a few at 1 or 2 (the 1960 eruption is a 2, probably due to the rapid effusion rate and level of fountaining — 1959 Kilauea Iki was also a 2). The only eruption above a VEI=2 was the 1790 explosion, which was VEI=4. We therefore suspect the current eruption will ultimately be classified as VEI=1, but we’ll have to wait to see how the eruption evolves to really know..
I think this from somewhere around fissure 6, not sure though.
Leilani Estates Pig House, Doghouse House Update 4:43 AM May 23, 2018
I guess the guy is later walking down Kahukai to F5, F18, F6, F15. He also mentions action in the forrest to the south of Kahukai.
The VEI scale has long been an issue with geologists. The approach of treating the eruption in quantity of heat energy is valid. The Mastin et al paper that I use to estimate mass ejection rates is derived from work by Sparks, and both of those use heat content to convert from plume height to mass ejection rates.
I beleive Carl and Albert had a go at recommending a new scale that allowed flood basalt events to be included in eruption analysis. The text of that appeared here on VC several months (years?) ago.
And yes, the Leilani eruption is a flood basalt event… but quite tiny as flood basalts go.
Shouldn’t the ratio of time be considered? Maybe two separate scales might be better, one for total Energy for an event and another for some version of Power as Total energy over some time interval.
I’ve seen usage of some other scale in conjunction with VEI, but it is rare and I don’t know anything about it. Based on my crude use of the Mastin et al paper, summit events for Kilauea in total still fall inside the VEI-1 range for this eruptive period. That could all change in the next few days if 1924 is any indicator. If this is a perfect play of 1924, around 25 may things could get quite energetic. Give or take a day.
A system based off of unit energy over time would be a nice way of getting all events into the same scale, but that would require a definition of what constitutes an event. If not, then fumerolic activity would become seemingly large scale events.
Example. Campi flegri and Yeller-stoned would count as still going on since heat is still coming out of the ground.
Do your energy calculations take into account the steam explosions (many from the uplift side of 17)? Certainly a few orders of magnitude smaller than the lava, but they have been ongoing and some have been quite large.
I don’t actually have a system of calculations put together, but by definition, steam plumes are heat release, so should be included for completeness. That’s where fumerolic activity messes things up. You need the mass of water and the temp in order to get a valid quantity of energy.
Likewise, a low intensity long duration eruption can rank quite high as time goes on. For example, Grímsvötn 2011 did more in a few hours than Eyjafjallajökull did over it’s whole eruptive period.
The cloud plume seems thicker and darker today.
https://hvo.wr.usgs.gov/cams/panorama.php?cam=KIcam
I remember Erik Klemetti did a post on this in his Eruptions blog a few years ago. Hang on, I’ll google it.
https://www.wired.com/2013/07/revamping-the-volcanic-explosivity-index-or-tiny-eruptions-need-love-too
Thanks very informative.
There was always dispute between the VEI table among the volcanologists. Unfortunately, there is only one. Also we have to make sure that there is a new and better VEI table.
The fountain on the stream has gotten much smaller since this time yesterday.
A few people were saying that another fissure had opened close by (which could lower the pressure, I suppose), but frankly I wouldn’t believe anything I read from some of the idiot contributors to YouTube chat so it may be complete bull poop.
The comments are crazy yes, but whoever said that is right. If you look on the webcam overlooking leilani, it is immediately obvious that there is a very active fissure. The lava fountain might be smaller in the livestream but I think the eruption rate has increased if anything based on the size of the other fountains. The eruption isnt slowing, it is just less localised on the vent in the livestream.
I’m pretty sure any rumors of fissures downrift of the video house came from a livestream the owner of that house was doing. The guy holding the camera / phone pointed out an area that seemed to him to have fountains. Maybe it was in reality a fire.
As I write this (23:33 US Central time) fissure 20 is going gangbusters.
Hi All, I made another timelapse (from screenshots) It’s from the 21st to 23rd but mostly 22nd to 23rd. Apart from the first scenes everything is at 600x speed. Quite a few collapses and rebuilds. I think I stopped too soon though (and yes I can rewind and record) the stream, but that’s cheating.
https://youtu.be/5eAJN-BhotI
A maybe easier way to find these, I have also put them in my Bardarbunga playlist, the 3 are at the bottom. If I will make more (no guarantee) I will add new ones to the list there as well
Ahhh, old times! I always like looking back at Bard. 😉
Thank you Virtual. Thank you.
I feel nostalgic watching the Barda timelape, I spent so much time watching the cams and learned so much from Bardarbunga/Holuhraun.
Awesome new lapse too, cool to see the “walls” building and then collapsing again.
Me too. I always think of Bardy/Holuhraun as ‘our’ volcano.
And now there is a methane hazard. Reportedly, magma that has over-run vegetation is cooking it into methane pockets which can then burn upon release.
I don’t know if it is related, but last night on “Hawaii County Police and Fire – East” on broadcastify, they were coordinating drone operations. During the operation, the drone operator called in something that Fire services noted was not a fissure, but a known fire that was burning in that area of the Forrest.
Here’s a video from sirens999sirens from today. He goes up close & checks out cooled lava, etc…
https://www.youtube.com/watch?v=ET2UJ_sevvw
I’ve been mostly watching Civil Beat, but had to come here to catch up on reading. Good articles as usual. 🙂
Now back to watching the fissures & listening to Rusty. 😀
The homeowner at the house with the cameras did a livestream.
https://www.facebook.com/john.davidson.161009/videos/10156487859483474/UzpfSTEzMDA5NzExMDM1NjM1OToxOTU5NTA4ODY3NDE1MTY1/
One thing he shows is how the native plants are doing well but the invasive species are dying. I’d suspected that must be true but it is nice to get confirmation.
Eruption Updates
Kilauea – 2018-05-23 19:53:04
Lava flows originating from central LERZ fissure system (5 & 13) is feeding a flow that looks like it will enter ocean adjacent to existing ocean entry.
https://volcanoes.usgs.gov/observatories/hvo/eruption_updates.html
Fissures east of 22 are getting a lot bigger right know. 22 might dry up soon and eruption moves up rift.
Here’s a livestream: https://www.facebook.com/Epiclavatours/videos/823186684531263/?hc_ref=ARR1qWyITV6Qp19TvyuzsIXi12fHlRt4Ftuao1rQ0Wqrk6m1GPuOINqR42eoNE4sC6Y
There have been about 10 quakes, M2.5 – 3.9 around the Kilauea summit over the past hour according to USGS. That seems to be a bit of an increase – can’t really see much on the KLUD drum, there’s a lot of noise – presumably weather or man-made – obscuring things to my untrained eye.
Given the history of the 1924 eruption, and it’s remarkable similarity to this event, you have to wonder if the 25th thing is gonna be real or not.
“A lava lake drained out of Halema‘uma‘u in February 1924, followed by a severe earthquake swarm in lower Puna, 50 km down the east rift zone.
…
Halema‘uma‘u Crater was 115 m (377 ft) deep following the draining of the lake. As seismicity waned in lower Puna, the crater floor began to collapse on April 29 [1924], deepening to more than 150 m (490 ft) on May 1 and nearly 210 m (690 ft) on May 7. Frequent dust clouds indicated continuing collapse in the following days.
…
The first explosion, neither seen nor heard, took place during the night of May 9–10 with small rocks reported to have been thrown out of the crater. Larger explosions followed, starting on May 13 and spaced a few hours apart.
…
the largest explosion took place on the morning of Sunday, May 18″
https://volcanoes.usgs.gov/volcanoes/kilauea/geo_hist_1924_halemaumau.html
9 May → 18 May => 9 Days.
16 May + 9 => 25-May-2018
“A number of these periods of increased ash emission sent plumes as high as 10,000 feet above sea level” (16 May 2018)
https://volcanoes.usgs.gov/vhp/archive_search.html
Now, I wasn’t there in 1924, and I am nowhere near an expert. That means my guesstimate can be off by a few days. I was particularly curious about one of the HVO geologists gingerly dancing around the idea that these current events have an uncanny similarity to 1924.
So, with the increased seismic activity at the summit, ya have to wonder just what is in the near future.
Perhaps May 25 is Pele’s birthday – celebrated occasionally by fireworks.
No, his birthday is October 23 )
My stock mantra about how to survive an eruption is “Don’t be there.” Interesting that HVO and the Park Service have moved their operations to facilities elsewhere on the island. Don’t get me wrong, it’s a smart move. But it also supports my idea that something gnarly is in the mix.
It’s better to be cautious and look the fool than to be dead.
” I wouldn’t touch her with a ten foot pole” → Billy Gibbons (ZZ-Top)
Well even if there is no eruption now, if the overlook crater is waterlogged then when magma returns, probably within this year, there will probably be quite a massive eruption, something more similar to the 1790 event (not anywhere near that big though, but bigger than 1924). Karthala volcano erupted this way in 2006, with the eruption happening through a deep crater and causing the first part of the explosion to be very explosive before lava started erupting and created a lava lake.
I dont now why there was no big explosion during the small eruptions after the 1924 event but maybe it was because of the small amount of magma available and possibly because the crater was much wider and not as deep?
I’m thinking of lowering the threshold on my ENS account at USGS to around magnitude 4.5 or so. I’m pretty sure that when it goes it’s gonna make a lot of racket. This way I’ll get an email that says “Hey, look!”
I believe it’s #20 that’s on Civil Beat cam. It was getting lower, but now it’s going strong. It seems a lot brighter than what it has been the other nights. Wish the cam was backed up a little. It’s beautiful.
Yeah – it’s hypnotising to watch. I’m trying to guess fall time for some of the blobs going off screen at the top, must be 4 to 5 seconds – that’s about 100m height.
There were some comments that the audible helicopter activity at the moment is because some of the other vents have started flowing again. But of course that’s from the youtube chat – where I’m learning that it appears I’ve overestimated humanity.
There are others who film on the ground for a short period of time then upload. One that has been doing that a lot is ApauHawaiiTours (YouTube). There are others I’ve seen on FB (some of the links I got from these comments.)
This has some great (daylight) footage of the uprift active fissures.
https://www.facebook.com/Epiclavatours/videos/823186684531263/?fref=mentions
Maybe this will help.
https://www.volcanocafe.org/puna-in-numbers/comment-page-1/#comment-26091
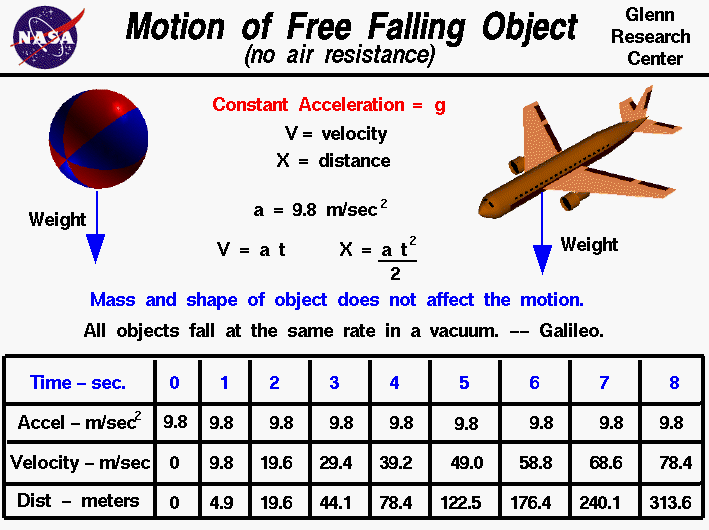
I hate to be a spoiler – but no I don’t think that chart helps. I think there’s been a mistake – the scale is marked height in metres but I think it’s showing height in feet. 5 seconds freefall in a vacuum indicates height of 122.6 metres approx = about 402 feet which is about what that chart shows.
If ya can wait till tomorrow I can review it and beat the poster to a pulp.
I hope we can trust NASA on the subject:
Dunno, they are pretty good at smacking mars with orbiters.
And, their anti-penguin ballistic missile didn’t quite make it to it’s target.
Nasa have a graphic showing an airliner flying in a vacuum?
So a WW2 bomber could have made it to the moon after all.
This is from just now.
From the lower east rift webcam:

From pu’u o’o:

I have done some calculations on how long it would take for this picture to become a reality:

Halemaumau is about 0.26 km3 in volume, and by guessing that the new overlook crater is about 400 meters wide and 400 meters deep, the volume of the two combined is about 0.45 km3. At the eruption rate of the last few years it would only take about 2 years to fill, and probably about another 6 years to reach the size of the picture… Of course it probably wont be without variation but it shows that things could happen quickly.
Alberto hasn’t even formed yet and the models already have it going all over the place.
NHC gives it a 95% chance of forming. I already have a sack of potatoes on standby.
What?!? A possible named storm/hurricane in May? That’s jumping the gun a bit. Don’t forget the potato peeler…
Can’t wait to see what they will call it. Mayflower.
Yes, early, but not overly so. June is next month. (so is 57 🙁 )
57? just a babe. wait till 75…. 😉 Best!motsfo…. Your heart will always be 16……
You’ve got the statistical advantage, you’re female. Plus, I’ve already had a run-in with cancer. It’s gotten to the point that actuarial tables depress me.
16? I wish other parts were 16.
Big jump back up in tilt
Meanwhile at Mauna Loa
And just for completeness
Mauna Kea
Those copycats !
Just checked Hualālai and HUAD went offscale high for almost two minutes at about 03:12 UTC (5:12 pm Hawaii).
Only thing USGS has listed about this time is “3.5 4km WSW of Volcano, Hawaii 2018-05-24 03:11:57 (UTC) -0.0 km”
https://volcanoes.usgs.gov/volcanoes/kilauea/status.html
Kīlauea Volcano Summit
Small ash emissions from the Overlook crater have occurred frequently through the day. Moderate trade winds were blowing to the southwest today and ashfall may be noticed in downwind locations. A small explosion from overlook crater at 06:44 pm produced an ash cloud that reached 7000 feet above sea level as determined by the National Weather Service radar. The cloud did not contain much ash and dispersed quickly.
Earthquakes in the summit area continue at a moderate rate, as does deflation of the summit region. At 05:12 this evening the summit area was shaken by a shallow M3.5 earthquake approximately 0.7 miles below the caldera floor that was felt by people in the area. Many smaller earthquakes followed for the next 1.5 hours. The sequence of earthquakes stopped when an ash explosion occurred at 06:44 pm. The earthquakes and ash explosions are occurring as the summit area subsides and adjusts to the withdrawal of magma from the summit.
Time-lapse video of the view of the eruption from the Gemini Observatory on Mauna Kea, 21-22 May:
http://www.gemini.edu/images/pio/facebook/GeminiCloudCamera_20180521.mp4
More info:
https://www.gemini.edu/node/21057
UK’s Independent newspaper running a story on blue flames seen in road cracks (with video):
https://www.independent.co.uk/news/world/americas/hawaii-volcano-blue-flames-video-footage-eruption-latest-a8366881.html
Take a look at the video posted upthread by GordyS at https://www.volcanocafe.org/puna-in-numbers/#comment-26036 for more of that.
One of the reasons the oil production companies were doing test drilling near the canary islands is from the idea that volcanic heat could have cooked the organic debris in the Jurassic era basin (pre-dating the Atlantic Ocean) to yield hydrocarbon deposits. The same cooking process is at work here with the magma cooking layers of organic debris to yield methane. It’s one of the thing that oil field geologists look for to find new deposits. Via soundings they search for organic deposits in ancient basin structures and a source of heat with enough time to cook the material into a hydrocarbon deposit. Add a capping structure to hold the hydrocarbon in place, bam, new oil or gas field. BTW, rift structures form excellent basins to collect organic material… and, one of the main constituents in natural gas, is methane.
Methane contains between 50.00 to 55.50 MJ/kg
How this would effect a potential heat output scale for volcanoes is nil. The energy comes from deposited biological material and not from the volcano itself. The volcano just provides the means to make it into a hydrocarbon.
Fracking near Hawaii is a really REALLY bad idea… We really dont need another source of fossil fuels and the idea of deliberately fracturing the base of an island chain that is prone to massive collapse events is beyond the definition of insane…
I never indicated that was what someone was working on. The only location I know of where exploration has been conducted is in the vicinity of the Canaries. And that was 40 to 70 km away from the islands.
Besides, Iceland fracks Hengill every now and then, and I’m pretty sure that The Geysers Geothermal operation in California gets fracked occasionally. Both of those are at triple junctions. I would be surprised if the Puna Geothermal Venture had not fracked the Eastern Rift Zone at some time. Hydrocarbon extraction is enhanced by fracking, Geothermal guys do it to increase steam production throughput.
If I remember correctly, the last fracking operation at Hengill tried to see if they could induce carbonate formation in the pores they opened up. The carbonate was supposed to act as a propping agent to keep the cracks open.
Semi related note. The Guy Arkansas earthquake swarm extended well below the depth of the WASTEWATER disposal wells in that area. (Type II wells). By mandate, that type of well is not allowed to exceed the fracture gradient of the strata they are drilled into. Regular inspections ensure that this wellhead pressure is not exceeded, if out of specs, heavy fines are enforced. To quell fears that increased pore pressure was to blame, the two wells in question were shut down. Yes, the quakes slowed to background levels, but in my opinion, they were not fully to blame. The alignment of the fault face for the quake swarm was almost in perfect alignment with the commerce fault up in Missouri. The Commerce fault is thought to be a boundary fault for the reelfoot rift structure. It’s also not the first time that area has had a quake swarm. Oddly, it had about the same duration as the most recent swarm.
better leave a note for future generations to come that there is some stuf there to be used for all sort of things
Wow. This is pretty extreme
Live Panorama of Lower East Rift Zone Camera from Lower East Rift Zone [PGcam]
Last Updated 2018-05-24 02:36:03 (HST), 2018-05-24 13:36:03 (local)
Although nowhere near as impressive as the next update 10 mins later
About my pending tropical storm.
Yes, it’s over a very ripe area for TS development. Yes, it has a warm eddy of water along it’s projected track (like Camile did).
BUT, it’s way early in the season for stable development, and unlike Camile, it hasn’t even formed yet. By the time Camile was in this area, it had crossed the Atlantic as a Cape Verde storm and had ample time to develop a very mature outer flow pattern. (highly efficient in moving energy into the storms core).
Steering currents are a bit dodgy, this is causing a lot of conflict in the projected tracks since there is no clearly dominant steering current. The downside is that if allowed to wander around in the Gulf, it could have time to get it’s stuff together and grow in intensity. The MJO is not really optimal for storm formation, but once it gets going that really doens’t matter. UK Met and CMC models show two different locations for it to form, the GFS model still doesn’t show it as forming. NHC places it’s formation potential at about 95%.
Several years ago, I had a lady in the shop getting her laptop worked on. She was not from around here (I think she was German, but with remarkable English skills) and she noted how plesent the weather was for it being May. Not what she expected. My response? “Wait until August.”
Ya see, Mid to Late Summer we get the sort of weather that Hank Williams Jr was talking about.
“That hot old summer sun, make you beg for your next breath…”
Some of the models are showing around 6-10 inches in parts of Georgia.
The 4″/hr rate is what worries me. That’s about the intensity needed to make my driveway into a lake.
A few years ago we had one stall out over south Alabama. I think it totaled around 12 to 18.” Though it mostly fell on the swampland that directly feeds upper Escambia bay, they had flooding up there. Brewton Alabama got hammered with rain.
was wondering how Your storm was brewing…. talked to a guy at our local wildlife center and asked him how long he had lived here and he said sheepishly… “I live in Florida… just visiting here… ” and i asked him how the storm was brewing and he was a little surprised that i knew about it.” 😉
Heh… you got an inside track 😀
I have to stay on top of what’s going on with the Gulf weather. Ya see, strange things happen during hurricane season. Occasionally supplies up and disappear, Insurance companies will not write new policies if an active system is out there, so you had best current with your payments or you could be ass out until November, and if a store decided to over price during an emergency declaration, they could easily cease to exist.
(The lot actually looks better than it did before. All the service station accessories and the building was replaced.) And the cheesy fast food restaurant next to it bit the dust as well, the new structures became a Baskin Robins and a Dunkin Doughnuts sharing a building.
We have a new used car lot around the corner here because the gas station that used to be there got busted for price gouging. The business went belly-up, they couldn’t keep up their lease payments and the lot got sold to the car dealer.
Florida takes it’s anti gouging laws seriously. 😀 😀 😀 (As well as it’s unlicensed contractor laws.) I’ve done work for several state agencies around here (part of the job) and have run across a few of their enforcement offices. I was going to one job and as I was going in, several of their armed officers were on the way out the door to go do a bust. At first I found it odd that so many were wearing tactical gear. Dunno what they were after, but it was pretty obvious that they were serious about where they were going. I hadn’t seen that much hardware outside the Sheriffs office or the Jail. (technically, you don’t see that sort of hardware IN the Jail. They keep a set of lockers inside the vehicle sally-port for officers that have to make access into the Jail itself.) As “Navy Police” we were unarmed off the base (night-stick only) so we just kept that in the Van when we were making a pick up, so we never had to use the lockers. {essentially, we operated as surety officers that could write a bail up to $500 to retrieve service members.} And yes, if the service member failed to appear at court, we would retrieve them from their duty station and take them back to the jail in order to save the military from being stuck for the full bail. I only had to go off bail for one guy, he was quite surprised when we showed up. We had an idea that he might bolt when we opened the Van up, so I had the clerk at the window drop the Sally-port doors before we let him out of the van. Talk about a “hang dog” look. “Well, if you had made your court date…” My “Navy Police” assignment was a temporary duty assignment. All local commands had to provide manpower to fill those billets.
(The experience from this assignment came in handy a few years later when one of my work-center guys got into trouble with New Jersey law enforcement. A diminutive Dominican, he didn’t take the prank his buddies pulled on him very well. They took him to a gay bar and he wound up in a brawl. For his size, he must have kicked some serious arse. They arrested him and not the three guys he squared off against) My intervention kept him from having military charges brought up for unauthorized absence. He was a good worker and deserved better than being left abandoned in lock-up by the command.
More from the ApauHawaiiTours guy. Same place that the blue methane flames were burning in the cracks yesterday.
And the same guy(sirens999sirens and ApauHawaiiTours on Youtube), has an impromptu interview with a couple of USGS people early this morning.
I am thinking the law enforcement in the area is getting kind of tired of him.
Ah the times, trying to stay one step ahead of the cops.
If the tour operator is going into areas where he is banned from, and I am pretty sure he is doing, then frankly he deserves to get arrested. However one thing that should be said: I believe that we should not put videos of the Sirens999sirens user here. That user rips off other Youtube users’ videos for their own channel. They are a leech and we should not be helping them do things in my opinion.
[Good point. I replaced it with the original by ApauHawaiiTours / –Lugh]
I apologize, I had thought they were one and the same. I will be more careful of the true source of what I post in the future.
They are VERY good friends, Scott lives there and is trying to help the neighbors, he can be my tour guide any day.
“is getting kind of tired of him.”
Dunno, I couldn’t get a stable connection to the radio feed last night, I do know that the official observers are using drones to monitor the area. The night before last I could hear them coordinating flight clearance for drone operations. It’s a bit hard to evade air assets.
From watching one of the early Travis Sanders streams, while moving from area to area through the rush he noted that you have to keep an eye on the ground in front of you else you might step into a bottomless hole. From that, and the fact that one of more of the lava rivers disappeared into a hole, I have to wonder if the whole area is littered with subterranean passages left by ancient lava tubes. Anyone trying to flee on foot had best keep their awareness if they bop out into the brush trying to evade.
Years ago, my friends and I were chasing each other around a local clay-pit. While being chased, I inadvertently ran off across a dead-fall in the dark. It took me 15 minutes to extricate myself from the limbs and branches in that pit. I learned a valuable lesson. Be careful where you run because sometimes the ground disappears. My friends just stood their laughing their arses off. (It’s all good, I got my payback… in time.)
Yep, one has to use caution and common sense. He also mentioned they were going to try to get some machetes…for what? And he has complained about comments telling him to be careful. Not thinking I’d be taking a tour with him. That’s the kind of person that will get everyone banned from the area. But he does post some nice videos, and as far as I can tell he has personally taken
It’s too bad that the USGS does not have the funding for anything more than static cameras that only update every 15 minutes or so.
I was thinking the same thing about the tour operator. He keeps telling people he is in NO danger whatsoever — even when trees are falling down near him.
I wouldn’t use his business.
I’m glad he is making the videos though.
I ve only seen one of these holes so I dont know where the others have formed. The one I have seen was aligned with the fissures so instead of being lava tubes collapsing I think that these holes are formed by the opening of the rift. Holes similar to these exist at many places along the rift zones, especially at the southwest rift zone where they even merge with each other forming the Great Crack at the lower part of the rift.
The distesion and fracturing of the rift can generate small cavities wich then collapse. These pits form over normal faults at Iceland, Mars and Venus. They should be common at the east rift too but maybe the higher volcanic activity fills them up much more faster than at the southwest rift. In fact there used to be a chain of caves/pits aligned with Puu Huluhulu before Mauna Ulu buried them up.
They may be an added hazard to fissure eruptions.
About 20 years ago the local Sheriff’s son decided to borrow his dad’s work car and crash a gravel pit party(keg/kegs of beer way out in the middle of nowhere). He came in with the siren going and the lights flashing. Everyone scattered, I guess it sounded like a heard of cattle going through the woods. It is all fun till you lose an eye as my mother told me. A couple of the kids ended up in the Emergency Room. I’ve never heard what happened to the perpetrator.
It is a bad idea to run through the woods, in the dark….especially if you have cracks forming where there were none before and a breakout cutting off your escape route.
The only risk in the clay pit was falling off a bluff or into a dead-fall. We were quite inebriated… old enough to know it was stupid, and young enough to not care. The bluff didn’t worry us because we were already at the bottom of the cut. The only other hazard was running into a parked bulldozer, but we had a pretty good idea where they were parked.
Another continuous timelapse from 2320 UTC 23rd may to 1728 UTC 24th of May ( at least this way anyone can figure out the time without getting confused by summer time and timezones 🙂 )
Its 720 times real time.
The main event is close to the end when it collapses again at dawn. The fountain is noticeably smaller after that for a while (and maybe still is)
https://youtu.be/J3r_pL9o6pE
Also at the end of the bardarbunga playlist on my channel like the other ones
Regarding the comments, at the former posted timelapse, on the Bardarbunga event, I suspect that event was for many a gateway into volcanology. It was for mine. And I suspect this one will do for many as well.with the live streams of lavarivers and fissures this close at the camera.
Also on blogs like this excellent site you get a really good explanation of the mechanisms and possible future activity and then to see some of those ”predictions” becoming reality makes understanding a lot easier, so a good shout out to all of you.
Maybe my previous post disappeared. Well to make long story short: A new timelapse at 720x speed
https://youtu.be/J3r_pL9o6pE
Also added to the bardarbunga playlist like the others on my channel for easier reference.
And regarding the comments at the previous timelapse, Bardarbunga for me was a gateway into volcanology and I suspect for many others.
And last, a huge shout out to the writers and knowledgable commenters to give good explanation and inderstanding of the mechanisms that are at play here
I am one of those “many others”. 🙂
Interesting USGS tweet regarding Spectronet youtube channel shutting down anyone else showing spectrograms by claiming copyright. Youtube seems to automatically accept copyright claim take downs are valid until shown to be otherwise.
“We’ve heard concerns from ppl using our Swarm software to monitor seismic activity at Kīlauea & posting videos of the tool—it’s free, Public Domain, open-source software. In other words no one holds a copyright and anyone claiming otherwise is incorrect. ”
https://twitter.com/USGS/status/999662131447566336
BUAHAHAH!!!
USGS made it public, Spectronet can’t do shit. That’s TAXPAYER FUNDED data.
That makes them liars and THIEVES.
Grifters gonna grift.
YouTube is trying really hard to piss everyone off… They support the Paul brothers basically to the end as long as they make them money, and take 5 years to actually realise their kids app is full of abusive ‘parents’ making their children act to get money, but they make the word ‘atheist’ a trigger for instant permanent demonitisation (religious freedom my ass), and anyone who makes anything related to chemistry gets shut down because apparently even in 2018 chemistry = making drugs or explosives… I don’t think they realise that anyone who wants to make either of those things will likely already know how to do that and probably knows much more than a YouTube video could tell them anyway…
USENET still has gigantic gobs of information that can educate. (yeah, it still exists). Quite useful info as well as the far less than appropriate stuff. I remember I needed an odd nearly obsolete printer manual once, I could not find an electronic version ANYWHERE. Even with the mfr. But I found it there. BTW, if you go looking for the Anarchist Cookbook, you’ll probably find it, but I HIGHLY reccomend that you DO NOT try to replicate any of the recipes. Many of them are capable of killing you while you cook. Just to give you an example, Mercury(II) fulminate used to be used in primers for ammunition. As you are rolling out the finished mix, if there is one single dry spot in your goop, you will set off the entire mix as you roll it out in your primer caps.
Based on info from my Dad. (He grew up in a separate era). Evidently he had lost a friend because of that many many years ago. (My dad was a teen during the Depression)
And, I’m not entirely sure, but I think TATP has a similar instability. I’ve read far too many reports of improvised TATP based devices prematurely detonating.
Note for anyone looking to investigate. I’m not into explosives. My info is cursory to previous employment… and I’ve had quite a few EOD and Gunners Mate friends. I can give you horror stories about ordinance falling off of pallets or dangling nose down from a helo… but that’s about it. (the sort of thing that makes you want to stop watching flight ops and just go get a cup of coffee.) {Per an EOD tech I was standing with, the dangling ordinance was in no danger of going off}
Besides, I’ve had to crawl over and around pallets of 500 and 1000 lb iron bombs just to get to my watch station.
Since the USGS was so gracious to clarify the GLARING LACK OF INTEGRITY and likely FRAUDULENT activity of Spectronet, this is a section from the SWARM help manual;
“SWARM was developed at the Alaska Volcano Observatory (AVO) in
2004 and is still used at various volcano observatories around the world.
The latest version of SWARM can be obtained from
https://volcanoes.usgs.gov/software/swarm/download.php”
https://volcanoes.usgs.gov/software/swarm/doc/swarm_v2.pdf
BTW, Swarm is a JRE runtime and should be able to function on any PC/Mac/Gizmo with JRE 8.
How to set it up? Well, I’m working on that. My last JRE thing I played with was LandSerf. A tool to consolidate and manipulate topographic data. It wasn’t the most efficient package. So far, Swarm seems to be quite spiffy and much more clean in it’s functions.
I think I’m gonna like this tool…. → Very cool. You can hit multiple seismic networks with it. By default, you get Alaskan and Kamchatka networks.
This appears to be a “keeper” in my opinion.
Motsfo may be interested in getting this running on her PC, or to take a moment to coerce her IT gifted family members to get it up and running. The program can be configured to auto load a default configuration file at boot, and having it pop up with this sort of display could give you a quick glance into how your neighboring volcanoes are behaving. BTW, those wave traces are updating in near real time for me.
(Redoubt area)
I’ve had issues in snagging the seismo network names for IMO in the past, but I have list of other networks somewhere around here if I can remember where I was pulling them from for another software package I was running for trace analysis. Seis2K was the package I was looking at then. It’s more focused on waveform picks than anything else. One function that it has is the ability to get an FFT off of an event with the highlighting of the waveform and the click of a button. Handy if you want to get the knuckle roll-off frequency for a quakes waveform. (handy in determining the length of a failed fault section)
Running it myself. The example FDSN data source it gives in the manual is valid and the other main public one is the SeedLink server at rtserve.iris.washington.edu
I’ve currently got RIMD, BYL, PAUD, JOKA and MOKD in tiled time-aligned spectro mode onscreen.
Thanks!.. now, if you wish to prove your Gandalf level wizardry…. give me a line to Icelandic data. I’ll even defer my next scheduled article space to you if you can figure it out 😀
(I don’t really have a scheduled article, just a Hengill post that I never got around to fleshing out. I’m easily distracted… and according to an old division officer, “easily amused.”)
(Dunno how much stock I put in his opinion though, his goal in the US Navy was to get out and work on a horse farm. He had caught me studying a book on orbital mechanics in my off time after watch.)
They are there under the SeedsLink feed under country code II !
🙂
Sorry maybe that’s just BORG
Yeah, about the same as I had with Seis2K, only station BORG is in Iceland.
But, I did find 4 more under network 7J. But they are geared towards looking at calving glaciers.
Network VI has one station, ISKR at SKROKKALDA, ICELAND. That’s near the northern end of the dead zone. Might be handy later.
A good cross reference to find seismo stations.
AIND seems to be pretty close to Kilaueas summit and is a good snag for energetic events there… but they mostly come across as a sort of square wave.Scratch that. OBL is at the Observatory Lodge.
http://www.fdsn.org/networks/detail/HV/
Son happens to be visiting and he is interested in this…. i’m not allowed to leave this site until he sees it… so…. he’s an official smart person. Best!motsfo
You have mail. (To your VC registered address) should you loose your place on this page and need to find it again.
Ah Mots. At my job(IS tech) I have had to teach people(a couple of older grandma like people) how to use a mouse on a computer and help them navigate the screen so they could launch the program they needed. Spent over a half hour with one. I had an Intern with me on the last one. He asked me how she could be so stupid, that pissed me off. I kind of knew her. I told him that she can cook up a full Thanksgiving day meal for 20 without consulting a cookbook and have everything come out perfect, then asked him if he could do that. Of course he said no. So I said, “I guess that makes you stupid.”
He is not smarter than you, you just have not worked with that kind of thing before.
That does not make him smart, or you stupid. 🙂
Not intending to sound patronizing, but he is correct. Experience is what saves peoples lives. I had an equipment de-install I had to do on a decommissioning ship. I followed the equipment tag out procedures to the letter, even going a step further to check the engineering diagrams to make sure there wasn’t something in the power feed that I had missed. Gut feel told me to be hyper cautious, so I put on the 10kV gloves and leather overgloves… and a face sheild, just in case. Sure enough, I cut into live line and blew the end off of my pliers which embeded itself into the lagging (insulation) on the bulkhead. As soon as I saw the blue flash and heard the pop, I froze until I could see again. Sure enough, some dip$@#$ had tied into the power feed for my equipment without approval or updating the ships electrical engineering diagrams. Since the “mishap” had destroyed the cable and it was effectively severed from my gear, I taped it off and advised the ships electricians that the line was still hot despite the tag-outs. Knowing how stupid things can get over the 30+ year life span of the ship with the add-ons and missed diagram updates caused me to be overly cautious. That saved my arse from power feeding back into my side of what was supposed to be a dead circuit. Just to double the piss-off, I endured the investigation into the matter while all of my correctly tagged out switches were re-verified by an independent third party. (Under standard procedure, a 2nd person verifies the tags and switch positions before the tag-out is accepted as being in place.) It turned out that the inappropriate circuit modification was likely done long before I was ever assigned to the ship.
And now there are three ocean entries.
https://volcanoes.usgs.gov/observatories/hvo/eruption_updates.html
Kilauea – 2018-05-24 17:24:16
Low lava fountains are erupting from an nearly continuous 2-mile-long portion of the LERZ fissure system. Two main channel of lava are moving to the south and producing 3 ocean entries.
Kilauea – 2018-05-24 00:59:13
A small explosion from overlook crater at 6:44 p.m. produced an ash cloud that reached about 7000 ft above sea level as determined by National Weather Service radar. The cloud did not contain much ash and cleared quickly.
I would think there would be another quality overflight video out there somewhere….
Mick Kalber does overflights every day and uploads them onto vimeo, he is on the same helicopter as Bruce Omori but he edits his videos for stability instead of livestreaming them like Bruce does.
I think fissure 22 is almost dead too, the lava fountain is barely above the spatter cone now on the livestream. Seems like fissure 17 is also dying, although it is hard to tell because it is rarely looked at by HVO or the livestream. The main lava activity is more uprift now by the looks of it, including deep within leilani estates near fissure 8, which is well within the north drainage.
It is also possible that this eruption will be episodic like some of the previous eruptions were. This would probably result in a geyser-like effect and high fountains and cinder cone formation, as well as lava flooding over the whole area…
It is possible that lava fountains will get much higher in the next week if the fissure manages to centralize to one or two close vents too. This happened quickly in 1960 but only really happened towards the end of the 1955 eruption after several months of intermittent activity elsewhere. Possibly if the eruption declines then resumes again it would seal off most of the vents, and when it then has to erupt through one location it will have to erupt at a pretty huge rate to keep up, leading to high fountains. I think that is what happened to both pu’u o’o and mauna ulu multiple times.
why did it put that video as the link?
(can someone with powers replace it with the actual link instead)
GL Edit: STRANGE™.
Manually going to the “Cody’s graduation link” yields a page of videos. Letting WP do it inline, shows Cody’s graduation.
→ Beats me. Hopefully 24 May is close enough.
Edit Add: Evidently Vimeo processes the requested URL as a CGI variable and spits out what it thinks is appropriate. It’s a valid way to deal with CGI, and I’ve done the same to protect the integrity of locked down directories full of non-public .pdf files for a realtor and his outlying offices. The non publicly accessible directory could only be accessed via my CGI script and it’s authentication procedures. Though valid, it is quite un-nerving when you hit something like that by accident. It probably uses some environment variable such as a cookie to determine what should be returned by the request. Since we don’t have “your” cookie that you got from them, Vimeo just spits out whatever. And, no, trying to share cookies is a bit beyond the scope of doing things in a safe manner. That’s why it’s a pain in the arse and prone to all sorts of security issues among users. Besides, cookies are typically a randomly generated hash that expires after a period of time and is only valid for a specific session. (Which is what cookies were actually supposed to be for. Keeping sessions valid and preserving state information between the client and server.)
Thank you for the video.
Yes, the eruption is moving back up rift. Even the professionals on the ground do not know what is going to happen next. Not a lot of data to go on in geologic time. All we really know is that the island has gotten big for a reason.
Well, at least there are no fundamental questions that need to be accounted for like at Iceland… such as why the island grows faster east to west than it does north to south. (It’s halfway complicated, but it has to do with the geometry of how the hotspot and rift got to where they are at.)
If you said “duh, the spreading center is oriented North-South” you would be almost correct… but some funky plate-shard rotation and the Jan Mayan micro-continent are in play also. This also leads to my pet theory that Iceland is so freaking thick because it’s a pancake. A section of crust laying on top of another section of crust. See, there used to be a subduction zone in this area millions of years ago. Something like “super subduction” probably started but never finished like it did east of Montenegro. (in fact, that region east of Montenegro had several instances of reversing subduction processes as the Tethys got gobbled up.)
21 new (Red dots) in the Kilauea area. The last 14
2018-05-25 00:50:55 2.5 0.7
2018-05-25 00:48:53 2.9 0.7
2018-05-25 00:47:53 2.8 1.6
2018-05-25 00:41:11 3 -0.2
2018-05-25 00:20:37 2.4 1.6
2018-05-25 00:19:56 2.9 0.7
2018-05-25 00:17:56 2.2 -0.6
2018-05-25 00:14:39 3 0.8
2018-05-25 00:04:55 2.8 0.3
2018-05-25 00:04:38 2.8 0.7
2018-05-24 23:58:20 2.9 0.7
2018-05-24 23:54:08 2.7 0.6
2018-05-24 23:49:07 2.8 -0.3
2018-05-24 23:40:13 2.8 0.7
So the fountain that was on the stream no longer exists.
I’m guessing that means the eruption is over in that area?
Keen:
(OK it’s fake news – but had me fooled for a second or two)
Aaah… broken URL Try this:
http://www.staradvertiser.com/2018/05/24/hawaii-news/puna-man-just-wanted-to-live-after-nearly-losing-leg-to-lava-bomb/
Had a laugh reading the interview with the dude that got lave bombed, not a lot worries him.
“Keeping an eye on the bombs is “like catching a football or baseball on the run,” he said — only “you don’t catch it.””
A new map from HVO. Red means new extensions of the lava flow. Note the one in the Leilani estates. If that breaks out southwards down-hill it would probable go along the western edge of the Malama-ki forest which on the maps look unpopulated.
That one isn’t going to go south, the topography is too high that direction. This flow will go north if it picks up, and it looks like the natural uprift progression of the eruption will lead to that happening in the next few days. Either that or the eruption will stabilize at fissure 15 and 6 and begin high fountaining (which is really only slightly better).
Looks like fissure 17 is proving to be a persistent feature, 2 weeks old in two days.
Also is your estimate for the volume of this eruption correct? I did some calculations and the average eruption rate over the last 6 days would be about 12 million m3 per day, which is nearly as high as mauna loa in 1950, and much higher than any other kilauea eruption in recorded history. The eruption rate in 1960 was between 1 and 3 million m3 per day and that eruption had 100+ meter lava fountains from day one (which this eruption has managed only once very briefly so far).
The area coverage which I estimated seems about right. The volume was more of a guess, where I used an average thickness of 5 meters across the flow field. If that is 1 meter, the volume would reduce to 0.01 km3. I initially used an optimistic 10 meter, but looking at the pictures decided that seemed too high in most places. A volume between 0.01 and 0.1 km3 seems likely, and probably closer to the lower limit than the upper limit. That is still 10 million cubic meters at minimum. You probably shouldn’t ignore the amount erupted in the early days of the eruption: it didn’t go far but it was along a fair length and quite high in places. Still, 1 million cubic meters per day seems about the minimum and it may indeed be several times that.
Is this worse than 1960? The height of the fountains is not an accurate predictor of flow rate. And remember that the current eruption comes from quite a long fissure with a lot of fountains.
I would not be surprised if this eruption is putting out in two weeks as much as Pu’u’O’o did in a year.
Any one worked out where the dacite-looking lava originated from for fissure 17(?). Older evolved magma that has been lurking in the rift zone?
The andesite at fissure 17 is formed either by evolution of the magma body formed in 1924-1960, or due to mixing of a dacitic melt with the new basalt. There is actually a lot of more evolved magma types in deep dikes in the rift zone, in addition to the molten dacite that was found, there was also a lot of diorite dikes. Diorite is the intrusive equivalent of andesite so maybe the possibility of andesite erupting really isn’t all that low and it might just be the low eruption rate in the area during historical time that has lead to it being a mystery. It is possible that quite a lot of the bigger eruptions in the area involved some andesite and it was buried by later flows before now.
I think that with lava fountains the bigger the fountain the higher the flow. This doesn’t compare really well to different volcanoes, e.g etna frequently has 1 km tall fountains but small slow lava flows while holuhraun had no fountains for most of the eruption but a very high flow rate. However considering that this eruption now and the 1960 eruption are occurring in almost the same place on the same volcano, it wouldn’t be unrealistic to assume that the high fountains of 1960 (>300 meters) had a higher effusion rate than the eruption now. It is maybe not producing as much actual lava because a lot of it goes into building a cinder cone and tephra field with a lot less of the lava flowing out as a liquid (possibly the reason why the longest lava flows from pu’u o’o happened early in its life, in 1983, before high fountains were the norm) and that there is almost none of that happening in the current eruption because of the small fountain size (<100 meters).
I do agree that the eruption rate is enormous compared to the eruption rate at pu'u o'o. The last large flow at pu'u o'o happened in 2011, and that flow still stalled out at about half the distance that these flows went in the same amount of time. There was an eruption in 1998 from several flank vents of pu'u o'o that created a channelised a'a flow that reached the coastal plain, but that lasted less than a day (and there are no pictures of it in action either). Everything else after 1986 is beyond dwarfed by the current eruption. Must be well over 100 m3/s over the whole fissure, which is comparable to mauna loas 1984 eruption. It is possible that we majorly underestimated how fast kilauea can erupt because nearly everyone who knows anything about it associates it with slow extensive pahoehoe flows, not rapid fissure eruptions.
Maybe this eruption is kilaueas equivalent of the 1950 eruption, being the culmination of long term east rift activity and marking a switch to long term voluminous summit activity like what happened from 1100 ADto 1500 AD.
The height of the fountains would be influenced by how much pressurized the rift zone is? Because some major stress changes are thought to have taken place at the rift after the 1975 kalapana earthquake. If there is such a clear difference between the lava fountains before and after this date then this may be the explanation.
I still dont see how the activity is going to focus at the summit. During the last effusive period lower Puna suffered way more eruptions than what we have seen up to now during the one we are in. Also a sudden switch from intrusions into the ERZ to all the lava coming out of the summit should be accompained by some noticeable change at the plumbing system.
I have been thinking that if a major collapse of the middleERZ-summit conduit was to happen then the activity would have to focus around the summit, the Southwest Rift Zone and Kilauea Iki. You were right that appart from Kane Nui o Hamo no other of the larger old pit craters of the ERZ seem to be associated to long lived vents. With the help of some old topographical maps it seems that at least West Makaopuhi, Alae, Aloi, Pauhai and Hiiaka are not associated to shield or cone like structures.
If Napau or East Makaopuhi were I would expect someone having noticed something odd at the exposed crater walls by now.
Also about what we were taling about the pit craters in the older post, the Aila au flows missed all of the pit craters flowing west of Hiiaka crater. At least according to this map:
https://www.researchgate.net/figure/Locations-of-all-14-C-dated-lava-fl-ow-samples-on-Kilauea-Volcano-Hawaii-color-coded_fig1_273209006
So the craters could very well be older than Aila au. They still look recent because of the recent looking trees.
The much higher eruption frequency of eruptions in puna during that time was still something like 5-10 years between eruptions, while I calculated that it would only take about 10 years for that second picture I made to actually become a reality at the eruption rates that have characterized kilauea since 2008. You might be surprised to know that if the overlook crater was the only active vent after 2008 then it would have filled halemaumau entirely within 1.5 years and probably leveled the caldera floor and overflowed by this point… Basically what I am saying is that the overlook crater could overflow again, fill halemaumau and make a large lava shield long before it is likely that another eruption will happen on the lower east rift. Realistically if the rift closed up entirely for 10-20 years then the summit would overflow even faster than I predicted.
Something I just thought about while doing this is that the aila’au eruption by the current models doesnt really make any sense. In order for the lava to flow 45 km to the ocean it must have had about twice the eruption rate that pu’u o’o had when the June 27 flow happened. So the flow itself probably was emplaced as many individual flows that overlapped and covered the total area over 70 years of eruption. The volume of aila’au is only a bit higher than pu’u o’o but the eruption lasted twice as long, so the only way for this to work is that the lava must have been pretty intermittent over that time. This is something that I haven’t seen mentioned anywhere but which could be an important factor. The gaps between flows were probably rift eruptions and intrusions. I guess eventually one of them was bigger and it all ended completely, and then the caldera formed soon afterwards.
The lava pond on the PG cam is growing.
When it bursts there will be a rapid surge of lava out of the pond. At the moment it has been dammed between the topographic high to the south and the fissures that erupted in the first week of the eruption, but when it finds a way out it will quickly glow to the north and around to the right behind the webcam. This is a very damaging fissure compared to the ones going to the ocean, as this flow could basically take out all of lower leilani and will very likely flow far enough to cut off the highway that leads to kapoho. It is somewhat unlikely to reach the ocean because of the distance (12 km starting from the fissure following the steepest descent) and the short lifetime of the fissures now but really anything could happen.
There are more cracks on highway 130 too and they are getting bigger quickly… With the way things are going it wouldn’t be unlikely for an eruption to happen there eventually.