I feel fascinated by volcanoes and I think that’s quite obvious, but there’s also room for other natural phenomena, like weather. In Spain, my home, volcanoes are rare. We do have a ~10,000-year-old monogenetic volcanic fissure in northern Spain, part of the Catalan Volcanic Field, a cluster of weak alkaline volcanic fields that have been episodically active for more than 10 million years. However, for the most part, volcanoes are not present in mainland Spain. I more directly experience other natural events like thunderstorms, but what I didn’t know until now is that the weather may have more volcanic in it than I thought. This year’s very anomalous weather in Spain might well be linked to a series of middle-latitude, northern hemisphere volcanic eruptions. And here I will explain why I think so. It all started in Kamchatka.

Map with the volcanoes discussed in the article.
The April 11, 2023, Shiveluch eruption.
Russia’s Kamchatka Peninsula is home to an impressive bunch of volcanoes. The Klyuchevskoy Group and Shiveluch in the Central Kamchatka Depression are probably the most productive stratovolcanoes on the planet. At the northern end of the volcanic arc, towering 3 km above the Central Kamchatka depression, lies Shiveluch volcano, a mainly andesitic volcanic edifice with a volume of 1000 km3 that started to form 80,000 years ago or earlier. A double, nested landslide headwall encloses an active lava dome that has grown since 1964. The volcano effuses viscous andesite lava more often than not. The effusions frequently collapse into pyroclastic flows. For a distance of 15 kilometers to the south of its lava dome the landscape is a volcanic desolation of ash and rock, created by debris avalanches and pyroclastic flows from this very restless volcano. Shiveluch is also a prodigious source of plinian eruptions, including a VEI 5 event in 1854, a VEI 4 in 1964, and the eruption that interests us, the VEI 4 of 2023.

Shiveluch volcano. NASA image taken fro the ISS.
On April 11, 2023, Sheveluch entered a plinian eruption. A massive cloud of ash and gas spread out from the volcano to heights of 20 km, mantling nearby towns in tephra. Pyroclastic flows traveled distances of 19 km. This was probably the largest volcanic explosion this year. I’ve seen various estimates of the amount of sulphur dioxide produced by the eruption ranging from 700,000 to 100,000 tonnes of SO2. Overall the values seem to move through loading typical of VEI 4 eruptions. Volcanic SO injected into the stratosphere reacts to form H2SO4, and it is known that this sulphuric acid can act as an aerosol that reflects sunlight back to space and cools the atmosphere. Generally, the atmospheric effects are only considered for very large events. For example, there is a lot of talk on how Hunga Tonga will affect the climate although focused on the major water injection rather than the SO2. Smaller events like Shiveluch are generally ignored. Craig Heden suggested a while back in the comments that the eruption of Klyuchevskoy that happened later this year could enhance cyclogenesis over the North Pacific. I found it interesting but didn’t think much about it at the time. Now, however, I’m starting to consider the importance of minor eruptions in driving important weather changes based on what happened this year in Spain.
A showery June of 2023 in Spain
Spain had a really dry spring in 2023. Except for northwest Spain, most areas got a very small fraction of what they should have, with the worst conditions in eastern Spain. For example, Valencia in the east got just 4 % of the 1981-2010 median rainfall between March 1 and May 10. Barcelona in the northeast faced similar ghastly conditions with just 7 % of the rain median for the same period. To a lesser degree, these conditions were widespread throughout Spain in spring, which is usually an important time for rain in the country. This was just the continuation of a long-lived drought from previous years. Thankfully, the weather pattern reversed abruptly in late May.
May brought a curious episode of anomalous unseasonal rains to Spain. The onset of the unusually wet weather was on May 20. Rains were most frequent from about May 24 to June 12, and during this time given locations in mountainous areas would get showers most days. I was in a mountainous area myself and recall that noon showers would usually happen on consecutive days. I thought this weather to be strange and different from my earlier experience for this time of the year. I have checked a particular station in the Albarracin mountain range on the basis that it is one of the highest areas of the Spanish interior, which concentrates rain. This station shows some 8 storm days for the first 12 days of June 2023 but shows no storms whatsoever for the same period of the dry 2022 and 2021 years and only two storm days for 2020. After June 12 the weather got somewhat drier but continued to be unseasonally wet until July 7, after which a very dry period ensued in July and August, which is in line with the recent years’ trend of drought conditions. However, thanks to the June rains, the summer ended up having more rainfall than usual in most places, despite the very dry July and August months. The unseasonal rain complicated harvest in places but also probably averted what would have otherwise been a hellish fire season.
I have put together a table that shows rain accumulations in several important Spanish cities distributed over the whole peninsula. The data is for the May 18-July 6 interval, July 6 included. I extracted the data from AEMET graphs, and since it comes from graphs and not reported values it may not be the perfect value measured but it must be close enough. I compare it to the median rainfall over the same period for the 1981-2010 years that is reported by AEMET. Overall the whole peninsula was bathed in an abnormally high amount of rain, with the only exception of Barcelona in the NE end. There is a relationship with latitude. The rain anomaly is more strongly positive in the south of Spain whilst in the north it is more subtle. The south got up to 10-30 times the amount of rain in a normal, median period. This is in areas that don’t usually get rain for this moment of the year because they are under the influence of anticyclones that migrate northward during summer, bringing stable weather. I think what we saw was a southward migration or expansion of the mid-latitude lows, jet stream, and associated rain, bringing unusually unstable weather, particularly to the southern half of the country although also to the northeastern interior (Zaragoza or Teruel). The total amount of rain must have been greater in mountainous areas, Teruel I think is the only city here that can be considered as being mountainous, and received 200 mm, the most rain, in the time considered.
Rain accumulations for the May 18-July 6 interval |
||||
| City | Rainfall for
interval in 2023 (mm) |
Median rainfall for
interval in 1981-2010 (mm) |
Percent of median precipitation for interval in 2023 | Latitude |
| Santander | 114 | 90 | 127% | 43° 25′ 26” N |
| Santiago de Compostela | 162 | 118 | 137% | 42° 53′ 17” N |
| Pamplona | 160 | 90 | 178% | 42° 46′ 37” N |
| Zaragoza | 112 | 39 | 287% | 41° 39′ 38” N |
| Valladolid | 71 | 48 | 148% | 41° 38′ 27” N |
| Barcelona | 24 | 35 | 69% | 41° 17′ 34” N |
| Teruel | 207 | 91 | 227% | 40° 21′ 02” N |
| Toledo | 102 | 38 | 268% | 39° 53′ 05” N |
| Valencia | 89 | 21 | 424% | 39° 28′ 50” N |
| Cáceres | 119 | 35 | 340% | 39° 28′ 17” N |
| Murcia | 90 | 30 | 300% | 38° 00′ 07” N |
| Córdoba | 82 | 17 | 482% | 37° 50′ 56” N |
| Sevilla | 87 | 3 | 2900% | 37° 25′ 00” N |
| Almería | 73 | 6 | 1217% | 36° 50′ 47” N |
Now, the question is, is there a link with Shiveluch? I’ve been wondering for a while what could have caused the anomalous rains of June. Because when something happens there must be a cause, and in this case, it seems to have been quite an exceptional anomaly so must be caused by something exceptional. I first wondered about El Nino, but to my knowledge, El Nino does not strongly influence storm activity over Spain, or at least there is no precedent that I know of. In general, ENSO is not supposed to have a strong effect on Europe, though I may be wrong. Also, El Nino continued ramping up through July and August when the conditions shifted back to dry in Spain. The Quasi-biennial Oscillation was positive in 2023 but was also positive in 2021 when there was a dry June. The Solar activity was higher than in previous years but not that high above 2022 to really suspect anything. However, Shiveluch could be just right. Its eruption was on April 11. The sulfur dioxide cloud of Shiveluch reached the North Atlantic on April 20-21. Presumably, the driving mechanism would have been cooling induced by the sulphuric acid reflecting sunlight into space. The cooling may have taken some time before altering the weather patterns. There is a month that elapses between the sulfur dioxide cloud reaching the longitude of Spain on April 20 and the onset of wet weather on May 20. Overall the rain persisted over Spain for 1-3 months following the Shiveluch explosion. So I think there may be a link.
Later down the year
It doesn’t end here. 2023 has featured more explosive eruptions in middle northern latitudes and I think they have also affected Spanish weather. Shishaldin comes in. Alaska’s Mount Doom is how Jesper refers to Shishaldin, a fitting name for this basalt stratovolcano, that is large, young, and symmetrical. Subduction zone basalt can be quite dangerous, don’t be fooled by the friendly gas-poor tholeiites of Hawaii or Reykjanes. Shishaldin is in fact a capable explosive volcano. Its steep conical peak has been built by numerous subplinian eruptions with lava fountains. Roaring towers of fire shoot above the icy summit of Shishaldin as glowing snakes creep down the flank and curtains of black tephra rain from the sky. The pure white of the mountain is now ruined with volcanic waste, but not for long in the unforgiving climate of the Aleutians.

NOAA Photo Library image of Mount Shishaldin. Shishaldin’s eroded predecessor, Isanotski, lies behind.
Shishaldin started to produce some activity around July 14 consisting of a minor eruption with limited SO2 cloud. This was followed by a series of remarkable eruptions all producing substantial sulfur dioxide clouds that drifted for days before fading into H2SO4 and spiraled around mid-latitude cyclones. The clouds were not as large as that of Shiveluch and did not reach too high, only about 10 km, but this is just enough to have made it into the stratosphere so far north, and maybe aided by frequent cyclones. The eruptions happened on July 26, August 4, August 15, August 25, September 5, September 15, September 24, and October 3. As you may have noticed these 8 subplinian eruptions and the smaller preceding event happened at regular intervals of about 10 days, almost like a clock. I do not know the mass of sulfur in these clouds but to my eye, from the density and size, the 15 August and 5 September events look more robust. Since they were periodic they must have had around the same size but not all may have had the same explosivity, some may have produced more lava and less plume, while others may have injected the SO2 higher up.
Now, the interesting thing is that once again there seems to be a weather response in Spain. I turn to Madrid, the Spanish capital because this area has been the most affected by an exceptionally wet Autumn. Autumn (here meaning September, October, and November), has been more rainy than normal in most of the country. However, the center of the peninsula takes the prize. For the entire period considered, the rain in Madrid, which has a central location in the peninsula, is 3.5 times the normal year amount of rain. More than 350 mm of rain accumulated in Madrid during these 3 months of 2023. Madrid had no rain during July or August. The first substantial rain event lasted September 4 and 5, where a series of thunderstorm systems brought some 90 mm of rain. Could have ended really badly, because an intense stationary mesoscale system that was originally forecasted to hit Madrid ended up somewhere else. Had it hit Madrid the amount of water dumped in a short amount of time would have collapsed the city and flooded many places. Assuming there is a volcano-weather link, the Shiveluch eruption would have taken 39 days to show up as an irruption of wet weather in Spain back in May. For Shishaldin, the time elapsed between the first subplinian eruption and the September 4-5 storms is about 40 days, nearly identical. Some significant rainfall events continued until September 17, when things became stable for a while.
Unstable weather resumes just before mid-October, and on October 19 an atmospheric river ahead of a cold front soaks Madrid in more than 100 mm of rain in a single day, 3 months’ worth of rain, which marks an all-time record for the city in a century of weather monitoring. Of course, the Shishaldin subplinian eruptions were ongoing a month before this happened and the, probably stronger than normal, September 5 explosion happened 44 days earlier. A subtropical storm on 22 October left some 35 mm of rain in Madrid after making its way from the south coast of the Peninsula, where it will be remembered for obliterating a substantial fraction of the trees in Huelva city, due to hurricane-force wind gusts. Unstable weather, although not overly dramatic, persisted near-continuously until mid-November whilst the second half of the month was dry until November 30. The major rain events of September and October could fit with the effects of Shishaldin’s explosions, with a 1-month lag, since these eruptions happened mostly during August and September.
The last northern volcanic explosion came from Klyuchevskoy. A basaltic-andesite stratovolcano with a bit of gigantism and hyperactivity. It is the neighbor of Shiveluch and it’s no surprise it went up in the same year since this is the Central Kamchatka Depression, the valley of giants. The eruption style is not too different from Shishaldin, although the somewhat higher viscosity of basaltic-andesite drives larger explosive events. Volcanic activity climaxed towards the end of October after many days of strombolian explosions and lava flows going down the flanks on various sides of the cone. On October 31-November 1 lava fountains were 1 km high above the mighty summit of Klyuchevskoy, and ash reached 14 km above sea level. This explosive event created a sulfur dioxide cloud that looks to me to be somewhere in between Shishaldin and Shiveluch size.

Klyuchevskoy, parasitic cones in the foreground. From Wikimedia.
Somewhat later, across the planet, a third major rainfall event hit Madrid on November 30-December 1, and dropped some 60 mm of rain in the AEMET station that I’ve been quoting. Another 20 mm followed shortly on December 7. These two significant rainfall episodes came after the Klyuchevskoy eruption by 30 and 37 days respectively. Two is a coincidence, three is a pattern.
Past events
Initially, I was only going to talk about 2023. However, after finishing the rest of the article, the Canadian Fires of 2023 came to my mind as a possible alternative mechanism for driving the unusual weather at home, and while they do not fit the rain events as well as the eruptions I decided I needed to find a stronger correlation between eruptions and weather before publishing the article. Finding meteorological data for old years is no easy task but I tried. I chose one station near Madrid, the Madrid Airport, as a means of judging weather conditions, anything more than this would have taken too long since I do not know any open sources to download the data as an archive. I have looked in detail at the 2008-2023 years, writing down the total precipitation for each month in this period, and I have compared it to all plinian subplinian events in the Aleutians in that timeframe. I have also looked at 1999 and the Shishaldin eruption of that year, which was its last subplinian/paroxysmal event before the 2020 eruption. I haven’t looked into Kamchatka eruptions yet. Here is a list of the eruptions and the conclusions I’ve reached:
1999 Shishaldin eruption: There was a substantial eruption on 19 April this year, with a plume that rose 16 km. The effects should have kicked in around late May or early June. In Madrid Airport the month of May is slightly deficient in rain compared to May in the 2008-2023 years that I have looked up, while June is about the same as the June average of those years. As such it doesn’t look like there was any effect on Madrid. That said, there was an EF3 tornado on June 1 in northern Spain (the Navaleno tornado) that happened 43 days after the Shishaldin eruption and is among the few strongest tornadoes known in Spain for the past several decades.
2008 Kasatochi eruption: This small Aleutian island was the first that came to mind and the reason why I started looking for data this year, the eruption was an intense VEI 4 and a remarkably sulfur-rich one that was also preceded by another VEI 4 in the Aleutians from Okmok volcano. The Okmok eruption was on July 12, and the Kasatochi eruption on August 7. Wet conditions should have hit towards the end of August or the start of September. August had no rain but September was extremely wet as was October. In the 2008-2023 years for the Madrid Airport station, the wettest months of September and October are those of 2023, but the second wettest are those of 2008. September 2008 had 2.6 times as much rain as the average 2008-2023 September months, and October 2008 had 2.1 times as much. Wet conditions ensued on September 6. The strongest rain event, with 62 mm accumulated in two days, occurred 46 days after the Kasatochi eruption. November was dry and the effects must have already subsided by then.
2013 Pavlof eruption: This basaltic-andesite volcano had a few strong eruptions in the 2010s. An eruption on June 24 sent ash to 8.5 km. July was dry and August was average, so no obvious correlation is apparent.
2014 Pavlof eruption: On June 5 activity climaxed in an event that produced a large sulfur dioxide cloud that drifted over Siberia, some lighting accompanied the event but the height of the plume is unknown. The following July was the second rainiest of the 2008-2023 years in Madrid Airport. The culprit is a single precipitation episode on July 3. When searching the news, reports appear of a series of hailstorms that affected multiple provinces of Spain on July 2. Some of the storms were very damaging where up to half a meter of hail accumulated. On July 3, another hail storm described as being spectacular hit Madrid and surrounding areas. Since the unusual weather ensued 27 days after the Pavlof eruption I believe there may be a link. No rain fell in August.
2016 Pavlof eruption: Erupted on March 27 when ash reached 11 km. The following months of April and May were very wet in Madrid. This year had the rainiest April of the 2008-2023 years, while May nearly doubled the average amount of rain. The April rains hit as early as April 5, although being one of the rainiest months of the year this is not surprising, plus, the two largest rain episodes of April were during its last third. 40 days after the eruption there was the start of a 7-day episode of continuous rain that produced most of the accumulation of May and the largest “uninterrupted” rain event of the two months, a total of 62 mm. June was dry.
Two other strong events during this time were a November 15 2014 subplinian eruption of Pavlof, and two explosive eruptions of Shishaldin in January 2020. Neither of these two eruptions were followed by wet conditions. However, they happened close to the winter solstice, when there was little solar irradiance so far north. If there is not much sunlight to reflect into space due to the days being short and the sun’s angle low on the horizon then the extra cooling and any secondary effects on the atmosphere of the volcanic aerosols are expected to weaken.
Conclusion
In this article, I put together 6-7 cases of eruptions in the Aleutians and Kamchatka that preceded anomalously wet weather in Spain by about 30-40 days. The majority are VEI 3 subplinian eruptions from basaltic and basaltic-andesite stratovolcanoes, plus two andesite VEI 4 events (Kasatochi and Shiveluch). The rain was punctual in most cases, except for Kasatochi and Shiveluch where it persisted for almost two months. The volcanoes described here are more than 50 degrees north of the Equator, where the tropopause can be very low, whilst the volcanoes are tall Pavlof (2515 m), Shishaldin (2,857 m), or Klychevskoy (4,754 m). It’s easy for them to make stratospheric injections of volcanic gas, and any effect can be increased due to the aerosols staying within the northern hemisphere. I think that small transient cooling, induced by these eruptions north of the jet stream, may have triggered intrusions of mid-latitude cyclones towards more southern latitudes, affecting Spain and bringing rainy weather. Cooling of the atmosphere I think might enhance convection given how the ocean takes longer to cool, so that warm humid air over the oceans might become unstable. Temperature differences between air masses of higher and lower latitudes are associated with the jet stream speed, so another possible mechanism is that volcanic aerosols alter this balance and affect the jet stream. This speculation is just based on what has transpired in Spain and I would be very much interested to know if other places have also felt any possible effects from the eruptions of this year of the northern Ring of Fire. And of course, this is still speculative, no connection confirmed yet, but I think it looks promising.
Much attention has been given to catastrophic volcanic winters by giant explosive eruptions. However here I show evidence that smaller eruptions could be having significant effects on weather. And even beneficial effects. Spain started this year with a serious drought situation. Although the drought probably hasn’t fully subsided, the abundant rains of summer and autumn this year have brought relief to much of the country. The summer rains probably weakened this year’s fire season, which was thankfully relatively uneventful in the peninsula. Finding out about this is a fascinating surprise for me, yet another new way I will be looking at volcanoes from now on, and an elegant way for two of my passions to come together.
Links to data
I have relied on seasonal analysis of the AEMET to judge the rainfall anomalies over 2023, particularly on the May 20-July 7 rains:
https://www.aemet.es/es/serviciosclimaticos/vigilancia_clima/analisis_estacional
Copernicus Sentinel-5P sulfur dioxide maps have been helpful in understanding the eruptions of 2023:
The following database of Spanish supercells since 2011 already shows data for hail events during the year 2023 although doesn’t yet list the supercells:
https://www.arcgis.com/apps/webappviewer/index.html?id=fcae5371111e49c8817a642b4d2cec70
The Albarracin station data can be viewed in the following link, its location on a mountain range means it was more affected by the May 20-July 7 rains, which were often thunderstorms that developed over high areas:
https://x-y.es/aemet/est-8354X-albarracin-comarcal
I used this weather station to view the rainfall events from September to December in Madrid, since the El Retiro station seemed to have some problems during the time:
https://x-y.es/aemet/est-3125Y-san-sebastian-de-los-reyes
Madrid Airport station data:


I was asking for a reference. Scale that is. They heard me:
This may seem crazy but … that speck the arrow points at is the helicopter they have on site:
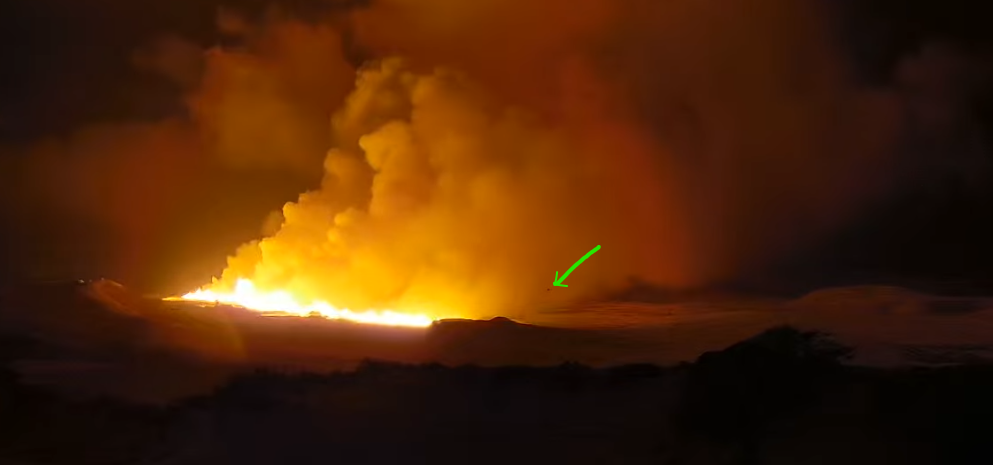
It’s like a scene out of Apocalypse Now!
Beautiful. Nice Christmas present for volcano nerds.
Earthquake in Tibet-
Picture from Iceland from jpost, Israel:
https://images.jpost.com/image/upload/q_auto/c_fill,g_faces:center,h_537,w_822/569150
Looks like a leave.
Immediate evacuation in order for Grindavik. Further, it appears that route 41 is being evacuated: “We would like to ask you to evacuate Reykjanesbraut immediately.” This is not a tourist eruption. I’d strongly advise against traveling there for this one.
How nicely they ask to GTFO IMMEDIATELY!! 😀
I suspect that they have so asked because the previous events have re-enforced the understanding on the part of ‘official Iceland’ that there is yet no vaccine for stupid.
You are most certainly true about the stupid part. The police found 2 people still in their restuarant and had apparently been sleeping there since they had been alowed to visit the town again. So they were told the danger and that they had to get out! They refused and only left when the police turned up with an arrest warrant! Definitey no cure for stupid!
It is certainly looking now that a goodly amount of lava is flowing south.
Nowhere near Grindavik at the moment, not even from the fissures that are furthest South.
I expect things will be all changed by the morning though. I want to stay up and watch but need sleep now.
Live from Helicopter https://www.visir.is/g/20232505218d/bein-utsending-ur-thyrlu-gaeslunnar-yfir-eldgosinu
quite magnificent and terrible size.
there is 5 segments to it. one large with tallest fountains and 4 slightly offset each from other.
at 4:44 of helicopter video
https://www.vedur.is/um-vi/frettir/jardskjalftahrina-nordan-vid-grindavik-hofst-i-nott
map
We have a location (not that there was much headscratching):
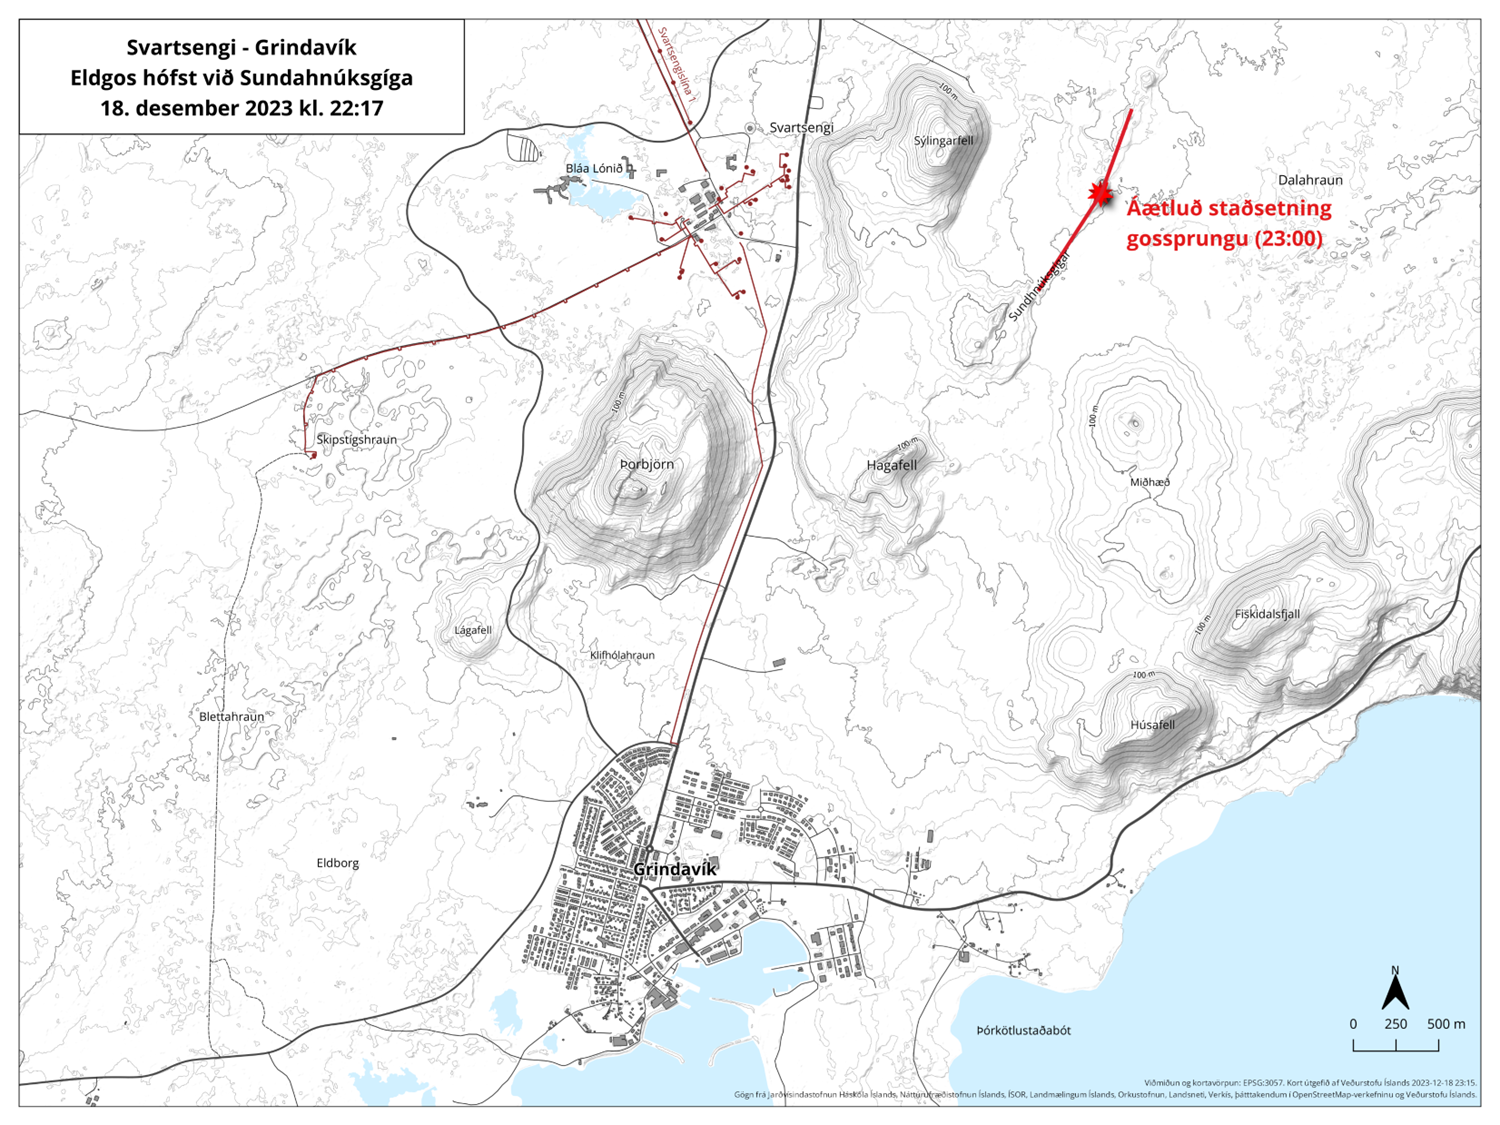
That would sort of place it at a location that would not impact Grindavik, nor the power plant.
“Big” earthquake NW Grindavik…. that is insane.
Hilarious, the eruption started the same day they opened up the Blue Lagoon again.
They opened yesterday and jinxed it.
Map… the fault has moving to the SW?
https://pbs.twimg.com/media/GBquS8PXoAAKa5c?format=jpg&name=large
https://twitter.com/spahn711/status/1736892300008038721
https://twitter.com/volcaholic1/status/1736891431090840021
From this location the lava could flow north. The rift is next to an old hraun on a pretty flat region. Could go north or south
Could it perhaps do both? That may be the best scenario, split the damage?
It has large output and is as liquid as Jesper likes lava. So it will spread fast. The map of https://icelandicvolcanos.is/?volcano=REY allows to study the physical geography and to look for possible lava flow paths.
The present fissure sits very well on an old spot of a fissure between Syglingarfell and Dalahraun. The Blue Lagoon is well protected by Syglingarfell. The biggest risk (from human perspective) is the area between Grindavik and Husafell. I’d assume that the lava flows will go there, if the eruption continues for several days. There it may bury some farms and settlements.
Finally I did the same mistake as IMO with Fagradalsfjall: When I predicted that the show is over, the show just began. I couldn’t believe that the magma/intrusion still is vital enough to erupt now.
The estimated length of the crack is about 2.8 km. For comparison, the length of the fissure in the eruption at Litla-Hrút was about 8-900 m.
https://www.vedur.is/um-vi/frettir/jardskjalftahrina-nordan-vid-grindavik-hofst-i-nott
Aerial video… impresive.
https://twitter.com/WxNB_/status/1736894199109136761
https://twitter.com/MetWatchUK/status/1736885436465688917
Wow! The erupting Fagradalsfjall #Volcano erupting can be seen from a passenger in Keflavík airport!
Other great pic
https://twitter.com/Vedurstofan/status/1736890800242372611
Looks like the leading edge of the propagating fissure is about 1km from Grindavik, unless its a trick of the perspective. Unless the peripheral ends of the vent shut down pretty sharpish, this could have a sad ending for the town.
now 3.5km lenght. according to Vedur it is growing in length quite rapidly.
It looks like it is more intense than the last Fagradalsfjall eruption to me and it is a few times longer. So at least a few hundred m^3/s?
One thing I’m wondering is if it permanently erupts or not. The sill being drained seemed to more or less cut off the supply route to the dike until it reached the exact same inflation again. So instead of ticking along at a reasonable 50m^3/s, is it possible it lasts a few hours until that 1000m^3/s supply from the sill is used up and then sort of stops. Until of course the sill reinflates, reopens the dike connection, and it erupts hundreds of m^3/s, and so on again and again until the deep supply slows.
I’d expect that the rate is higher, but the whole eruption time is shorter than the first Fagradalfjall eruption 2021. Maybe like Fagradalsfjall 2022 and 2023. Some weeks, but not months. But spectacular and possibly ocean entry.
The estimated lava flow in the volcanic eruption is around 100 to 200 cubic meters per second, which is many times more than in previous eruptions on the Reykjanes Peninsula in recent years.
Impressed that they nailed the location of the eruption so well. It’s pretty darn close to the middle of the “likely” area of the prediction map.
Finnbogason is setting up his gear and will dronestream in a few minutes…
Thanks for the link.
Prof. Shawn Willsey is also doing live commentary here:
https://www.youtube.com/watch?v=iqF5YQRdhtw
Question Carl:
Do you think the last Mag 4 quake just north of Grindavik is indicative of the fissure propagating southwards?
I think the dike has reach the Fagafell…
For the moment I do not think it will propagate that far south.
But, a 3km fissure that is still propagating is kind of throwing up the question if the entire dyke if ripping open.
Lava is going west to Reykjanesbraut.
Yeah, thanks. Good view of that on the drone stream you posted above.
I was more thinking about the second mag 4 after the eruption started (about half a hour ago now). Could this indicate that there is still pressure building up south of the current eruption site and we could see an extension to the South?
Monday
18.12.2023 23:25:11 63.863 -22.403 4.3 km 4.1 99.0 3.3 km NE of Grindavík
After I typed the above but before posting: Someone stated on a local radio news channel that Grindavik is safe for now, and that a new fissure just opened further to the North.
I think the first M4 indicate that it was extremely close to erupt there, but that in the end it was just a tad easier to break out at the eruption site.
The second one is probably due to resettling setting in.
It looks very fluid the lava, am I right?
Very fluid, the heli took some close up shots, it’s flowing like sirup.
3.5 km fissure, 100-200 square meters of flow, according to news.
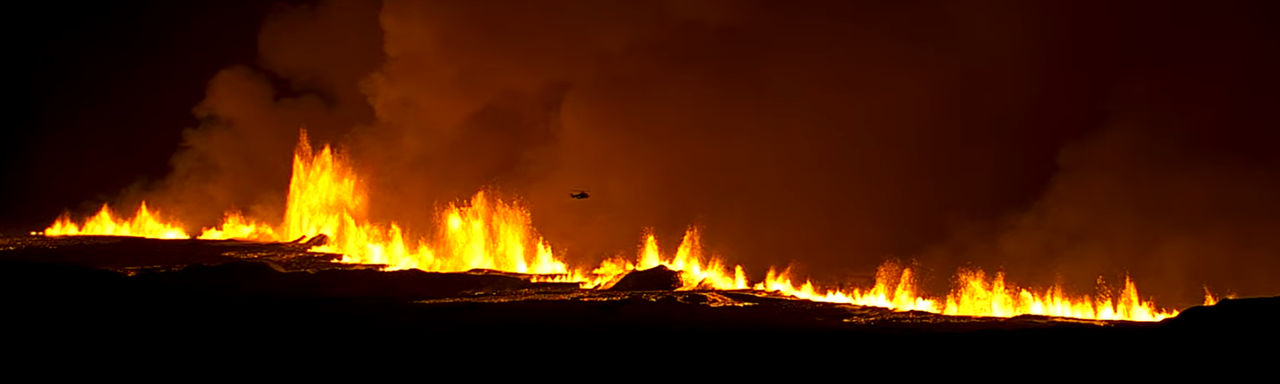
A great Curtain of Fires in all its beauty and scare.
This eruption is longer in length than the Holuhraun fissure, isn’t it?
Yup, but far from the flow rate.
Holu was 1.8km but ripped continues 700 meter fountains in the first few weeks.
Since so much has opened up I think this will be a short one unless the fissure shortens quickly.
I for one am hoping this will be a short eruption. Much as I love watching volcanoes this one is a bit scary. In view of how quickly the dyke stopped then perhaps this will be the same but I suppose it will depend on if this time the magma exit stays open.
Carl none of the Holuhraun fountains where 700 meters tall! ; ) I think the initial fountains where just 50 meters or so, and when Baugur cones formed it got up to around 150 meters tall at max, it vent no higher than that. 700 meters high fountains woud have looked almost etnean with lots of more tephra
Max was 400 meters I believe, but usually closer to 150-200.
posting the link to one of the multiview websites…
https://www.livefromiceland.is/volcano-webcams/
Kristín Jónsdóttir, head of natural hazards at the Icelandic Meteorological Office, says the fissure is getting longer and the latest information indicates that the fissure is up to 4 kilometers long.
The measuring instruments of the meteorological office are very close to the crack and in danger. Based on the latest information, part of the fissure lies south of the watershed, and then lava can flow to Grindavík.
Video by RUV in Reykjanesbraut (North Coast of the peninusla): https://www.ruv.is/frettir/innlent/2023-12-18-gossprungan-ordin-um-35-kilometrar-og-margfalt-hraunflaedi-399923
Historical lava flows didn’t reach the North Coast. The slopes are very even towards the north, so lava will flow relatively slowly. But the road between Grindavik and Vogar will likely soon be interrupted by lava.
What are the chances that the lava flow rate will increase later? The first time in years I’m actually invested in this volcano.
Sismic activity continue moving to Grindavík, the dike has filling?
https://twitter.com/volcaholic1/status/1736910532421013914
Holy (rude words). I just caught up on this rift unzipping. What a spectacular – awesome sight! Now vog has filled the cameras. How is Grindavik?
Webcam when the eruption started.
Quite a sight:
https://x.com/bjornmaro/status/1736878238675128764?s=46&t=D_FWQuYUV1RON-_9DEzTrQ
Seismicity seems to be stopping or slowing down. Does this mean the eruption will soon stop as well?
Not sure. Wouldn’t the reduction in seismicity be an indication of the sluices being wide open?
I hadn’t thought of it that way! You could very well be right.
Is this for real? When…why…what…!?
RÚV now has a live blog up.
Eruption on Reykjanes Peninsula (19 Dec)
The photos from the lady out the window of the plane as they were coming into Keflavík Airport are awesome. Not often can you be on a commercial flight and see something like that.
In that clip that catches the beginning of the eruption, after a sharp remote camera operator zooms in and the camera adjusts, you can see how fluid this lava is. Flows looser than water. Never seen lava with such light viscosity. Pretty sure Carl called that weeks ago.
It is certainly looking now that a goodly amount of lava is flowing south.
Nowhere near Grindavik at the moment, not even from the fissures that are furthest South.
I expect things will be all changed by the morning though. I want to stay up and watch but need sleep now.
I just looked at the earthquakes. They’re extending SW to NE across the almost the entire peninsula. Much farther North than they were. I know that’s the preferred direction because there’s plenty of room up there, but these EQs are pretty close to the Northern highway (41).
Naw, cancel that. It’s tough to get a big picture because of the sheer number of quake circles covering the map. Center mass of the quakes are still a lot closer to Grindavik than Vogar. There’s still plenty of room to the North.
Proves that Magma / Lava moves on Nature time and place. NOT Human time and place.
Sylingarell cam has a commanding view and is panning the length of the eruption.
https://www.youtube.com/live/Bqudj0x0POA?si=LmdmKNSlFIgScPME
Jeffrey thanks for that! Great cam , it goes on forever!
It’s really overwhelming! Just watched a complete pan, South to North, and can’t get over how huge this thing is compared to recent eruptions on the peninsula.
About mid-pan I just saw what appeared to be three humans with headlamps walking out amidst the quickly disappearing snow on the West side of the fountains. I hope no one believes they can outrun THAT lava!
I guess somebody needs to get a lava sample. There’s only one way to do that, I think.
I’ve been watching for a half hour now in silence just staggered by the sheer size. Incredible! Thank you for this share! Shared it with a bunch of friends and family already.
Going by the landmarks, the length is 8km easy.
Wow. Mauna Loa scale for certain, well, as expected.
You should post your piece here once again in a few weeks as it is drowned by the Reykjanes eruption.
on other icelandic commentary, I got into a discussion elsewhere, and the idea of the EVZ’s rift cycle being near peak came up, and now I, for the life of me, can’t find the paper that described this. Can anyone help me out here?
Well, my prediction for the original dike was it was a stalled dike/failed eruption, for the rest of this year at least. The volcano seems to disagree.
I’m very curious as to what the lava analysis will say, especially regarding whether or not this shares a deep source with the Fagra eruptions.
CJ
Just yesterday I wrote twice that I don’t expect an eruption there before 2025 …
The dike needed more time to erupt than Fagradalsfjall’s intrusions. Maybe because it was a different type?
But it looks like a hard time for Reykjanes Peninsula is coming. This eruption now. A Fagradalsfjall eruption in June 2024 with possible northern lava flow. Sooner or later the flows will damage more infrastructure.
I wasn’t expecting this so soon! I thought there would be some noteworthy seismic activity before the rift snapped, seems not.
Some analysis of the dike. The intrusion seems to have started around 20:48, earthquakes happen simultaneously north and south of an aseismic area below the largest segment of the Sundhnukur fissure swarm. This aseismic area is where microearthquakes raged for several hours before the dike of November and I suspect is the Sundhnukur feeder area. The dike heads north, at 22:30 the dike stalls 4 km NNE of the starting point. It’s already erupting, erupts at 22:17. Once the dike stops growing north it seems to start growing south and advances rapidly over the next hour and a half producing abundant earthquakes in the direction of Grindavik. By about 00:00 the dike stalls about 3 km SSW of the starting point, having achieved a total length of 7 km, seismicity dies out quickly afterward. If the southernmost end of the dike erupts, it will flow into Grindavik.
Circles are earthquakes from IMO, blue is older, orange is younger they trace the dike intrusion growth:
The precursory seismicity (before 20:48), seems to have consisted of earthquakes along the November dike which had been going since, November 10 it was?. So the dike must have still been inflating when it ruptured yesterday and headed north in the direction least affected by the November intrusion. As far I can tell, there was no change in seismicity, but wasn’t paying too much attention either. The rift was filled so it overflowed abundantly. Just over a month between two major dike events, Krafla didn’t manage that, the rates of magma influx must be enormous.
The November dike was around 80-100 million m3, so to get that fully recovered in 5 weeks is a supply rate of about 2.5 million m3/day, or a bit less than 30 m3/s. So it is about 10x higher than kilauea, and probably more than the whole of the rest of Iceland combined otherwise.
The eruption has already slowed down quite a lot, as expected. If the last intrusion is comparable then most if it will be quiet by a day past, a few vents will probably stay open vigorously for the next week or so, maybe dying off around New Years. But if the supply stays high then all of this will repeat again in February. And none of this appears to necessarily be related to Fagradalsfjall, so an eruption there is also likely next year. Really an extraordinary situation.
Something tells me that maybe the data we do have on the last cycle of eruptions on Reykjanes, is a lot more incomplete than we may have been aware of before…
Yes, it’s quite remarkable, particularly considering this is probably the 5th dike intrusion in that area in the second half of 2023. I’m fairly confident that there have been two dike intrusions out in the Reykjanes Ridge, the Eldey intrusion of July, and an intrusion in August. I think I have a rough idea of what’s going on, unfortunately, it’s related to a bunch of other stuff that’s gonna have to wait because it will require a whole book to explain.
They told in the weeks before that inflation of the ground was slowing down too. But coud be just as strong when new influx resumes after this eruption dies down.
Yes very impressive, the fastest Iceland lava eruption since Hekla in 2000. This is much faster than 2021, 2022 and the summer eruption. Was a fast intrusion so a fire curtain. I guess its more than 500 m3 to 1000 m3 per second at least at start and have weakned alot since last night: hopes grindavik gets spared. This was a very fast dyke too, resulting in a Mauna Loa curtain rather than something smaller ane Piton like previous eruptions. Clearly overpressuee simo should not be verty long lived. The recent halema’uma’u eruptions are probaly just as fast, just drowned in pooled lava
Imagine what an inferno Ögmundahraun must have been, because this is still quite small compared to that eruption.. and souch an event coud be on horizon later in this rift cycle which woud not be good for Grindavik
I think the signal is being misread when making the assumption the supply is slowing when the land ruse slows. The rock flexes away but also pushes against the magma, the pressure directly influences the supply. A recently deflated magma system will have low pressure so magma will rush into it, a magma chamber filled to the limit will have basically 0 supply until it breaks because magma is a liquid and nearly incompressible.
The slowing trend in the GPS I think was really showing us the limit was near, eventually the magma supply will actually slow for real but that will probably be a more gradual change than something so fast it shows up in a day or two.
I just loves how the first minutes of the eruption looks like a spray of liquid iron! it says something how fluid these MORB lavas are, the viscosity is incredibely low
On the very slowly panning Sýlingafell cam, inbetween the larger conflagrations, I found steam vents that are shooting vapor way above where lava is being tossed. Amazing. The resolution right now might allow a zoom and screenshot so I’m right back at it. I don’t think those vents will continue for long. Any water in that vicinity is getting the heck out of there as quickly as it can.
Aaaand just like that, the weather drops in. It’s Iceland. Screen is a uniform burnt orange.
Never saw them again. These weren’t lens or atmospheric artifacts. Sprays of vapor just as clear as geysers on Enceladus lit by the Sun. Sometimes they did emit tiny glowing specks of something, like literally shot from a cannon.
I was just looking at the earthquakes last night thinking that this will erupt soon, and it did so two hours later. Pure luck guessing though…
https://www.youtube.com/watch?v=LIXRt0lJaBc
livestream one hour.
Looks a bit like Hawai’i
This may be useful
https://www.volcanocafe.org/wp-content/uploads/2023/12/viewing-angles.jpeg
Thank-you Albert! The even plain there allows the lava to stay relatively stable in the area. There doesn’t appear a risk of fast running lava flows to any location now.
This is eruption is reminding me of Wolf (359) Volcano on Galapagos Island.
Brief lightly phreatic opening sequence, long fissure ripping open, medium flowrate, and then a rapid decline.
I likes the first minutes, it looks like liquid iron, that says something how low the viscosity is for these MORB lavas, its also fairly chemicaly similar to Wolf, just that reykjanes lavas are much less potassic. These years since 2021 are the first since Krafla and Holuhraun that we have really fluid lavas in Iceland, since it erupts more or less directly from the mantle, unlike at the central volcanoes that erupt more evolved viscous basalt
The first moments it looked like a bomb explosion. Then, when the camera gets used to the new light source, it catches the rapid onset of the tall lava fountain. It it from the beginning much more intense than Fagradalsfjall.
Good visible conditions during the long Icelandic Christmas Nights: https://www.youtube.com/watch?v=VIs83vmfZCk
If we draw a line from Geldingadalir (Fagra I) to the present spot, they are at the same distance to the southern Coast. The line of both represents well the MAR line through the Reykjanes peninsula.
What are volcanic eruptions without photos and videos? RUV has published some photos:
https://dankxip1iu8u9.cloudfront.net/eyJidWNrZXQiOiAicnV2LXByb2QtcnV2aXMtcHVibGljIiwgImtleSI6ICJtZWRpYS9wdWJsaWMvb3JpZ2luYWxfaW1hZ2VzL0dvc191cl9UaHlybHUucG5nIiwgImVkaXRzIjogeyJyZXNpemUiOiB7IndpZHRoIjogIjEyMDAiLCAiZml0IjogImluc2lkZSIsICJoZWlnaHQiOiAiOTAwIn19fQ==
The lava has until now reached 40% of the distance to Grindavikavegur. If the eruption rate continues to decrease, the road will likely be spared from lava.
The opening sequence was spectacular and was shown really well on the mbl live stream. From the first high fountain to new fissures popping up like mushrooms from the ground. I do hope the lava stays out of Grindavik.
And right now the opening phase is falling out of the 12h cache of the live stream. I hope it’s recorded and preserved somewhere.
What’s notable:
Volcanologist #1: “Worst case scenario. Bad news.”
Volcanologist #2: “Best place! Good news.”
Is that just the media trying to side and finding someone who supports their good news / bad news oriented reporting? Or are half of the volanologist simply clueless?
Yes on both accounts I am afraid.
Media want horrorstories since it sells copies, and half of the volcanologists are either clueless or unable to read a topographic map.
These comments came when the precise location was not yet known. A small shift can dramatically change the lava direction. The sheer length of the rift makes predictions also much more difficult.
@Albert, this was my interpretation of the disparate comments, as well. My understanding is that if the fissure had opened (or extended) just a bit farther south, then Grindavik would have been in much greater danger, and in the very beginning it was not immediately clear that this wasn’t in fact the case.
New post is up!
https://www.volcanocafe.org/late-night-icelandic-fireworks/
This has been spectacular. And surprising to many. Very pleased to see Grindavik is in the clear. For now at least. Not the Christmas they hoped for there however.
As always this is the source to come to for getting updated when something like this starts. Thank you to everyone contributing here. And especially to the authors for all shared knowledge.
On this event; always looking for patterns I can not help but noticing several incidents of weak (mostly <2) EQ-swarms over the last weeks. Magma-pulses reaching the upper feed-system? There is no central magma chamber, so some other process drives magma to beeing fed in and break the surface at some very long historical timeintervals. How? Why exactly when it does? Seeing the last little swarm over the last few days I thought this could be the trigger yesterday.
Engaged with some carpentry yesterday I was still very surprised when I saw the eruption has began. As a re-run that is. 🙂
Maybe we need to watch out for those weak EQ-swarms in this scenario? Because is not "all normal" anymore in Reykjanes. The final swarm only gave one to two hours leading up to the spectacular start, so in a future episode, having more precursors must be better. Maybe sometime in the future…?
*** "In season 32, episode 18 of Reykjanes the plot has thickened…." ***
Here in western Norway there is a forecast for SO2 from 20.12.23 @ 4 am. No danger, but might be enough to smell it tomorrow morning they say (MET). Map here;
https://www.vg.no/nyheter/utenriks/i/4oPWpG/vulkanutbruddet-paa-island?pinnedEntry=37757&utm_source=vgfront&utm_content=hovedlopet_row3_pos1&utm_medium=dre-658161647967a56fd405b800
The monitoring web page for gases in Iceland has showed good conditions in Grindavik since last night, so the cloud clearly moves SE. Our way. Not concerned. For now. Link;
https://loftgaedi.is/?zoomLevel=10&lat=63.831095061983795&lng=-22.22017875683594