
People need mementoes. They are small things (normally) with little intrinsic value (often), but which carries a memory which is far more valuable to the owner than the item is in itself. It can be a bit of jewelry, a cup, or a chair, or even a pebble. Or it can be one of many other things. Somewhere in a museum is Neil Armstrong’s space suit. It is utterly useless on Earth, but it brings back memories of a time half a century ago, when we could still go places. Now all we do is a quick billionaire dip in the sea of space. The will to explore remains in our mementoes. Some time ago I came across my old playpen. I have no memories of being in it (of course) but it brought back memories of being told (in great detail) how I escaped from it before I could even walk. We keep the first shoes of our children, not because they will ever be used again but for the precious memories they bring back. A smell can do the same thing. It is the way our minds work: they need something to hold on to, in order to guide us back to our past. And who knows: memories have power, and maybe one day that space suit will incite our children to restart the journey we abandoned.
Volcanoes also leave us with mementoes. They can be the real deal, the calderas formed by the explosions or the thick layer of ignimbrite which deeply buried an even more distant past. They can also be more fleeting and volatile, such as the smell of smoke and sulphur in the air. The ash on the ground will continue to carry that smell for centuries. Or longer: one of the things we learned on the Moon is that moon dust (a bit like ancient abrasive snow) smells like burnt gun powder. (One of the astronauts had an allergic reaction to it – maybe that is why we couldn’t go back.) We do not know what produces the smell. One suggestion is that it is caused by a reaction with oxygen in the astronaut’s air. The moon dust brought back to Earth does not smell: the smell may be old, but it did not last.
This is also true for volcanoes: once exposed, the smell of old eruptions does not last. Volatile mementoes should be stored safely. And so they have, buried in ancient icecaps where they were deposited on a glacier and covered by the snows of later years. In cold storage, they will last as long as the ice they are in. Dig into the glacier and you can find the layer with the dirt and the smell of an old eruption. These are the Earth’s mementoes.
Ice drill
Ice has a long memory. At least, if it is given a chance. In temperate places ice is just an annual, here today, gone tomorrow, and leaving us no trace or past. It wasn’t always like that. During the ice age, not that long ago, the winter snows would fail to melt in summer. Layers and layers of ice and snow build up to enormous glaciers, huge dumps of frozen water. So much ice was stored that water levels in the oceans fell by 100 meters. And in some places the ice age never ended. The icecaps of Europe and North America are gone, leaving us only their scars on the landscape, the scraped-down bed rock covered in deep scratches. But in Greenland and Antarctica the ice-age icecaps are still there, unmelted and forbidding. The icecap of Antarctica goes back hundreds of thousands of years. Greenland’s ice isn’t quite as old but it too carries a long memory. Even the ash of Toba is still here.
But how do you get these ancient memories out? That is an adventure. You need to find a place where the ice has been undisturbed since before the last ice age. That often means picking the highest place on the glacier, and this can be 3 kilometers or more above sea level. The ice should have stayed in place, and not flowed towards the distant sea: we are looking for the high centre of the icecap, not the more accessible area near the coast. Just getting there is already an experience. The scientists come here for summer, and work in group isolation as if in a remote oil camp. They live in a small community where it can feel at times that the outside world does not exist.
Now the ice is cored: a drill is used to remove a long core from the glacier. The drill itself is also similar to an oil drill. It brings up an ice core which can be kilometers long. Of course, technology never fails to fail under such extreme conditions – the most important people in the camp, after the cook, are the engineers who keep it all running. The engineers know their instruments inside out and know how to keep things working in ways they never learned at school. The scientists can only look up in admiration at these magicians.
The core is brought up in pieces of manageable size. Initial analysis may be done on site, but eventually it all needs to be transported to civilization. The transport has to be fast, as any melt would be a disaster. C130 Hercules planes may be used for this as they can land where nothing else can. I don’t know how they refrigerate the ice during the journey – perhaps they just keep the windows open while flying! After landing, refrigerated trucks are waiting to speed the cores to the laboratory, and specifically to the ice-cold storage space below the laboratory.
If you are interested to see what it is like to live on the ice in a scientific research station, please look at this video of
Ice camp viewing.
After a few months, the summer camp is abandoned as the winter approaches, and the scientists return to the laboratory where the harvest of ice is waiting. Now the laborious laboratory work begins: counting the annual layers, creating a table of what depth in the core corresponds to what age, and after that discovering what is hiding in the ice – often involving melting a bit of it and see what comes out. Science can be a slog – but an exciting slog like no other.
https://vimeo.com/6971081
It is important to locate the very best place for the drilling. Once drilling is in progress, you can’t change your mind and decide that 15 km northwest would be so much better. It would be nice to have some existing infrastructure, so first you look whether any existing bases are usable. They may not be. There are some requirements. The location should be deep-frozen year-round: snow that falls should not melt during the summer. So it should be an exceptionally cold location. This favours very high places: temperature drops with altitude, and at 3 km altitude this can make 30C difference. That helps.
In fact, this is the main reason why the huge glaciers of Antarctica and Greenland survived the end of the ice age. They are so thick that the temperatures at the top are much lower than they were when the ice first started growing. Height is a saviour for the ice. But it is also a danger, since when melting finally begins it goes very fast. After all, this mountain is nothing but ice, and ice is prone to change liquid. It works like a negative volcano, forming water rather than lava. As the ice melts, the surface drops in altitude and the temperature rises – so the melt goes faster. A glacier takes ten thousand years or more to grow, but can disappear in a tenth of that time. Just compare Greenland to Sweden: during the ice age they were very similar, but they are so no longer. One is a paradise for the ice hunters, and the other is full of Swedes. Greenland is a scientific treasure because it kept its ice age memories safely in the freezer, something Sweden failed to do – or managed to avoid, depending on your preference.
The second requirement is for enough snowfall each year to give a measurable layer of ice. It takes decades for the buried snow to become ice, and in that time it compresses to perhaps as little as 10% of its snow depth. A meter of snow can give 10 cm of ice. This is enough to give an identifiable and measurable layer. Icecaps tend to be deserts: the air is too cold to contain much moisture. The Western Antarctica WAIS core is an example of relatively fast growth: it averages to about 5 cm of ice per annual layer.
The third requirement is for a thick enough (and stationary) icecap, so that it gives a record that is long enough for the purpose. At 5 cm thick layers, a 3-km ice core (as in the WAIS ice core) provides a 60,000 year record. But the WAIS location is only 1700 meters high. How does that work? Ice comes to the rescue: the weight of the ice has depressed the crust so much that the bottom of the ice is now far below sea level. This is typical: the Hudson Bay is under water because this is where the Canadian icecap was centred. It is still trying to recover from that, and is slowly rising. Every year the Hudson Bay is a little smaller. In general, the thicker the annual layer, the shorter the record. The oldest ice cores (as the 800,000 year one from the centre of Antarctica) are from places where the annual snowfall is very limited. There is a trade-off: it can make the annual layers indistinguishable, giving both lower time resolution and lower accuracy of the dates. You can either have detail, or you can have a very long record. Our icecaps are not thick enough to give both.
Science-on-the-rocks
What science can we do with all that effort? There are many different ice cores in existence, and they were retrieved for different purposes. For instance, the Greenland TUNU core was retrieved specifically to study atmospheric pollution from Europe over the past 2 millennia. That is a recent-time project which required good resolution but not a long time line. Other projects measure past CO2 levels, using air bubbles captured by the ice. These require extremely long lasting records. The longest ice core record goes back almost a million years. Only in Eastern Antarctica has the icecap has been stable for that long. Imagine breathing in air from a million years ago! When that air was captured in the ice, humanity was still a distant dream. The Greenland ice, on the other hand, goes back no more than 100,000 years: its icecap largely formed during the most recent ice age and there is little point looking for older ice. Over those 800,000 years, CO2 levels in the atmosphere never exceeded 300 pm. We are now above 400 ppm, in uncharted territory. For an account of the quest for ancient air, see https://cdiac.ess-dive.lbl.gov/images/air_bubbles_historical.jpg.
Some science-on-ice projects look for past temperatures. That is done using oxygen. There are two common isotopes of oxygen: O-16 (the usual one) and O-18 (heavy oxygen). Both are equally healthy, by the way. Your body does not distinguish between those, so don’t be tempted to buy ‘heavy oxygen’ for any advertised health purposes. (Luckily no one seems to have caught on to this one yet, so I hope I haven’t given health scammers an idea!) They are of course both present in water, which after all is H2O. Now water with O-18 needs slightly more energy to evaporate. As temperatures drop, this heavy oxygens tends to stay behind in the oceans and slightly less of it enters the atmosphere. Snow forms from atmospheric water, and so it contains the depressed level of O-18. The amount of O-18 can be measured in the ice core. When you see a past temperature record, this is how it was obtained. (At the same time the oceans become enriched in O-18, and this shows up in fossil marine shells. So in the ice, lower temperatures means less O-18, but in marine records it means more O-18. See for a description of the complexities https://earthobservatory.nasa.gov/features/Paleoclimatology_OxygenBalance. Who said that science was easy?) The O-18 and CO2 are measured in the same ice, so it gives an excellent comparison. And CO2 and temperatures have tracked each other very well over the past million years.
Volcanic pollution in the ice is another project. It is identified in several ways: looking for volcanic ash (pretty rare), measuring sulphur, or measuring the conductivity of the ice (a measure of acidity). The latter has the advantage that the ice does not need to be melted. An ash particle can help to identify the guilty volcano, as these can act as a finger print. Sulphate, in contrast, only tells you that something erupted somewhere. Now the scientist needs to turn detective. But often there is insufficient data for the Miss Marple of science to solve the case of the mystery volcano.
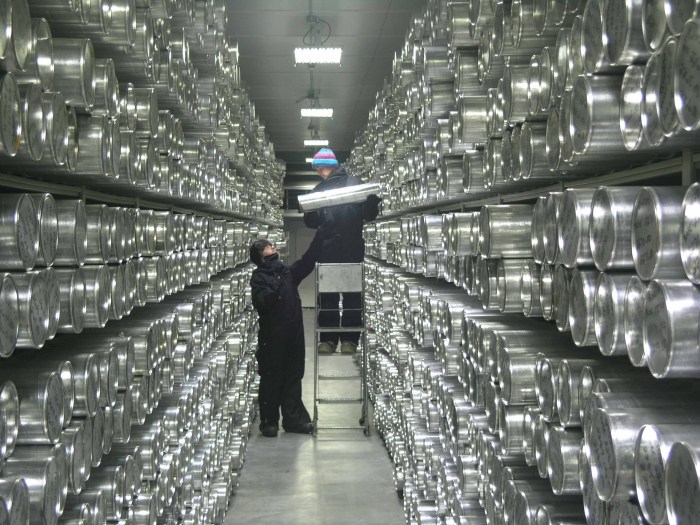
The Earth’s memory bank. An ice core at the National Ice Core Laboratory, NICL, in Lakewood, Colorado, USA. (NICL photo)
Volcanic ice cores have been retrieved from both Greenland and Antarctica. They don’t always show the same eruptions. Eruptions in the tropics can spread their sulphate to both hemispheres. But eruptions at higher latitudes will find their emissions confined to their own hemisphere. Stratospheric sulphate does not easily penetrate the tropics. This is partly because of the dominant winds in the stratosphere, and partly because the lower edge of the stratosphere is much higher in the tropics (20 km) than at higher latitudes (10-7 km): the stratospheric dust runs into the wall of the troposphere as it spreads towards the tropics. Tropical volcanoes have the advantage. Once they penetrate the stratosphere, the sulphate will easily spread in both directions and within months can reach the poles. Therefore, an Indonesian volcano may show up in ice cores at both poles, but an eruption in New Zealand or Alaska may be seen at Antarctica or at Greenland, but not both. This pattern is one of the clues that Miss scientist-detective Marple will be looking for. The stratospheric sulphate spreads a haze across the sky and dims the sun. In the case of a large eruption, it may lower the temperatures. But only tropical volcanoes will do this in both hemispheres. New Zealand’s volcanoes will have little effect on America’s weather, but can make a real impact on Australia.
Viking volcanics
In an earlier post we discussed the demise of the Greenland Vikings, and saw that for both of their settlements, there is a finger of suspicion pointing at a volcano. But the finger is not pointing at any specific volcano. The evidence for volcanic actors comes from the ice and from circumstantial evidence from elsewhere in the world which suggest a volcanic ‘winter’. (Actually, volcanoes affect the summer more than the winter, but ‘volcanic winter’ sounds more threatening.) The Western Settlement suddenly disappeared during or shortly after the unidentified eruption which caused the weather that let the rats, the fleas and the plague spread across Europe. The date of the demise of the Eastern Settlement is less well determined and it seems to have suffered a slow decline – but it ended in the same general period as the volcanic upheaval in the mid 15th century.
This is about the volcanic eruptions of the Viking era. It is not actually about the Vikings, and I doubt that the Greenland Vikings ever went up the icecap other than to make some blueberry-juice-on-the-rocks. But it gives me a convenient time scale to use. I will look at the volcanic ice core record for the Viking period 900-1500, a time when much of the volcanic world was still undocumented and volcanoes could erupt in secret. Iceland will play a prominent role, both because its volcanoes are over-represented in the ice, and because we know a bit more about which volcano erupted when. But the rest of the world will get a cameo role.

Sailing the seven sulphatic seas
Let’s first look at the Greenland ice cores. There are several available, but the one most sensitive to volcanic eruptions is NEEM. NEEM stands for North Greenland Eemian Ice Drilling: it aimed at getting a particular long core for past-climate research. The ice core extraction was completed in 2012.
I am using the sulphur tables published by Sigl et al in 2015 (https://www.nature.com/articles/nature14565) for the NEEM core from northern Greenland, and the WDC (Wais Ice Divide Core) from the highest point on the icecap of Western Antarctica. As mentioned, WDC only goes back 60,000 years (this area was ice free between the ice ages) but it has high time resolution. This time resolution is essential when looking for volcanic signals. In order to compare different ice cores for all but the very strongest eruptions, the layers need to be dated to better than a few years accuracy.
The plot below shows the sulphur content of each annual layer in the NEEM core, in red. In most years it is very low, but on occasion there is a significant peak: a volcano went off, spreading its considerable load of sulphate to the pole.

The blue line shows the WDC core from Antarctica. Clearly, some peaks are mirrored between red and blue, and some are not. The scientist-detective can now begin her work.
Location, location, location
There are two ways that sulphate can reach the ice core. The first one is if a volcano erupts in the vicinity, so that the ice core sees local pollution, carried directly by the ever-changing wind. The second way is if the sulphate reaches the stratosphere, where it stays up long enough (months to years) to spread to the polar regions. Here, also, location is important. A sulphate spike seen in both hemispheres is likely to have originated from a tropical volcano. One seen only in the north or south will have come from that hemisphere.
Let’s first look at the tropical eruptions. To identify them, I took both the NEEM and WDC cores. I converted both to a common grid (same time steps, by interpolating between data points) and subtracted the mean background so that both averaged around zero with positive peaks where a volcano jumped in. I now set all data points less than 5 ppb to zero. This gets rid of most of the variable background but leaves the volcanic signals in place. Finally, I multiplied the two curves with each other. Any peak seen in only one core will be multiplied by a zero in the other core, and disappear. Only peaks seen in both cores will give anything else then zero. The result is shown in the next plot.

The procedure left me with 10 tropical eruptions. However, one of these appears to be problematic. An eruption is seen in 1230 in Antarctica and in 1231/32 in Greenland. The curves overlap just enough that the overlap shows up as a tropical eruption. This is the only eruption which shows such an offset. It is possible that these are in fact two different eruptions, a southerly one in 1230 and a northerly one in 1231/32. Another possibility is that one of the two has a small error in the layer counting, and that in fact the two eruption signals coincide, and that the eruption was twice as large as it appears. An error of one or two years is not impossible.
To check, I went back to the climate records. No peculiar weather was noted around 1230. (All weather is peculiar, but that of 1230 was no more peculiar than normal.) 1232 was very dry and warm summer. But 1233 was a strange year. It started in March in England with thunder and heavy rain. The wetness lasted the entire summer, with so much rain that fish were swimming among the harvest. All of Western Europe was affected, with flooding in Paris, Cologne and Utrecht. It was called a year of misery. The winter of 1234 was extreme: even the Laguna in Venice froze solid, for the only time in 250 years. In the summer of 1234 people complained about an ‘unhealthy atmosphere’ and ‘unnatural weather’ (Roger of Wendover). Only in 1235 did the weather improve. Was this a volcanic winter? It has the hallmarks of one, and this would agree with a significant eruption around 1232. Perhaps the 1230 and 1232 eruption were in fact the same, large enough to affect the weather.
A recent paper attempted to differentiate between stratospheric and tropospheric eruptions through their isotopic content: Gautier et al 2019. Sulphur comes in two isotopes: a ‘light’ one (S-33) and a ‘heavy’ one (S-34). As in oxygen, the heavier isotope is more reluctant to travel. And the stratosphere is a long way. The result is that stratospheric sulphate has a bit more S-33 than usual. Using this, they find that the 1230 sulphate in the Antarctic ice was stratospheric. That makes a tropical eruption more likely. A volcanic winter (possibly seen in Europe) also fits better with a stratospheric eruption. It seems plausible that the two stratospheric eruptions were the same one: there was indeed a significant tropical eruption, around 1232.
The other 9 tropical eruptions occurred in 1110, 1172, (1192), 1258/59, 1287, 1331, 1345, 1453, 1459. The dates are accurate to 1-2 years. It is possible for a layer to be lost in counting, or to be double counted, and comparison with other information on eruption dates is necessary. The 1110 and 1453 eruptions are considerably stronger in the Greenland core and these may be a bit north of the equator. The 1459/60 eruptions is much stronger in the Antarctica core and may have been in the southernmost tropics. The 1192 eruption is strong in Greenland but is barely above our lower limit in Antarctica: it needs confirmation.
The number of strong tropical eruptions amount to about once per century, with a few more weaker eruptions. Strong eruptions probably should be interpreted as VEI 6 and (rarely) 7.
We can also extract the southern eruptions. I have done this by keeping only the peaks in the Antarctic plots which are well above the background, and using the plot of tropical eruptions to mask out the tropical events. This leaves me with 6 clear eruptions and 2 uncertain ones.

The southern eruptions are in 918, 961, 1040, (1230), 1241, 1270, 1277, (1286). The last one is uncertain as it is also classified as a tropical eruption. It is seen in Antarctica one year before Greenland but it strongly overlaps and is most likely (but not certainly) the same eruption. The 1230 eruption was discussed above: there is a possibility that this also is a single tropical eruption.
The southerly eruptions therefore occur at a similar frequency to tropical eruptions, about once per century. Interestingly, they were mostly in the 13th century, but both the suspect eruptions are in this cluster and this may reduce the significance of the clustering.
The southern eruptions are for the most part weaker affairs than the tropical ones. Only the 1277 eruption shows a strong sulphate peak. Most of these eruptions will be from Chile or New Zealand, regions which can do large eruptions but have too few volcanoes to do this regularly. (Although, one should be aware that Taupo should never ever be taken for granted. Its eruptions are infrequent but ewe-some.)
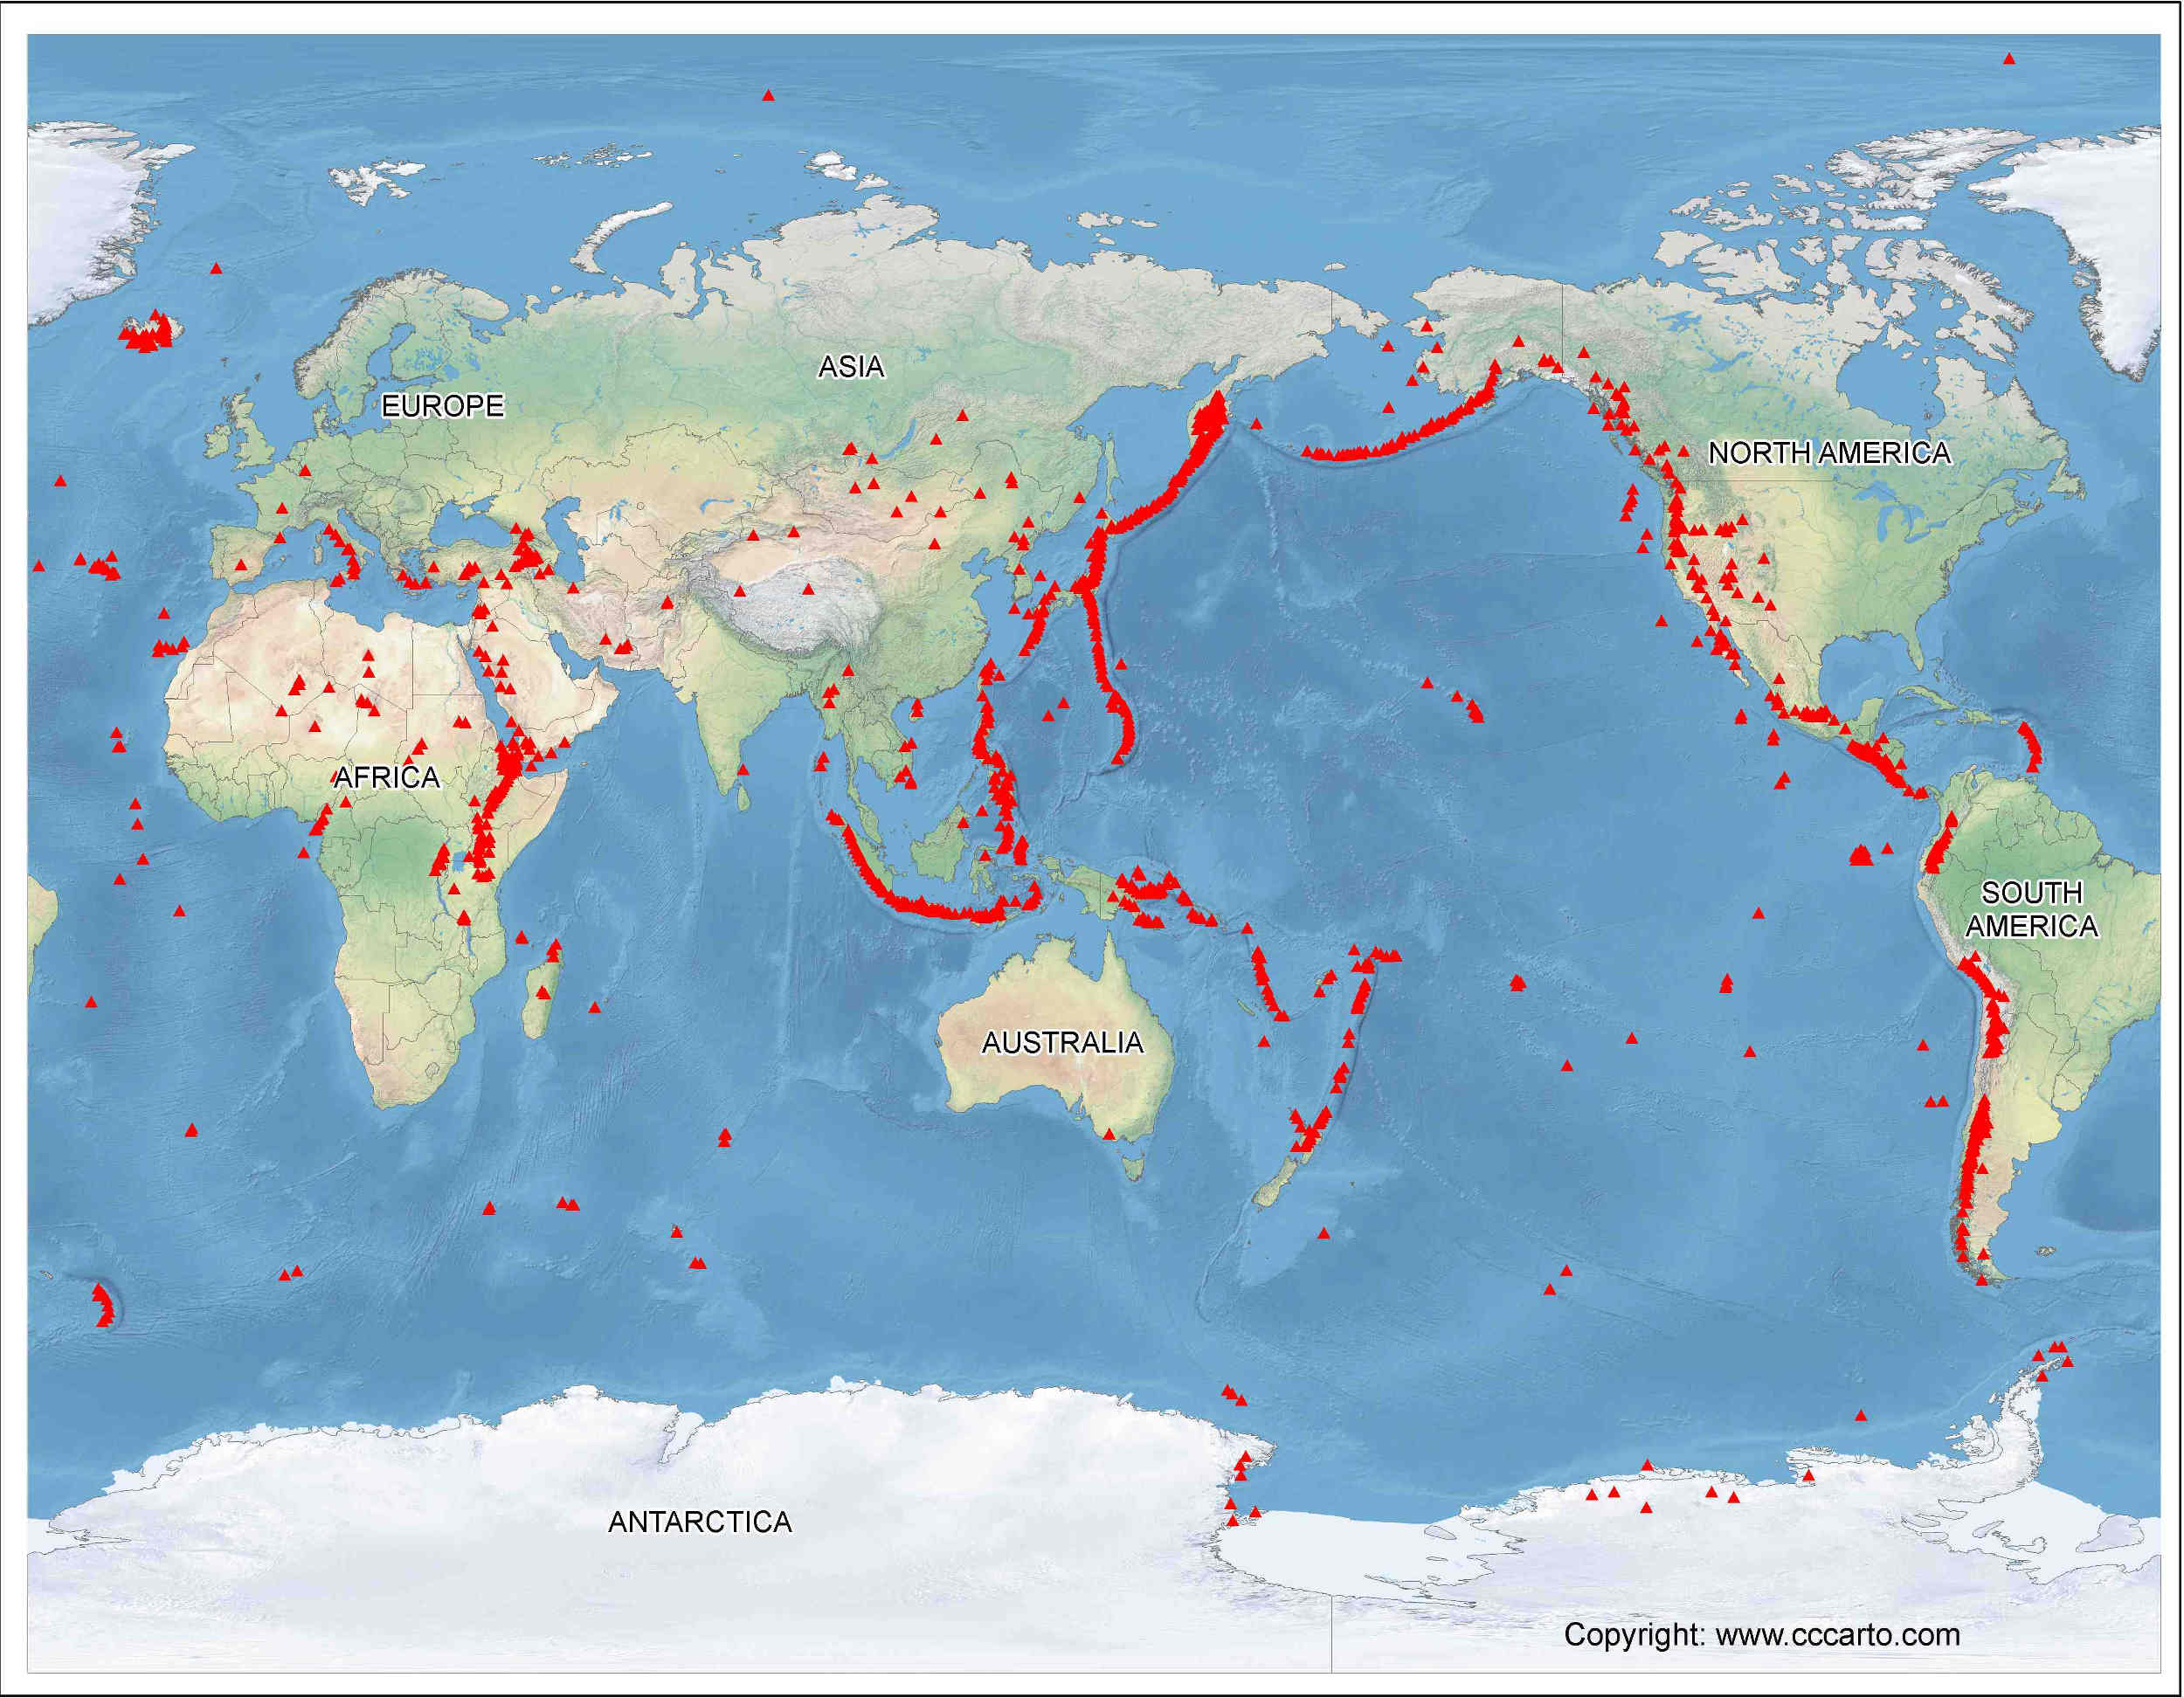
Source: https://www.cccarto.com/icons/world_volcano_map.jpg
We can do the same thing for the north, and this gives the plot below. Now there are 17 eruptions visible which are exclusive to the northern hemisphere.

The northern eruptions occur at 939, 1003, 1011, 1021, 1029, 1112, 1138, 1183, 1201, 1210, 1212, 1215, 1220, 1233, 1330, 1341, 1390, 1470, 1478, 1480, and 1496. The 939 and 1183 events are strong; some of the weaker eruptions cluster in time and may be related or may be part of a single longer-lasting eruption.
It is notable that the north shows much more volcanic activity than the south. This is understandable, since outside of the tropics, there is more volcanic activity in the northern hemisphere (Iceland and the northern Pacific ring) than in the southern hemisphere (New Zealand, Chile). Also, the volcanoes are at higher latitudes and therefore closer to the icecap. Iceland is a prime contender for many of the eruptions; others will be from Alaska, Kamchatka and below, and perhaps some from the Azores.
to be continued


Good post again Albert – thanks
Holy Smokes Bullwinkle! ANOTHER fascinating article.
Thanks Albert. I was going to ask whether the tropics’ signals that were stronger in Greenland, were more likely to be from just south of the equator, but you already answered it in the opposite direction. This could then (obviously) narrow down the candidates for potential triggers for the viking settlements. There can’t be many volcanoes in that band, that could produce large enough eruptions to have such an effect. Presumably, once the numbers are narrowed down, it would be possible to start matching other signals, such as ash composition?
And if I had the time, it is the sort of thing that would fascinate me enough to start digging a bit further. It would also tempt me away from the Icelandic volcanoes, which interest me more because of the amount of data available, although my early interest in geology as a child hasn’t progressed.
My first volcanic visit was to Lanzarote, then Teide. Apart from a general interest of Iceland and several visits, I also visited Santorini a few years ago, so I just “had” to pay a visit to Nea Kameni.
IIRC, the Santorini caldera used to bubble enough acid that boats and ships would anchor over it for a few days, be de-weeded etc for free.
Daren’t stay too long lest their immersed brass & bronze fittings begin to dissolve, their deck hardware tarnish…
Then Nea popped up ??
RE: “I also visited Santorini a few years ago, so I just “had” to pay a visit to Nea Kameni.
Hence…once again the recommendation of Freidrich’s-‘Fire in the Sea’.
When I visited ancient Thera, I picked up another book, which I need to find after my move. I suspect it’s still in a box.
You can try to narrow it down by seeing how much more sulphate was deposited at one pole compared to the other. You do have to be careful, as details of airflow and weather on the glacier can make a difference. There are several different cores at each pole and it is good to use more than one for each, to get a kind of average. It may be possible to separate volcanoes near the subtropics from those more or less on the equator. But be cautious. Ash is by far the best way to trace the originating volcanoes. But finding ash in the ice is pretty rare, sadly. Identifying the volcano that goes with a particular ice signal is the ultimate price. It is hard. Remember that as recent as 1809 there was a major eruption which we have not identified.
Thanks Albert. Of course, when you think of winds and Greenland, the jetstream could influence things, depending on height.
Looking at the list of large volcanic eruptions on Wikipedia (the easiest one to find), it is very small around the mid-14th century and nothing listed in the tropics, until Pago in 1370 (with a large margin of error). There was however Avachinsky in 1350 and Knappafellsjökull (Öræfajökull) in 1362. Pushing it forward to the mid-15th century, there is Kuwae (or possibly Tofua) in 1452 or Pago (given its large margin of error) for tropical, plus there was Veidivotn in 1477. Given your mention of 1809, I supppose it’s also possible there is another unknown eruption. With Pago in the tropics, it is tempting to try to match it to one of the tropical-looking peaks in your charts within 160 years of Pago. Actually, trying to match peaks to eruptions would keep me out of mischief for a while, even if it doesn’t actually achieve anything meaningful :P.
There is also the possiblity that it wasn’t a single event that caused the demise. Away from volcanoes, I’ve seen too many instances of issues being caused multifactorially, to rule that out.
Given the repeat rates of the Alaskan arc, would be easy to lose an entire eruption’s local evidence to subsequent cataclysm…
Haven’t a few ‘surmised’ eruptions based on far-falls been back-traced using sea-bed coring ??
And then there’s volcanic tsunamis which, along such active arcs, may derange the topology…
Speaking of tsunamis, d’you see the report of finding deep-buried mega-ripples apparently caused by the Chix’ Event’s mega-tsunami ??
https://phys.org/news/2021-07-megaripples-evidence-giant-tsunami-resulting.html
Impressive and as usual, comprehensible. Thank you. There’s a map too. The equator crosses Ecuador and I think, Kongo.
So it is visible that there is much less continental mass on the southern half of the globe, so less collision, less active continental margin with subduction, fewer island arcs with trenches.
If it were pastures horses would pick the southern half, lots of room.
I wonder though whether there might be the same amount of volcanism, just on the sea floor which wouldn’t show up in ice cores and not cause famines.
We know surprisingly little about submarine eruptions! There was a very large one near Madagascar just a few years ago. They don’t affect the atmosphere, as far as we know, unless of course they erupt close enough to the surface to explode into the air. Most undersea eruptions are on spreading ridges, but not all are.
Are there any ice signals unique to near-surface submarine eruptions? Like is there concurrent seawater or another isotope also put into the stratosphere and co-deposited with the sulfur? I imagine the “best” signal would be orphan tsunamis or other disturbances of note, but some places like the Kermadecs or Aleutians might have been remote enough not to make too many waves (ha) for humanity at the time.
I think maybe chlorine content, I dont think there is much chlorine in magma, but obviously a lot in the ocean. Think of the HCl saturated steam plume at the ocean entries in Hawaii, basically that but it is way bigger, and if it is blasted into the upper atmosphere it will stay there a long time.
I would rather assume there is next to nothing as they are not high enough. Albert said in the discussion of Soufrière St. Vincent, subareal, that 10 km is not enough, it would have to be 20, so a Big Bang.
I was wondering though whether Soufrière St. Vincent sitting on the eastern border of the Atlantic Ocean could be made responsable for the weather we have right now. This wouldn’t show in ice cores though.
western border of course, shit.
Shit. Western border of course.
Sometimes they’re only known from pumice rafts, such as that Pacific case that a yacht met. IIRC, satellite imaging managed to back-track eruption…
Indonesia is quite equatorial with most of its volcanoes around 5-10 degrees south. Same goes for PNG, Solomon Islands, Vanuatu, etc.
Philippines is about 7-20 degrees north. Central America which has a lot of volcanoes per square inch is about the same latitude as the Philippines.
Really enjoyed this one. Part of the many reasons I come here everyday is to learn a little more about my second favourite topic (space and astronomy being number one). Looking forward to part 2.
Fantastic article. One of the many reasons I come to Volcanocafe everyday is to learn something new about my second favourite topic – behind space and astronomy of cause :). Looking forward to part two.
Another fascinating article. Thank you Albert! I look forward to the next part.
Just tried to download the Sigl paper. As a non-academic, a PDF copy costs $32 and requires the use of ReadCube, which means creating yet another account/password set up and giving it my credit card information.
You’d think it would be easier to buy scientific articles without working for a university, but it’s not. /end of kvetch
Thanks Albert for this topic, the history is really fascinating.
Well Thankfully: “to be continued” … cause i was thinking…… well… that can’t be all.?? Looking forward to part two, too, meaning ‘also’ for Carl.
🙂
Lava devil RUV cam 01:13 at the right side in the primary lava channel.
Thanks for the great article, Albert.
Imagine collecting ice cores in the arctic and then almost losing them to a freezer malfunction at your home institution. This happened a few years back at my employer:
https://www.theguardian.com/environment/2017/apr/16/arctic-ice-cores-melt-university-alberta-canada
Really a nightmare scenario for any scientist, which is why we spent so much effort to secure our samples and data.
8 minutes 29 secs of a lava tornado in action near the active cone, starting around 01:10:29 am. Some of the lava crust is really tossed around. See https://drive.google.com/file/d/1C-IJmw7Lw7hn0Y-Q0O77MqiJoVAiVd0L/view?usp=sharing. The cyclonic winds can really do a number with the hot lava crust.
Makes me wonder if it was a similar process that ejected magma and clonked Boris Behncke on the head on Etna a few years back. He and his fellows were near a lava stream at the time though I believe a lot of it was under a crust.
Like with vaccinations that have to be deep frozen the transport seems to be the main problem. Realizing that vaccinations don’t work in some cases – see Israel – I wonder whether they were damaged.
And so I wonder about the precision here. The best seems to be to have ice core and tree rings, both, two methods. The orphan tsunami of 1700 was only found when scientists started asking real questions about the ghost forest in Oregon (or Wash. State).
Accordingly I am highly impressed by the results here on VC, combining ice, trees and historical events, that’s perfect.
8.2 of the coast in Alaska, tsunami warning issued
50 km depth – that will help soften the blow. It is the largest earthquake since Fiji 3 years ago
Here are the seismic waves of the 8.2 passing Kilauea.
Sirens going off in Alaska, wave warnings
https://twitter.com/rawsalerts/status/1420639491744833537
USGS
The good news is USGS estimate less than 1% chance that this was also a foreshock of a stronger quake within the next week 🙂
https://earthquake.usgs.gov/earthquakes/eventpage/ak0219neiszm/oaf/commentary
Seemed to have missed part of the quote
You normally expect that the strongest aftershock is one magnitude less than the main one. In this case that would be M7.2. It may not be within a week, it may be a bit weaker (high M6) or it may not happen and all aftershocks are much weaker – there is no law tat it has to be M7.2. They put the chance of an M6 as 45% but that is within one week. Over a longer period it should be higher. Glad that there does not seem to be much -or any- damage
It seems obvious to me that there is an accumulation between 1100 and 1350, north, south and tropical. So I wonder whether they led to the end of the so-called medieval warm period:
https://en.wikipedia.org/wiki/Little_Ice_Age#/media/File:2000+_year_global_temperature_including_Medieval_Warm_Period_and_Little_Ice_Age_-_Ed_Hawkins.svg
The first and the second flood of Marcellus (1219 and 1362) happened at the end and after the MWP. The islands were formed then. There is not much material in English it seems. They reshaped the German North Sea Coast, possibly also the Dutch coast.1436 the Island of Sylt, the northernmost island before Denmark lost its capital, small Atlantis, sort of, to the sea.
Plus Denmark, possibly.
It was called Eidum. Just in case somebody finds more in English.
The flood in 1436 was called All Saints Flood. When I study dates and timelines I always get to the same conclusion: Climate cooling is the larger problem.
Within limits. I have written here that a little global warming has been helpful. In my opinion, the little ice age was nothing else than the start of the real one. It reversed because of us, the industrial revolution. But go too far and you create worse problems than what you have solved. We can live with 1C warming, although not in all places. Got to 2-3C warming and things get bad very rapidly. Beyond that is unthinkable. How do you move Bangladesh? We are resilient against weather. But much less so against climate. Changing the climate means playing russian roulette with the weather
Agreed.
Sadly neither the UK, nor the rest of the world will get to carbon neutral within this century, unless famine/war/disease solves the problem for us.
The optimistic people keep forgetting that (from memory) electrical energy is only about 1/3 total energy, all technologies are very mature and limited by the laws of thermodynamics.
Just a sad reality nobody wishes to confront directly.
I believe, maybe naively, that you could solve it by making existing storage larger, creating new storage (Forests), working with precise numbers, maybe enriching both arctic oceans with iron and above all, prevent with all means fires around the Arctic Circle.
I believe strongly that you won’t solve it by getting folks in the West into a new industry that they cannot even afford. I can’t afford a Tesla, and I am not willing to just dump my older car and lose loads of money. Besides I’m not keen on a car which is connected to some rumours of child work under the earth. And I don’t like pit stops.
But I’d gladly pay some taxes for storage enhancement and fire prevention. Besides I think arsonists (Australia, California, Indonesia, possibly also Brazil) deserve five years of prison.
Then there are methods developped to split the CO2 in the stratosphere. I have no opinion about them as I am not a physicist. But I would be happy if Albert one day wrote about them, in between volcanoes.
You, the British and Americans here, should know (me thinks) that our head of state is a driving force, but we just cannot afford it. There are rumours of us being rich. That is fake. Our industry is rich, was at least before Covid. We cannot afford it. One example: We have now the highest electricity costs in Europe, maybe the world. We pay between 500 and 1000 E for health insurance. So, in the end of the day there might be some change to some illusions. Energy mix would be a good step. And modernized Atomic Power. No coal though.
Try actually doing the sums, its a nice idea, doesn;’t remotely work.
About half of what we need will have to come from energy efficiency. That is an uphill battle against what the manufacturer want which is not to change anything. It can be done. Lighting is now 60% more efficient than 20 years ago. Cars are 30% more efficient (at least in Europe) in spite of being heavier. The new macs are 30% more efficient. Technically it is all feasible but it requires legal action, i.e. government laws to overcome industry inertia. The other half will require far more drastic changes. We will end up with some level of fossil fuels remaining, mainly natural gas. Getting the allowed amount right, that is a task for the scientists
Not all history is reliable. The flood of 1219 was real. The one in 1362 was made up by later writers. There was an extreme storm in january that year (the Marcellus storm) but no flood. The wind direction prevented that. There was a severe flood in 1436, but also in 1374 and 1421 (twice but the St Elizabeth flood of November by far the worst), with another one in 1424 preventing recovery
Thank you for the details.
No you couldn’t move Bangladesh. However the main problem is not tackled: Birth control. Imagine two VEI 6 in two consecutive years or one Campi Flegrei.
Getting the population down would mean living in safer places in 100 years or so, more education etc.
Water is a problem. I won’t touch the agriculture of South America, there’s a better example. The Indian tribes that live in the Grand Canyon are complaining that they, the animals and the sparse plants of the canyon aren’t getting enough water any more because of the ever-growing tourist place above the attraction.
In 1950 the population (estimated, I doubt there was a census) of Africa was 250m max, Europe was 500m. Now Europe’s population is pretty much the same, but Africa’s population is five times greater and headed for 4 billion by 2100 – from 9% of world population to 39% in 150 years.
https://en.wikipedia.org/wiki/Demographics_of_Africa#Shares_of_Africa_and_World_Population,_0%E2%80%932018_AD_(%_of_world_total)
“The population of Africa was 177 million in 1950, and it grew 7.6 times to more than 1.341 billion in 2020.”
Bangladesh is a problem but insignificant compared with African population increases.
Anyone remember the Live Aid concerts in 1984? Ethiopia’s population was 40m. It’s 110m now.
Hi Albert, is the 1362 Marcellus flood really unreliable? At least here in northern Germany we’ve been told about the ‘Grote Mandränke` with the demise of Rungholt and lots of fertile soil and cattle and people being lost.
Yes, apparently this is especially famous in the German literature. In England the wind direction was south and west while in the Netherland is was south and perhaps southeast. Winds were extreme: there were English reports of trees being sucked out of the ground complete with roots. There are very few authentic German sources. One contemporary source from Bremen mentions the wind but not a flood and a source from Luebeck also does not mention a flood disaster. There may have been a river flood of course. But anything as bad as in the tradition would have been mentioned in contemporary sources and it is not. The oldest German source is from 1395 but it gives no details at all (‘many people drowned near the sea’) and does not seem to be based on eye witness reports. There were several significant floods in the 14th century, and the 1362 Mandraeke story seems to be a collation of those. As one critic writes, it should be considered as a symbol rather than an event
Thank you for response! That is really new information for me … having in mind all the literature for the last 30 years on Rungholt e.g. … looks like I shall refresh the old information on that story. The description on the winds sounds a bit like ‘Christian’ in October 2013 … a Shapiro Keyser Cylone, that drilled hundred years old oak trees out of the ground here (95 kts of wind gusts). It started also with S-SE’ly winds and heaviest storm from S to SW. Interestingly, 6 weeks later there was another storm called ‘Xaver’ with less entertaining winds, but caused a heavy storm surge along the shores of the Frisian Islands with its NW’ly wind pattern. May be it was similar back then in 1362 …
For those interested: we may have a new lava lake in the world. This is Anak Krakatau, three days ago, Sentinel. The lava blob became visible around the middle of June and has persisted since
A lava dome — blocky flow
Not fluid enough for lava lakes
It looks like the tropical eruption in 1172 (1171 in the Sigl paper, I found a free copy) was a honker, and there doesn’t seem to be any information about it.
Sigl paper (Extended Data Table 4) shows some intriguing mystery eruptions:
Year — Greenland SO4 —- Antarctica SO4 —- N-Tree z score (tree stunting, northern hemisphere)
-426 99.8 78.2 -2.74 (probably tropical VEI7)
266 61.0 11.3 -1.70 (mostly northern)
536 99.0 N/D -3.36 (northern only)
1108 48.3 11.6 -1.99
1171 37.0 19.5 -0.91
1230 56.4 23.1 -1.71 (big and tropical)
1695 28.6 22.5 -1.63
1809 34.6 25.4 -2.18 (big and tropical)
Data for some known very large eruptions
1258 90.4 73.4 -1.43 (Samalas, VEI7)
1458 39.0 63.6 -2.31 (attributed to Kuwae)
1601 39.2 18.7 -2.62 (Huaynaputina, probably VEI6)
1783 135.8 N/D -1.16 (Laki)
1815 39.7 45.8 -2.51 (Tambora, VEI7)
Just as an aside – it would appear Mars has a mantle and core similar to earth!
https://www.theguardian.com/science/2021/jul/29/nasa-insight-lander-reveals-internal-structure-of-mars
Which begs the hypothesis…volcanic activity on Mars: is it merely quiescent at this moment?
No subducting water-laden plates.
And no magnetic field.
Well, I never said it was identical to Earth! Anyhow, I found it of interest.
Now data on the Geldingadalur flow rate: It seems my speculation that the previous flow rate data point was less reliable than the others turns out to be correct – using the more precise photogrammetry (the latest 3D model) they now find a flow rate of 11.3 m^3 / s on average (not including the previous radar profiling point). So, the early prognoses on hell machines etc. are remarkably on point still!
I still do not understand how they took these photos however, maybe they are using drones now? The new 3D model is a bit different from the others, and they were definitely not using the usual mapping aircraft.
I must say I am actually surprised how much of my speculation has panned out. Extra vents did open, and fountaining got more powerful, and the flow increased too. I dont think the original concept where the mantle decompresses and melts at an exponential rate is occurring, there would be no end otherwise, but expansion/erosion of the conduit has certainly happened, and that could be the more important factor really.
This thing is going to go on for a long time, it is going to look a lot like Lanzarote later on.
Carl wrote that in Lanzarote it went 20 km into the sea. Do you think that will happen here?
Yes, it can easily reach the ocean, it hasnt so far because the flow hasnt stabilised to Natthagi, and Meradalir is a big sink. If the other side of the cone fails and all the lava spills into Geldingadalir it will go to Natthagi, it will be in the ocean before anyone can really do anything about it. The walls wont hold, they ‘won’ because the lava stopped going that direction.
Remember lava from Pu’u O’o flowed over 20 km to Pahoa back in 2014, at less than half the effusion rate of Fagradalshraun.
Yes, but I think critical to that was the steady outflow rate, no pulsing and big bursts. After all, that flow went almost entirely through a closed underground tube system for those 20km, which was stable for weeks at a time. The lava was basically invisible until the end of the tube at the cliff, you could only guess the flow path from a few spots venting steam. (And IR imaging of course)
I do not think that kind of system is possible with the kind of pulsing flow we see in Iceland. Also, the lower flow rate might actually have helped in Hawaii. A higher rate must be more likely to lead to channel erosion and dynamic effects altering the tubes and making them unstable.
Meradalir is basically a massive lava lake, it will overflow and keep a steady outflow even with a pulsing vent. Look at all the steady flows since May despite very episodic fountaining.
The other option is a longer pause where no lava erupts for week but then a weeks worth of lava erupts in a day, that will send lava flows a long way, certainly to the ocean if it goes in the right direction.
A massive amount has just been deposited in the corner opposite the inflow. I don’t have a scale but it seems to me the level has risen by 5 meters or more in a few hours. Here are the ‘before’ and ‘after’ screenshots
Given the speed that the flow has overwhelmed the hills down to Meradalir, I can’t say I am surprised by that rate.
It looks like the hill with the instruments on will be overwhelmed very soon.

That is reassuring. I had estimated the accumulation in Meradalir and the channel at 12+ million m^3 over 16 days before that or ~10m^3/s and wondered what I got wrong. How in the world did they end up 30% underestimating? They should be more, not less, accurate than a random eyeballer.
Nothing done wrong, i think. On the plot the previous number is shown with an error bar (as it should) and this error bar covers today’s number. It is all consistent. Neither is the error bar larger than usual. They were just unlucky with the uncertainties
Not sure about “reassuring”… I think it’d be better for Icelanders if this thing would stop at some point :-). But maybe it should do that after a good long tourist season 🙂
At any rate; they did not really get it wrong – within the error bars provided (assuming these are 1 sigma or even for 90% CL) that was an acceptable result. And the eyeball could also have gotten it “accidentally” right (or was influenced by the assumption that the rate would stay constant – I know I was). Someone posted at some point observations that were consistent with a lower rate. Measurements always have errors.
In their case I was just suprised that they estimated similar error bars for both methods. Since the layers are very inhomogeneous I would have expected much more uncertainty for the far lower number of profiling points. Also, in the 3D data it is probably easier to distinguish cooling contraction from the deposition of new material. But maybe there is some other big uncertainty in the photogrammetry (large-scale warping of the model in the 3D reconstruction is probably hard to control now that the surfaces are large; also continuity issues, maybe?) that is not present in the profiling data (which is more “absolute” if the devices are running correctly and the flight stable). And maybe that brings the error bars up to the same level. They certainly seem too large for statistical errors.
Typing for too long, so Albert was, as usual, quicker with less rambling. Back to tea and biscuits for me 🙂
You are making a good point that the error bars seem larger than appears from the point-to-point fluctuations. They may include systematic uncertainties. There are three radar points on the plot (light blue) and all three fall below the trend. That suggest that there may be systematic difference between the different methods
I mentioned this a while back, but can they not triangulate sulphate spikes via a third ice coring, in for instance, a glacier in the himalayas or the tibetan plateau, or perhaps in the caucasus? Somewhere that isn’t too likely to be contaminated like the Andes would be.
Nope. You fundamentally misunderstand the geography of the problem.
These are ice sheets that the cores come from. They are NOT individual glaciers. Individual glaciers flow downhill in valleys. That means the ice in them goes from start to end in fairly short order. They flow a huge amount faster than ice sheets. They are also a lot shorter than ice sheets.
Ice in valley glaciers simply doesn’t have the dwell time to accumulate like in an ice sheet. All too soon it reaches the snout of the glacier and melts.
There are a few exceptions where strange terrain configurations cause build up, as Ötzi the alpine mummy proves. Those are very definitely the exception rather than the rule.
Right. Besides the Indian plate moves north at 5cm a year. The Eurasion plate moves north at 2 cm a year, so net is 3 cm, and there is considerable deformation and also erosion. This couldn’t be done there:
https://www.theguardian.com/environment/2021/feb/13/colder-and-deeper-scientists-close-in-on-spot-to-drill-antarctic-ice-core-15m-years-old
The headline is right, but the number in the link wrong. They mean 1.5my
Thank you btw for explaining the difference between an antarctic ice sheet and a glacier. I wasn’t aware of that.
https://www.explore-share.com/trip/grossvenediger-ascent-normal-route/
One of the nicest in europe
That is not fully correct. There are ice cores from glaciers that go back over 1000 years and have volcanic signals. They are more difficult to date because there is summer melt and this can mean missing layers, the bottom deforms because of flow, compression and melt, and they are in areas with vegetation which introduces other sources of sulphate. There are some detections of volcanic eruptions in mountain glaciers, such as Mount Parker (1641) in an ice core from Mount Everest. A long ice core has been obtained from Mt Churchill. Getting the ice cores down from the mountain is difficult: planes can land on mountains and it may be too high for helicopters. But that doesn’t seem to deter scientists
There doesn’t seem to be too much known about Mount Parker. There is a 5 with a questionmark, and the crater lake was formed. So I scrolled up to check whether it was also seen in the ice cores from the poles, and for the first time was bitterly disappointed. Stops in 1500. I hope it’ll go on in part II. Very useful btw.
It’s nice near the poles that nobody would disturb them, watch them or steal equipment. No devastating earthquakes like in Nepal. Besides there’s no night while they are busy there. And then, to find an untouched terrain you would have to climb much higher with the heavy equipment.
I once read how terribly difficult it was to recover the bodies of the victims of TE 901 on Mount Erebus. They managed, but it was hard. Then glaciers are not as far as thick as Antarctica is. And who would want to drill holes into them?
People lowered down by the heli at the communication hill. Time to rescue hardware? Seen on mbl cam.
Now at 18:04 on the close up camera heli is picking up equipment.
Sorry, my stream was not live. Look at 18:37
They are not rescuing the pallets (but tossing them into the lava 🙂 ). I guess that means they are not flying them straight over to the old observatory hill to set them up again (which is probably the closest point possible at the moment)
On mbl close camera
Not often you see equipment rescue in real time – only just in time too, the hill is vanishing fast. Tripod with instruments or camera just hoisted up and away. Looks like a comms dish (?) and some other kit still to go.
Don’t know what the mbl camera frame speed is, but the rotor blades appear to be moving very slowly.
I assume the volcano is in off mode so there’s no new lava coming out at the mo.
Amazing that the hill is about to be over topped.
And good on the camera rescue crew for going for it.
Well, based on your username you will not be happy to hear that the trusty “Eolienne” on the hill that was providing power to the sensors has not been rescued, but left behind as a sacrifice to the mountain 🙂
Ah, that’s what it was, a small wind turbine! Thought it was a steerable dish.
I presume its feet were just too deep in the lava, pity. They had a good go at digging it out. Most of what I thought was kit turned out to be wooden pallets which were also sacrificed.
I presume what went included the visir camera, as it’s frozen at 18:55.
Oh noooooo!
🥺
Guys working with shovels, the comms dish must have its feet stuck in the lava. Chopper poised above the scene.Landed now, crew and work gang loading up.
Brings a whole new meaning to Mountain Rescue.
That’s the Icelandic Coastguard helicopter, an Airbus H225 Super Puma.
They bought two of them in 2019. Leased from Norway.
If it’s not a temporary glitch, the 2-4Hz tremor on faf.gif just went upwards. Usually it takes a few hours before the action begins anyway.
It’s about the period of previous lulls,so it would make sense.
Can anyone explain why I cannot log in, nor change my password or anylike?
My Avatar is correct though 🙄
Why is the eruption of Paektu Mountain not visible in the “volcanic ice cores”. That was a VEI7?
There’s a huge red spike there a little before 950. That should be it.
No that’s not it.
Sun et al.,(2013)[11] found volcanic glass in Greenland, which could well have originated in the Millennium eruption magma (rhyolite and trachyte). The age of the volcanic glass layer is 939/940 A.D. However, Sigl et al.,(2015)[12] found out that ice-core chronologies are 7 years offset, and the Millennium eruption glass layer should be in 946/947 A.D. This conclusion is consistent with wiggle-matching dating and history records.
So it’s 7 years offset, because it mixes with 939/940AD. But there is Eldgja… which erupted in 939 https://en.wikipedia.org/wiki/Eldgj%C3%A1. Eldgja was huge, a bit larger than Laki, and it’s sulfur would have had an easier time getting to the very geographically close area of Greenland.
So it’s not 7 years offset. It’s just Eldgja we’re seeing. I also think the huge red spike if it was really Mount Paektu would have been more visible in Antarctica volcanic ice cores. It suggests that the eruption was very northerly, especially due to the size of the spike.
I’ve been further thinking about it. I think there are three possible solutions to my problem
1. There is something about volcanic ice cores i don’t understand or they seem to miss certain eruptions (weather circumstances or other circumstances, or other scientific explanations) which is very important because that means eruptions can be completely missed, meaning there might be more, or that they’re not as reliable as we think.
2. The date of the Paektu Mountain is wrong, and the ice core is not 7 years offset. It’s the date of Mount Paektu that is 7 years offset, meaning it might have happened at the same time Eldgja did happen.
3. The date is completely wrong of Paektu Mountain which given it’s wikipedia page seems to be a possibility. An offset date of Paektu Mountain by a few centuries might explain one of the many mystery eruptions.
There are other weird volcanic ice cores or volcanoes that don’t seem to have made an impact, while it’s size suggest something else. The Thera eruption of Santorini is another example. Aniakchak is clearly found in 1627BC, the spikes around it are less clear. Archeologists traditionally place Santorini a century later, while radiocarbon dates are in disagreements. Apparently, i’ve just read that some research suggests a tsunami hit Turkey in 1633BC. But there is no volcanic ice core data that supports this. There is a possibility it might be somewhere 1639-1638BC because of Irish frost oak rings, but there’s no volcanic sulfur signal.
https://www.cambridge.org/core/journals/antiquity/article/absolute-treering-dates-for-the-late-bronze-age-eruptions-of-aniakchak-and-thera-in-light-of-a-proposed-revision-of-icecore-chronologies/0E06053BFD90C1EA58ED8822814DC6F8
There is a 1610BC signal but very weak and unlikely to be Thera. There is a 1653BC sulfur signal that could be attributed to Thera, but the researchers say it’s unlikely though it cannot be ruled out. I honestly believe this is the spike of Mount Veniaminof’s eruption at the time which also happened at that time and was a VEI6 almost comparable to Aniakchak.
Some other famous problems: the conflict between Ilopango’s radiocarbon dates and the 540 eruption (i think the size of Ilopango might be too strong for the 540 signal, but there’s also too little reading material about the impact of that eruption on Meso-American civilizations to be sure).with the 535/536 culprit still unknown.
I recently found this chart, it is West-Antarctica volcanic ice core dating back to 11500BP, the beginning of the Holocene.
Annual non-sea-salt sulfate (nss-SO42−) flux in the Holocene part of the WDC core. In sections where non-sea-salt sulfur (nss-S) was measured, rather than sulfate, contribution from methanesulfonic acid to nss-S was subtracted prior to nss-S conversion to nss-sulfate. The 11 largest volcanic events are labeled in order of rank by total volcanic flux. Vertical bars in the middle of the graph represent the largest nine volcanic events in the EDC96 ice core (Castellano et al., 2005). WDC, West Antarctica Ice Sheet Divide deep ice core.
Source: https://agupubs.onlinelibrary.wiley.com/doi/10.1029/2020JD032855
I find it to be honest very hard to read. Most of the biggest events here have unknown culprits. The 426BC mystery eruption seems to be again very visible. Tambora is already labelled. #7 seems too late for Kuwae and too early for Huaynaputina? I have absolutely no idea of #4, #2, #10, #5, #6 and #9. As well as the biggest one #1. However #3 seems to match with Mount Mazama / Crater Lake.
Wow. I’ll read this tomorrow. I’ve done some thinking as well. It is at the end right now and I’ll study this. Good night.
What’s happening in katla? A swarm now.
They’re all very shallow, so it could be summer icemelt, but I’m sure some more expert opinions will shed some light.
Two earthquakes, 3.9 magnitude and 4.5 magnitude according to the Icelandic Meteorological Office, occurred in Bárðarbunga yesterday evening. The smaller one was at 19.02 and the bigger one at 22.12. Páll Einarsson, geophysicist and professor emeritus, says that the US Geological Survey has estimated the magnitude of the earthquakes to be 4.3 and 4.8.
“This is a continuation of a series that has been going on since 2015,” Páll said yesterday. He said that seismic activity in Bárðarbunga had decreased when the Holuhraun eruption (August 2014-February 2015) ended. Then it increased in the following years, until it declined somewhat in recent years. Paul said that these earthquakes were probably caused by a landslide.
“GPS measurements show that Bárðarbunga has been expanding. There are two ideas in the air about what caused it. On the one hand, that there is a magma collection and that Bárðarbunga is preparing for the next eruption. The other is that she is recovering from the conflict in the eruption. The pressure has dropped so much that it is now attracting magma. It is not exactly easy to reconcile these two theories, “says Páll in a report on the development of Bárðarbunga in Morgunblaðið today. If it is preparing for an eruption, then these earthquakes are a sign of that. “But there is no going to erupt tomorrow or the day after,” he added.
I think “landrisi” should translate as land rise, i.e. the probable cause for the earthquakes is uplift, not a landslide.
Thursday
29.07.2021 19:22:21 63.659 -19.102 0.1 km 3.2 99.0 7.6 km ENE of Goðabunga
Thursday
29.07.2021 19:20:14 63.658 -19.084 0.1 km 3.2 99.0 8.4 km ENE of Goðabunga
(from mbl)
Ragnar is awake!
Question to specialists:
Lee Siebert has Paektu (Changbaisan) in his list for the year 1000. 7 is with a question mark. Before he has Guaga Pichincha, Ecuador for 910 with a 5, Towada, Japan for 915 with a 5, Ceboruco, Mexico for 930 with a 6, and between 945 and 950, some dates with question marks and several volcanoes in Japan and Kamtschatka without dates for the VEI and the output.
Q: 1. Aren’t the results of ice cores only a piece in a puzzle which need additional dates on the volcanoes themselves first?
2. How come Wikipedia says Paektu had an eruption in 946 whereas Siebert doesn’t even mention it? He places it in the year 1000 with its Chinese name btw. China though has another opinion: The largest eruption occurred roughly 1000 years ago, known as the Millennium eruption (occurred between 940 and 941 AD). In a PDF on Elsevier by scientists of Beijing and Korea called “Geological background and geodynamic mechanism of Mt. Changbai
volcanoes on the China–Korea border”. Siebert is cited several times, so has worked on the volcano.
My guess: One shouldn’t use the term Millenium, and the Chinese date matches with that red spike.
Dates have changed over time. It was called the millennium eruption because it was roughly at that time. The dating to 940 was from the ice core, later changed to 946, with also some historical evidence from the far east for that year. C14 dating rarely gives better than a century. Archeology is often not much better. Tree rings are thought to be the most accurate but even here it is possible to lose a year if the conditions were so bad trees didn’t grow at all. And trees do not directly measure volcanoes they are just one piece in a tremendous puzzle. Going back to before 500, the uncertainties in the ice core dating increase quite rapidly so don’t take those dates too accurate.
Thank you Albert, good explanation. Science is work in progress, and digging out the past is difficult yet thrilling.
Besides, with the Pacific West Coast our science might be behind due to language issues at least into the seventies.
And then you certainly need permission to be in some places. Dorrik Stow was in Yunnan and loved it, but he says in his book that he had guides and the assistence of lokal professors.
Yesterday I read some science (Frisch) about another piece of the border of Tethys. It is called Penninic Ocean though. You have the massive block of the Western Tauern between Zillertal, the Krimml cascades and Mittersill with Großvenediger. There is among other material oceanic crust and signs of subduction in there plus signs of collision (African plate). So there was an ocean south of the block and in the ocean there were island arcs and coral reefs (Sella). The setting reminds me of Australia (standing for Africa) the Great Barrier Reef and the Philippines, Australia pushing forward towards Asia and, not to forget the Sunda plate and the subduction of the South China Sea, standing for the Penninic Ocean, déjà vu. I consider that fascinating.
Also, what we must not forgot about volcanic ice cores is the possibility two eruptions happened in the same year. Imagine 1991 happened 300 years ago. We would have had a hard time knowing it would have been Pinatubo AND Mount Hudson that erupted (although the spikes wouldn’t been as strong), but we probably would have looked somewhere in the tropics, perhaps around or south of the equator, and looking at the completely wrong place.
This is a very good point.
Albert, I changed my mind.
I’d really like a piece about Changbaisan aka Paektu. It has a beautiful crater lake and landscape.
Lakigigar might like that as well.
There’s a very good video that was posted on here a while back that showed the mechanism for the magma bulge under Paektu, and also an area slightly to the northwest.
Basically long far since subducted Pacific crust that was saturated with water getting stuck in the mantle transition zone and then causing melt in specific spots, possibly in conjunction with vertical plate rips as the plate subducts in some spots but not others.
This was because many thought it a hotspot – being so far away from the active Pacific subduction front.
It’s an interesting and clearly quite powerful volcano, and i’d imagine it has a decent supply of melt.
Yes, i would like a Mount Paektu piece as well, certainly.
About the 1653BC eruption according to the “finding the Thera eruption”, i made a mistake by assuming this was Veniaminof, since I thought that erupted around 1650BC. It did around 1750BC/1700BC, based on uncorrected radiocarbon measurements. It’s however possible i might still turn out to be correct. It matches the Middle Kingdom of Egypt collapse (which might be coincidental, since I couldn’t find any source for climate disturbances during that time, although the early Bronze Age epoch is known to be a rather cold one, and not much is known about most regions back at that time, and neither are evidence for Santorini / Aniakchak or any other eruption back than huge for understanding reasons.
Volcano.edu gives 1750BC (?) with Radiocarbon (uncorrected). The Alaska volcanic observatory gives 3700BP based on radiocarbon research done in 1987. https://avo.alaska.edu/pdfs/cit207.pdf
Description: From Miller and Smith (1987): “A 10-km-diameter, ice-filled summit caldera marks the top of Veniaminof volcano, a large (>400 km3) andesitic stratocone (Fig. 1 [in original text]). Postglacial ash-flow sheets extend to 50 km from the caldera rim on the Bering Sea side of the volcano; on the Pacific Ocean side, ash flows apparently entered bays and estuaries.”
“14C ages of 3640+/-200 yr and 3750+/-200 yr (samples 15, 16, Table 1 [in original text]) were obtained from charcoal in separate phases of an ash-flow tuff west of Veniaminof. These ages compare well with maximum 14C ages of 3620+/-80 yr (samples 17, 18, Table 1 [in original text]) from organic material underlying ash-flow tuff on the west flank of Veniaminof and of 3660+/-90 yr on organic material underlying distal air fall from the caldera-forming eruption. A date of about 3700 B.P., therefore, seems reasonable for the climactic eruption that formed Veniaminof caldera.”
From Waythomas and others (2015): “Extensive, valley-filling pyroclastic flows on all flanks of the volcano extending 40-60 km beyond the caldera.”
The Global database on large magnitude explosive volcanic eruptions (LaMEVE; 2017) reports a magnitude of 6.7, bulk eruptive volume of 50 cubic km and a dense rock equivalent eruptive volume of 20 cubic km for the eruption.
A date is certainly not known yet, and it’s possible that Veniaminof is indeed the source of the 1653BC eruption. The signal appears large and climatically effective according to the Thera research paper, and just like 1627BC, the Irish oak tree chronology suggest slow growth from the oaks for several years. The size of the Aniakchak is about the size or somewhat larger than the Veniaminof eruption, but both seem to be mid to high-end VEI 6 eruptions (although VEI7 cannot be ruled out, i think)
If this turns out to be true, i think it would be very interesting to know that those eruptions might have happened so close to each other given their proximity with Black Peak volcano in between them (which also had a caldera-forming eruption in the early 2nd or late 3rd millennium BC).
There are a few suggestions they stated in their paper to explain Thera. One of them is the suggestion it might have occured within a year or two of 1627BC and being masked by the Aniakchak II event. The other stated it might not be visible. The Vesuvius eruption that destroyed Pompeii also did not register in Greenland Ice, however that one was of course a lot smaller of course. Santorini must have been around 20 times larger than the Vesuvius eruption. that destroyed Pompeii and Herculaneum (and some other settlements).
So when did Thera erupt? One extreme possibility is that it occurred within a year or two of 1627 BC and is masked by the Aniakchak II event. Another extreme alternative is that with the revised ice-core dating, the Mediterranean volcano Vesuvius is now known not to have deposited acid or tephra onto Greenland in AD 79/80 (Baillie & McAneney 2015; Sigl et al. 2015; cf. Barbante et al. 2013); if Vesuvius—although smaller than the Theran eruption—did not register in Greenland ice, is it possible that Thera represents another ‘invisible’ Mediterranean eruption?
If that’s the case, the possibility of Veniaminof, Aniakchak and Santorini all erupt so close to each other intruiges me. You would expect bigger climate disturbances, although there is the Middle Age Egyptian Kingdom collapse as well as the 1620’s BC climate disturbances that even made some researchers try to date the Avellino eruption of Vesuvius in this era. [That date also now turns out to be earlier, even much earlier, around 1900BC, but there is still debate on that too]. So it’s certainly possible all three happened close to each other, but the lack of Thera in volcanic ice cores continues to be a mystery.
Thank you Albert, good explanation. It’s work in progress, science.
The other comment doesn’t belong here, I wrote a new one in the right place. You wrote two long and very interesting comments, Lakigigar. I don’t have the time right now and might go away for the weekend. If not (didn’t find a hotel yet, everybody vacationing) I will get back to both today, if yes, then on Monday, promised.
It’ll keep me busy and off complaining about F-beauty in Iceland. That crater lake over there seems to be a real beauty and they called it Heaven’s Lake. We shouldn’t ever think they have no feelings being so disciplined in the East. Heaven’s Lake is a very emotional name.
So, I’ve read this. What you tackle here I would put under the headline: “Going back to before 500, the uncertainties in the ice core dating increase quite rapidly so don’t take those dates too accurate.” By Albert.
Concerning Santorini there seems to be a huge never-ending scientific debate. I think the uncertainties going back in time, in this case about 3.500 years, are the same in all fields, also Archeology and History.
Going by the prevailing winds and the location of the Mediterranean, relative to Greenland, it could be that Mediterranean eruptions don’t produce good signals in the Greenland ice cores more generally, so could make them invisible.
Thanks Albert for the article, very interesting and entertaining, learned lots of new things.
Ditto!!
Kilauea getting very close to erupting now. Been a few quakes on the Kaoiki faults just behind HVO this past couple of hours, not a swarm but notable. DI events have also ceased in favor of a continual climb of the tilt at Uwekahuna, which is fairly distant to the inflation source of recent too. CRIM is moving strongly east now, like there is magma going into the southwest rift next to Halemaumau.
Only 2 more days to my prediction, it was optimistic but not at all impossible. There’s no hard rule that says we will get a few weeks of increasing quakes, not now with how hot the ground is vs December last year. At any time we could see a flurry of red dots appear on the HVO quake map and within the hour a curtain of fire is lighting up that side of the island.
RE:” Kilauea getting very close to erupting now.””
Curious. I’m on the HVO mailing list and there has been nothing forthcoming on any of this.
Thanks for the updates.
You wont find them speculating on eruptions, they wait for hard data. Problem is Kilauea doesnt give that hard data, it erupts with no warning at all, going from background to erupting in an hour.
HVO/USGS are very, very close to the vest. I think it stems from the prediction after the 1975 ML eruption that the next one would occur by 1978. 1976 Soufriere Guadeloupe also weighs on their minds.
The bigger the bureaucracy, the more risk-averse they are.
They mention the low SO2 level as indicating that magma is not very close to the surface at the moment. That may change, of course.
It will change very fast though, the only time it was increased very slow was in 2008, because the vent melted open it didnt create a dike and fissure. I guess maybe most of their staff are not old enough to have memories of before Pu’u O’o but basically all eruptions at the summit or upper ERZ except for 1959 happened very suddenly from a period of unrest very like the one we are in now. 1959 was of course deep sourced and bypassed all the normal plumbing.
It also does seem they are still more focussed on Mauna Loa, which is still on yellow alert despite being totally inactive in all metrics since April, where Kilauea is downgraded to yellow even though technically if an eruption begins right now it is still a resumption of the last one not a new eruption.
RE: “They mention the low SO2 level as indicating that magma is not very close to the surface at the moment. That may change, of course.”
You’re reply to Albert piqued my curiosity as to the HVO update which I just finished reading. Laying that against your comments, I am satisfied that their impressions of potential activity in the short run is being kept at a low profile, but they expect something. They are very clear that they know that inflation has been in progress over time and that the summit and upper ERZ is being replenished with magma. Where state and locals are concerned, there’s too much involved in gearing up for a potential false alarm for them to declare an alert and have the region sitting on tenterhooks. This is a seriously B.S. observation: “It is possible that the Halema‘uma‘u vent could resume eruption or that Kīlauea is entering a longer period of quiescence prior to the next eruption.” It’s like being in Florida in summer and saying: “Well, it might rain heavily this afternoon, or not.” Give me a break!!! We know that’s what happens here.
We know that but most people dont, so they have to put it there. They will also have to put a disclaimer if an eruption begins on the ERZ that it isnt a precursor to an eruption down in Leilani or Kapoho again, though really if that actually does happen theres not a lot more to destroy down there anymore.
Maybe my best guess is they think this is an exceptional event that has changed the volcano long term. The eruption was exceptional for sure, probably as big as possible for an eruption on land, but the caldera and collapse was not so much. Similar collapses happened in 1868 and 1840, not quite as big but very comparable, and neither collapse changed the volcano. The water in the caldera last year was unusual but not so exceptional really, it was not a bigger sign, more an accident I think.
The 2018 eruption was not of the same calibre as the collapse in 1790, or 1650, or 1500. Those are all of the same calibre as something like Veidivotn in 1477. VEI is misleading sometimes, the volume of magma involved is about the same.
A huge thank you Albert for your elucidations on ice core interpretations, their accuracy and limitations.
One thing I’d like to add is that you may be underplaying the potential role(s) that long-term weather could play on the high resolution nature of the data that’s required to correlate specific volcanic eruptions to stratospheric debris that’s getting transported to the surface/ice cores. There are several known patterns that can last anywhere from less than a year to decades, so the signals produced in ice cores could have a multi-year overlap.
In the northern hemisphere, natural forces such as “major” hurricanes/typhoons and hemispheric-scale upper air anomalies over the poles that result in SSW/PV disruptions, are two primary sources of aerosol seeds (such as salts) getting injected from the surface into the Junge layer.
Should a SSW (sudden stratospheric warming) event be in progress at the same time as a powerful eruption in the vicinity of ascending (low pressure) flows of air being thrust into the stratosphere, even a lower VEI eruption, perhaps as low as a VEI 5 could be the source of a large and prolonged spike in SO2 in the Junge layer. If descending stratospheric air associated with the SSW and a commensurate disruption in the Polar Vortex get centered over Greenland, whatever garbage there is in the stratosphere gets transported into the troposphere where it can precipitate out and fall to the surface.
The weather I mention is obviously not your run of the mill daily/weather variations, but neither is it “climate”….rather the synoptic patterns that can (and do) result when atmosphere/circumpolar flows become “constipated”…i.e. amplified latitudinally and non-progressive west to east…such as we’ve seen (with increasing frequency) on/off over the last several decades on a hemispheric scale. Given that large-scale high and low pressure systems often become long lasting and self-sustaining in-situ (due to positive feedback) during such periods…the extremes in high/low pressure-driven temperature swings aloft can in turn affect the potential strength of tropical convection like hurricanes and typhoons. Note that in 2017 following a winter with two SSW/PV disruption events, hurricane Maria (that devastated Puerto Rico) developed a very rare “open conduit” eye that connected the surface directly to well into the stratosphere beyond the normal tropopause height limit which is what made this event so unusual…i.e. a “direct short” electrically speaking. Should such a hurricane or typhoon get positioned directly above an erupting volcano (like in the Caribbean or Indonesia/Philippines ) it’s conceivable that even though the eruption did not achieve VEI 6 strength, the vertical transport provided by the hurricane could have hoisted an inordinate amount of volcanic gas/debris into the stratosphere very efficiently…well in excess of the power of the eruption itself.
In looking at ENSO and other high-impact global perturbations such as winters with SSW/PV events, there is strong evidence that these type of anomalies tend to last around 6 mos.- 2 yrs…. such as peaks in El Nino or La Nina (on average).
The point is, we’re not talking about a oneofer here. We do see patterns where the steering winds can persist almost in situ for many months (or years) at a time…and should the upper air steering winds coupled with subsidence favor Greenland at a time of an ideally-located eruption “downwind”, it’s possible that the 1809 eruption wasn’t all that big (hence “undetectable”), but the atmospheric conditions were “just right” so that an inordinate concentration of stratospheric debris got transported to the ground/ice.
A great example of such long-lived patterns was last year’s hurricane season…which in pure numbers was the most active on record (but curiously not in Total Energy Released due to higher than usual sheer and UL capping), and that the hurricane track remained highly concentrated over a narrow corridor.
Along the U.S. gulf coast, Louisiana saw multiple (3) hurricanes hit the exact same area of coastline (~20 miles radius) within a span of 6 weeks (or so)….and it was no coincidence. With quasi-stationary high pressure locked in place near Bermuda, storms repeatedly formed then tracked/rode from the GoM northward along the BH western ridge before plowing the southern U.S. coast.
Greenland is in such an area where similarly long-lived patterns like these can develop, and IMHO, a long-lived PV event or even a direct hit from a hurricane (highly unlikely but possible due to the proximity of the Gulf Stream) could explain hugely anomalous spikes in volcanic detritus making it to the ground should the atmospheric conditions favor a downward transport of air from the stratosphere into the troposphere….especially near Greenland’s latitude where the tropopause is lowest.
Correction:
FWIW,
“ideally-located eruption “downwind”, should be changed to “upwind”. Sure wish we could edit before posting? I hate revealing to the world all my writing deficiencies. LoL 🙂
In just over 3 days, about 1.5 million m^3 has accumulated in the channel to Meradalir. The depth along the channel has increased about 5 meters. In fact, the elevation of the channel is now several meters higher than the hill!!! In north West Meradalir, up to 10 meters has accumulated, the majority of that today. However, there has been very little change on the southern side and in East Meradalir. Perhaps 1.5-2 million m^3 has accumulated in Meradalir. It works out to a flow rate of about 12 m^3/s.
The current flow route is unlikely to maintained much longer. Over the past month 30 meters or so has accumulated in the channel; an average of 1 meter per day. Eventually something will break . Maybe the flow will flow into the nameless valley and then either to Meradalir or south to Natthagi. Or go through Geldingadalir to Natthagi. Either way, the old tunnels do not seem to connect to Nar’s plumbing anymore so when the flow diverts, at least at first, a large portion of the flow will just accumulate along the route.
The stills camera in Meradalir shows an outburst at 2am, and large lava river riding up the hillside before spreading eastwards across the valley bottom. I can believe that much has been deposited today.
This ice core post is exceptional, and good points about the possible influences of ENSO and SSW. Really absorbing read.
How different would the same age ash from nearer the suspect volcano be to ash further away in terms of composition? I gather that the ash would be quite different close to the volcano depending on the nature of the eruption and contamination etc., but are there any chemical markers that could be matched in both, if say ran through an HPLC-MS or an IR-MS?
New post is up! And the winner is .. Alaska
https://www.volcanocafe.org/the-great-alaska-earthquake-of-2021/
To Lakigigar, your first long post:
“Apparently, i’ve just read that some research suggests a tsunami hit Turkey in 1633BC. But there is no volcanic ice core data that supports this.”
You don’t need to find anything in ice cores with an earthquake plus tsunami . Why should you? Large Earthquakes (often seaquakes), see 8.2 Alaska right now, mostly happen independantly of volcanic eruptions, see Indian Ocean 2004, Japan 2011. You wouldn’t see this in ice cores.
The assumed orphan tsunami around 1700 with culprit Pacific Ocean wasn’t found in ice cores, but by intelligent people who had the right ideas. They talked to Indian tribes (finally) and got somebody who spoke or read at least Japanese and who studied Japanese documents.
So, ice cores are only one method of many to document earth’s history. Earthquakes without consecutive volcanic eruptions wouldn’t show up.
So, an earthquake in the area can have happened completely independantly. There is a long list of earthquakes for Turkey and also Italy and then of course, for other reasons Portugal (Lisbon Earthquake): Another famous one: Messina 1908, with tsunami. Nothing to do with Etna, as far as I know.
In ice cores you find substances like sulfur that are like shot out of volcanoes at high speed in fulminant eruptions. Albert said some place on the blog they would have to go up 20km to the Stratosphere to be found in one or both poles. So they would have to be at least a VEI5 and near the equator at least a VEI 6.
So that quake in ancient Anatolia mustn’t have had to do with Thera. Considering the frequency of Mediterranean quakes – see the centre of Italy a few years ago – that would be purely accidental.It would be classical though that it happens before. And the tree rings that I prefer put the Thera eruption in 1628 BCE.
I happen to have a few doubts about “untouched”. Living in the mountains I believe to know some things about snow and snow turning into ice. It is a “Movable Feast” like Earth in general.
Hemingway was dead 50 years on July 2nd btw.
From Jan ’19 to May! 19 and from Jan ’21 to June! 21 it was visible here how snow behaves. First you have a nice even sheet in your garden and, unfortunately, in front of the garage. When it gets cold it freezes over. After that say some wind. And then some sun and another cover of snow. Ice and wind again. At the end of the procedure it looks like a battlefield. I would believe that there is more wind in the Arctic and in Antarctica like in ghastly places like Tristan without Isolde de Cunha.
So I assume that there is the same mixture up north and south, and then there is the arctic summer. Sometimes a little bit melts away, some years more. So I wonder.
Trees seem to be a more sturdy. That’s why some spikes might just indicate the wrong year. It’s nothing like trifle.
60 years for Hemingway of course.
https://www.universal-sci.com/article/potential-methane-producing-life-on-enceladus?fbclid=IwAR0pzMpQ3x6l5ezhDW-bMrnCLVITZ7L-WmzOH0C0iTc7OH_9ErplJKRnu7M
Probaly is life in enceladus ocean in hydrothermal vents. The experts have now almost ruled out any non biological origin for the Methane in This ocean.
The methane cannot be explained by chemical – geological processes
Fascinating. A snowball moon with possibly tectonics (regions of different age) and the possibility of early life. A bit small though. Enough room for billionaires though.
Pingback: Volcanoes of the North: the fire in the ice | VolcanoCafe