
Alaska can be a shaky place. Earlier this week, at 10:15pm local time on Wednesday, there was an M8.2 earthquake in the region. It was the largest earthquake on Earth since the M8.3 in Chile in 2015. Let’s award the US the gold olympic medal for earthquaking (after all, the Chilean winner was from the previous olympic cycle). (There have been two other M8.2 shakes since 2015, one in 2017 in Mexico and one in 2018 in Fiji, so the gold should be shared between three nations.) The massive earthquake did little damage. But was this an exceptional event? Or a sign of things to come, so soon after the Anchorage earthquake?

The Alaska earthquake and the Iceland volcano. This is the faf low-frequency seismograph plot, which should be showing the eruption but instead shows the Alaskan waves passing. The irregular part at the start (red) is the P-wave. The nice looking one is the S wave, arriving 10 minutes later but remaining visible for several hours.
Earthquake zones

Earthquakes this size occur somewhere on Earth on average once every one or two years. Since 2000, there have been 15 earthquakes of M8.2 or larger on Earth. They are plotted above. 10 of these were along the Pacific, and the remainder cluster along Indonesia in the Indian ocean. They include the Great Tohoku earthquake and the 2004 Sumatra earthquake. The Sumatra quake is particularly interesting since there are 5 M8+ events close together on the map: the M9.1, an M8.6 aftershock very close to it which happened a year later, a double M8.2/M8.6 8 years later, which were on the oceanic side of the subduction fault and presumably due to faults there which were stressed by the 2004 event, and finally an M8.7 much further along Sumatra in 2007 which may be due to stress transfer at the edge of the rupture zone of 2004. Seeing that kind of activity, people may almost be happy to live in Alaska instead. In contrast, the Great Tohoku earthquake had no aftershock above M7.
All but one of the 15 M8+ earthquakes since 2000 are on the edges of oceanic plates, and are located in subduction zones. Earthquakes of this size outside of subduction zone are very rare. The outlier was in Peru in 2019, an M8.0 120 km below the Andes. This is still in a subduction zone, but is much further downstream and is far underneath the continent.
Going back further in time, we do find some earthquakes this size which are not related to subduction. The largest ones are all caused by India’s collision with Asia, source of the Himalayas. Three earthquakes of M8.0 or larger occurred in the interior of China and Mongolia, in 1905, 1920 and 1957. Others were in Myanmar in 1946 and in Nepal in 1934. The worst by some margin was the Tibet earthquake of 1950. This event reached M8.6 and was so strong that it caused waves (‘seiches’) on lakes in Norway and England. That was 70 years ago. There were six such great earthquakes in the region between 1900 and 1957. But no comparable continental earthquake has happened here since 1957. It seems eerily quiet. If anything similar were to happen now in China or in the Himalayan nations, it would be an earth-shaking disaster. Subduction zone earthquakes tend to happen out at sea, or at great depth below the continent under which they subduct. This limits the damage they do (leaving tsunamis aside). Intracontinental earthquakes directly attack our cities.
Going back to 1900, it is possible to see which regions are most susceptible to earthquakes of this size. Almost all are along the Pacific ring. The coast from Canada to the Kamchatka has about one every 15 years. The Kuril islands just north of Japan have about the same frequency, but focussed in a much smaller area. North Japan, roughly from Sendai to Hokkaido, has one every 20 years, again in small area of no more than 500 km length. The region from southern Hokkaido to the Kurils has not had such an event since 1900. Tokyo had one in 1923, and the Pacific coast of Osaka had two in 1944 and 1946. Southern Japan has been quiet since. From here to the Philippines tends not have M8 earthquakes, until you get to the southern end of the Philippines where Davao has had three. The entire area of Indonesia is at risk, with about one M8 earthquake per decade. The same island of New Ireland has had three. The Tonga trench is a serial offender with seven. New Zealand is a notable gap: it did have an M8+ in 1855 but nothing since.
On the other side of the Pacific, Southern Mexico to Guatemala have had four, and there is a large concentration from Lima (Peru) to Chile (Santiago) which has one every 7 years. Other areas in the world have few, but not none. Pakistan had an M8.1 in 1945, and a few have occurred in the Atlantic ocean, one between the Azores and Portugal. But most non-Pacific-ring events are along the line from Myanmar to Mongolia.

Alaska in earthquakes
But let’s look at Alaska in more detail. After all, that is where this week’s winning event was. What can we say about the occurrence of large earthquakes in Alaska? Experience says that they are rare: this was the largest one in over 50 years. But it seems that they used to be less rare. Alaska has been rather calm since the major 1964 shock. Is it the calm before the storm?

The plot shows the local earthquakes of M8 or larger, since 1900. The 1964 Prince William Sound earthquake was by far the largest, at a staggering M9.2. There has been no earthquake of M8.0 or larger in Alaska since that time, and only one event (in 1986) along the Aleutian chain which reached M8. It shows how exceptional this week’s earthquake was.
Alaska is under attack by the Pacific ocean and its plate. This has always been true. In a way, Alaska’s entire existence is because of this battle. Te Pacific plate subducts along the Alaskan coast, forming a chain of islands and volcanoes in the process. As the plate sinks, it descends underneath Alaska. The red line shows the subduction fault.
The earthquakes are just on the other side of the trench, following the subducting plate. There is a tendency for the quakes here to be paired: three of the locations show two earthquakes in almost the same location, but far apart in time. Going through the events from left to right on the plot:
 Rat Island. 1906: M8.3, 1965: M8.7. There have been two smaller ones recently, in 2003 (M7.8) and 2014 (M7.9)
Adak. 1957: M8.6, 1986: M8.0. There was an M7.9 in between Rat Island and the Adak quakes, in 1996. In some papers the 1957 earthquake is assigned a size of M9.1.
Unimak. 1946: M8.6 There is a large gap between Adak and Unimak
Perryville. 1938: M8.2, 2021 M8.2. There were an M7.8 in 2020 in the same region, which in hindsight was a foreshock. There was also an M7.6 in the same year, so make that foreshock a double. To the right, there was an M7.9 in 1900 on Kodiak Island.
Prince William Sound. 1964: M9.2. This was a bit further from the subduction fault but clearly part of the same sequence.
These pairings show a pattern. The largest earthquakes (M8+) are repeat offenders, with recurrence times between 30 and 80+ years. In the area of the current quake (Perryville is the nearest settlement) an identical earthquake happened in 1938. In fact, looking at the plot, until this week it was the oldest of the unpaired M8+ earthquakes along the subduction zone. This had been noticed in the past. Already in 1981 there was a paper stating that the repeat period in the area of the current quake was 50 to 90 years. This meant that a large earthquake was expected to happen before 2030. Such a prediction should be used with caution, as determining recurrence times on just two events is very uncertain, but events decided to conform to the expectation, and deliver the earthquake within the range of recurrence time
Energy
Earthquakes of size 8 or larger are called ‘Great’ while an M7 is called ‘Major’. But what does ‘M8’ actually mean, and what is the difference between an ‘M9’ and an ‘M9’?

The magnitude scale of earthquakes can hide how quickly they increase with number. The magnitude is related to the amount of energy that is released in seismic waves. Each 0.1 step in magnitude corresponds to about a 40% increase in energy. A full magnitude increase (from 8.0 to 9.0) is a factor of 30 in energy. That is why an M7.9 can be a foreshock to a M8.2, as it was in this particular case: it releases only 25% of the total energy of both events. The first event left most of the stress intact.
For an M8.2, the total energy in seismic waves is about 1017 J. The 1964 earthquake released 4 x 10¹⁸ J. That was a lot. In an average year, al earthquakes together release around 4 x 10¹⁷ J. Obviously this varies a lot from year to year: the 1964 event released 10 times that much in just one event. But taking this number, we can estimate that this week’s Alaskan event accounts for a quarter of the world’s total seismic energy of 2021. Not bad! Alaska certainly knows how to produce energy, not only the human economy but the ground underneath as well.
To give some indication how much energy this is: the Alaskan quake released about the same as the 1980 Mount St Helens eruption. It was also almost the same energy as the largest nuclear bomb every detonated, but let’s not mention that. Comparing to human activity: Alaska produces around 500,000 barrels of oil per day (declining, because the oil fields are now ‘mature’). Each barrel contains around 6 x 10⁹ J of energy, so oil in Alaska accounts for about 1018 J per year. This week’s great earthquake produced about as much energy in seismic waves as Alaska produces in oil each month. The Earth of course produces a lot more energy itself, mainly from internal radioactivity. Less than 0.1% of the Earth’s energy is used to produce earthquakes. The remaining 99.9% produces geothermal heat, amongst others driving volcanoes. Looking at it in this way, earthquakes are not so bad.
Rupture
 Large earthquakes rupture a large length of fault. This length will now need time to rebuild the stress, for the next earthquake olympics. During the rebuilding, another segment along the fault may rupture. Turkey’s Anatolia fault is a case where the rupture sequence can be followed nicely, with adjacent segments failing one but one, in a sequence heading towards Istanbul. That is a transform fault where a rupture causes movement along the fault and adds significant stress to the next segment. In a subduction fault, the movement is perpendicular to the fault and therefore there is much less (or no) stress transfer to the next segment. Each segment ruptures in its own time, independent of what the neighbour does.
The rupture length depends on the size of the earthquakes. This is why repeating earthquakes may have similar size: they rupture the same length segments. On the other hand, a monster quake such as that of 1964 may rupture a series of segments in one go, thereby inhibiting the usual recurrence of earthquakes there. This regularly happens on the San AndreasVolcano at fault: Neenach and the art of moving mountains where the great earthquakes rupture great lengths of the fault, and do not confine themselves to their own segment. That makes it next to impossible to predict the size or location of the next one.
The plot above shows that the 1964 Prince William Sound event has silenced a large region of he subduction fault, all the way to the current event. Perhaps there was also a long silent period before 1964, which allowed the stress to build up to the level where this earthquake became possible.
How far did the 1964 M9.2 rupture the fault? It is thought to have extended to the western end of Kodiak Island. The length of the ruptured segment can normally be measured from the locations of aftershocks. A plot of the various segments is shown below, taken from Davis et al 1981, Journal of Geophysics Research, Vol 86. It shows the great length of the 1964 rupture, ending only at the segment that ruptured in 1938 and which had not yet build up enough stress to take part in the great quake. The 1938 segment acted as a roadblock and the 1964 rupturing ended there.

1964 is a long time ago. The stress along this section is slowly building up again. It won’t always be this quiet. But nothing like it is on the cards for now, and next time it may rupture in smaller sections, a a series of smaller events. Not small, but smaller.
Future

The plot of the segments contains a few threateningly looking black regions called ‘GAP’. This is not the UK clothing store which did not survive the pandemic, but it indicates areas which have not ruptured for a worryingly time. The one with the big black arrow pointing at it (actually this arrow the plate movement direction) is called the Shumagin gap. To the left of it is a tentative gap, the Unalaska gap. Nowadays, the 1946 eruption is assigned M8.6: it may have ruptured a much larger area than shown in this plot. In fact, the two gaps seem to fit this earthquake rather nicely. The two gaps therefore present a region which last ruptured 75 years ago.
As an aside, the plot from the Davids et al paper assigns a much smaller magnitude of M7.4 to the 1946 earthquake. Their number represents the surface magnitude, and it was estimated from the short duration (20 seconds) and the small aftershock area. The value of M8.6 is the estimated moment magnitude of the earthquake. The large difference is a bit of a mystery. The event generated a large tsunami, which suggest the larger magnitude may be right. A more recent study (Lopez & Local 2006, https://academic.oup.com/gji/article/165/3/835/555752) suggests that the aftershocks had been misplaced in the original measurements, and that a much larger segment ruptured than was thought at the time.
There is also a dark gap on the far left which has not yet been filled in. A fourth gap on the far right along the Canadian coast has been filled since, with a M7.8 in 2012 and a M7.5 in 2013.
Which area ruptured this week? It is clearly seen in the USGS earthquake plot, shown below, which contains the earthquakes following the main shock. The main one is indicated by the large blue star. The aftershocks follow a 150 km section, mainly east of the main event. The area closely agrees with the rupture of the 1938 event. Not only were they the same magnitude, they were also the same size and covered the area. This was a copycat event. I confidently predict that a very similar earthquake will happen in 2104. You read it here first. (It is pretty safe to predict this. No one will remember unless it happens to be correct.)

What about the foreshocks? It turns out, they were just at the western end of the current series of aftershocks. They are the two smaller dark blue stars, with on the right the M7.8 of July 22, 2020, and on the left the M7.6 of Oct 19, 2020. Being smaller, they will have ruptured a smaller section. They went off around the eastern border of the Shumagin gap, or in other words at the edge between the 1938 and presumed 1946 ruptures.
After the July 2020 earthquake, an update to this plot was published (Liu et al. 2020, Geophysical Research Letters, sorry but access is blocked to the public) (I am not sure why scientists publish work where it can’t be read). It is in much prettier colours but with the same dark message that the area of the 1946 earthquake (for which they assume the low magnitude) may be next in line.

We know rather little of earthquakes before 1900. However in the region of this week’s event we know of two major earlier events, accompanied by tsunamis: one in 1847 or 1848, and a double event on July 22, 1788 – the same day as the 2020 event – and Aug 7, 1788. If those are the previous ruptures, it indicates a recurrence time of around 80 years. This would predict that the next event will be around 2018. 2021 is indeed not far off – I wish I had predicted this last week. The 1788 and 1847 event may have ruptured the Shumagin gap as well, in which case it will have a similar recurrence time. The 1946 event would have been 20 years ‘late’. It seems plausible the Shumagin gap will rupture within the next 25 years. The main uncertainty in this is that we do not understand the 1946 earthquake well enough.
Mechanism
What causes these subduction earthquakes? The cause is the Pacific Plate, but the earthquake itself is in the continental plate. The plot below shows the Pacific plate moving from right to left while descending into the deep. The continental plate gets stuck to it by friction, and it is forced to also move to the left. This causes it to buckle, and to be pushed up. At some point the stress gets too much, the friction fails and the lock gives way: the continental plate whips back in place. The movement can be 5-10 meters for large earthquakes.
The Perryville quakes all have a depth around 30 km and occur some 100 km from the trench. As the oceanic place goes deeper, the continental plate gets hotter and more ductile, and is finally replaced by the mantle. Here the friction is much less and so the two don’t get stuck as badly. The earthquakes here are frequent but are very much smaller. The green dots show low frequency earthquakes which are slow-slip events: they occur in this region

A bit deeper the descending rock begins to melt, and the melt starts to percolate up through the continental crust. On the surface a volcano forms. In the case of Perryville, that volcano is Mount Veniaminof, site of a VEI 6 eruption around 1750 BC. Alaska does geology rather well.
Tsunamis
This week’s event generated a tsunami warning. Tsunamis can be caused by large subduction earthquakes and this event was large enough to raise the alarm. However, nothing appeared: the tsunami did not come. Twenty years ago we had become quite complacent about tsunamis. Now, after two disasters with 300,000 dead, we know better and we take warnings seriously. Even science deniers do not deny tsunamis. Large tsunami are often associated with the largest earthquakes (M9) but smaller ones can also cause them. The 1946 tsunami is an example, as the earthquake itself appeared to be relatively small – but the wave wasn’t.
A tsunami is a tidal water wave. The origin is simple: a large displacement of rock or sediment under water displaces the same amount of water, and sets the wave going. The displacement can be caused directly by the earthquake. As mentioned above, the buckling, locked plate gives way and unbuckles itself. If the buckle extends to the surface, then the surface will suddenly drop. Water rushes in to fill the void. Further upstream the plate moves forward, and this pushes the water out of the way. And this happens over the entire length of the rupture.
 The wave of water ripples out, at speeds approaching that of an airplane. In the open ocean the wave may only be centimeters high, but 100 kilometers wide, with a length initially equal to that of the ruptured segment, slowly expanding as it moves out into the ocean. A wave that size is invisible, but contains a lot of water. When approaching the coast, the wave slows down. This makes the wave less wide but it still contains the same amount of water. The wave rises up to compensate. In extreme cases it can reach 10 meters or more. At that point, Lurking’s maxim ‘don’t be there’ applies. And this is what the tsunami warnings attempt to achieve. It gives people a chance.
This particular earthquake apparently did not have much effect: there was no significant tsunami. But this is not known until the wave fails to arrive. This can be annoying, but far worse would be if no warning was given and the tsunami did come.
Many of the great Alaskan earthquakes have caused tsunamis. The 1946, 1957 and 1964 all did, impacting not only Alaska but locations around the Pacific. It seems common. In 1788, a 30 meter high wave was reported (this should be taken with some caution). There has been no significant tsunami in Alaska since 1964. But there had also been no great earthquake since that time. Nothing happened this time – but the next great earthquake remains a tsunami risk.
Final words
There are no final words on earthquakes. They have happened before and will happen again. Some areas of the world have been hit hard: Indonesia and Japan come to mind. Others have had time off. But in a way, that can be more dangerous. They will come again, and people may no longer be sufficiently prepared. This event, large but without damage, was a useful warning sign. The years of quiet may be coming to an end. Other places are more at risk, especially places such as China and Pakistan which similarly have not seen anything on this scale for 50 years or more, but have had them before. After the tsunami warning has passed, the earthquake warning should remain.
Albert, July 2021


Things look, er, different. Cue the n-th discussion about whether the eruption has ended… 🙂
Clearly though something has changed in the system to a new behaviour.
Yes, this doesn’t look convincing! More like another failed attempt. It is running out of gas. But let’s – perhaps it will still find some oomph
Would not be too unlikely, the magma is probably collecting underground somewhere too, which means eruptions in the future are possible but also the magma could go to Krysuvik or Svartsengi too, setting off an eruption there.
I think the rifts are really quite surface level features, below a few km the ground is probably too ductile and the magma forms sills and conduits, and probably also migrates between the systems a lot, same as at Vatnajokull I expect, where Bardarbunga and Grimsvotn are just magma chambers close enough to the surface to go caldera but there are more deeper down too.
The fumes that are wafting from the main crater are starting to reflect a red glow. Me thinks that the lava is slowing finding its way back into crater. Let’s see if the supply is strong enough this time to make it a proper eruption again.
https://www.visir.is/sjonvarp/beint
The visir camera seems to have stopped at 05.25 this morning (5th)
There is smoke in Natthagi where lava joins from above, also at the usual west side location. Is some lava getting out that’s not visible on the cameras?
Can you link the earthquake link ?
Coincidence?
The tremor downward trend started with the eartquake activity at the Reykjanes Ridge 1 August.
Screenshot activity at the Ridge 01 08 00:00 – 02 08 00:00.

Yes coincidence, I expect. The tremor shows another attempt by the cone to break through. This one looks more promising
While observing the red glow from the vent, my wife looked over my shoulder and told me it’s called Fagradalsfjall because of smoking.
Her logic:
Fag = smoking fags (cigarettes), dals = dale, Fjall = hill/fell.
She’s not a Volcano Cafe follower. In fact she might have told me this to shut me up before I ranted on about “red glows and lava flows”. 😀
It’s a tough and lonely life being a volcano observer!
I was wondering: What defines the overpressure in a system like this? So, a volcano like this (fed by rift-filling from quite deep), as it grows in height, will increase the back-pressure into the magma system below due to the hydrostatic pressure of the higher magma column – approximately one atmosphere every three meters of height, I gather. Will this make a difference at some point? Or is the the flow sustained with a fixed flow rate due to some dynamical coupling below, and will build up arbitrarily high (well not really, but at least very large) pressures against anything that creates backpressure?
In other words: Is there a relevant height limit for this type of magma system up to which it can pump lava out of a mountain?
Maybe there is but magma is less dense than solid basalt, and near the surface even less so as it degasses. Fluid pahoehoe like this is not 3000 kg/m3, in a lot of cases more probably it is well under 2000, only a bit more than water. Kilauea lava lake was even less than water at one point I recall, at least at the surface.
Basically the back pressure doesnt really exist. Magma is too buoyant.
Hopefully not running out of gas is Ingenuity 🙂
https://www.jpl.nasa.gov/news/my-favorite-martian-image-helicopter-scouts-ridge-area-for-perseverance
https://mars.nasa.gov/technology/helicopter/status/318/north-by-northwest-for-ingenuitys-11th-flight/
And the first images have arrived from the navcam showing the landing sequence and all looks well. Assuming it landed where it was supposed to, I make Ingenuity almost 800 metres from Perseverance now as the crow, I mean drone, flies 🙂
https://mars.nasa.gov/mars2020/multimedia/raw-images/HNM_0163_0681411025_262ECM_N0110001HELI04395_0000A0J
And the super mappers on twitter have already matched up the navcam images to get the exact landing spot (white dot).
https://twitter.com/65dbNoise/status/1423314106262728704
https://www.youtube.com/watch?v=wNpmJXbcz0s is an interesting interview by a son of his geologist father, Olafur Ingolfsson concerning the question if the Iceland fissure cone is winding down or not?
“..magma……..less dense than solid basalt……even less as it degasses”
This sounds counter intuitive to me as it’s implying that magma becomes less dense as it loses gas? I understand that the gases would be dissolved within the liquid magma (and only become gaseous when the pressure drops sufficiently) but am surprised that that these relatively volatile constituents add to the overall density.
Because when a block of lava foams up due to degassing it expands due to the new gas bubbles that are forming inside. If you look at pictures of the lava crust (GutnTog often photos these) its basically foamed rock. That’s just with the residual gasses left after the degassing in the vent.
I cannot be bothered to do the sums but given the viscosity is apparently similar to warm syrup it will take some time (certainly ~seconds) for the evolved gas bubbles, likely small and evenly dispersed) to meet and join into a physically large bubble, even football-sized. So the ‘bubbles’ we see may not be of gas, but bubbles of highly foamed lava coming up in a gob at considerable speed from a few hundred meters (where Albert assures us is as deep as gas can form), which is quite an effective wide-bore cannon.
PS I suggested before that the pulsing may be due to gas-filled lava filling the top few hundred meters until a critical point happens and it foams to the surface. There is another mechanism which may be having an effect in that the column is acting as a pump ‘sucking’ lava in from depth. Combine the two and there may be two time constants involved. One in refilling lava at depth (as Albert says, trickling through a much of part liquid at depth) and the other in generating gas pumped outpourings. The former may well be quite slow, perhaps days, here’s hoping anyway (for the Iceland economy of course).
Yes, this all sounds plausible, especially your part.
Thanks, so it’s actually magma with the gasses still within it (prior to release) that makes it less dense, that makes sense.
Yes, it is a cliche but magma erupting is literally exactly like opening a bottle of coke after shaking it, the liquid under pressure fits in the container but open it and some CO2 can escape which makes bubbles, and then the liquid doesnt fit anymore. Density obviously goes down too, which in magma will only encourage it to erupt faster.
Probably the only case of back pressure driving an eruption is a lava lake draining, because lava lakes are usually either degassed entirely anyway or if actually deep sourced will do so to the magma chamber over time regardless. In this case the now dense but still very hot and fluid lava will eventually just break into the nearest weak spot.
In practice though only Kilauea and Nyiragongo actually have proven examples of this kind of eruption, the most dangerous of all effusive volcanism.
Tilt at Kilauea is interesting. Not yet of a large scale but it is completely linear upward trend for 3 days now. Before it was going up but seemed a bit inconsistent, like the magma was trying to drain, it almost did start another DI cycle but then this weird trend began. GPS is also showing exponential upward movement at CRIM, it is rusing steeper than it ever did last year and has greatly overcompensated. Seems a pulse of magma is here. Now just to wait for the quake screen to fill with little red dots and lava in about an hour or so
🙂
Pix would be nice….
Yes, it’s getting pretty steep…
(Sorry – being silly) 🙂
HVO deformation page for the tilt and HVO monitoring for the quake map.
On a more serious note. I see this patch of crust in front of the vent has steamed / smoked heavily for quite some days. Through eruptions, through quiet periods.
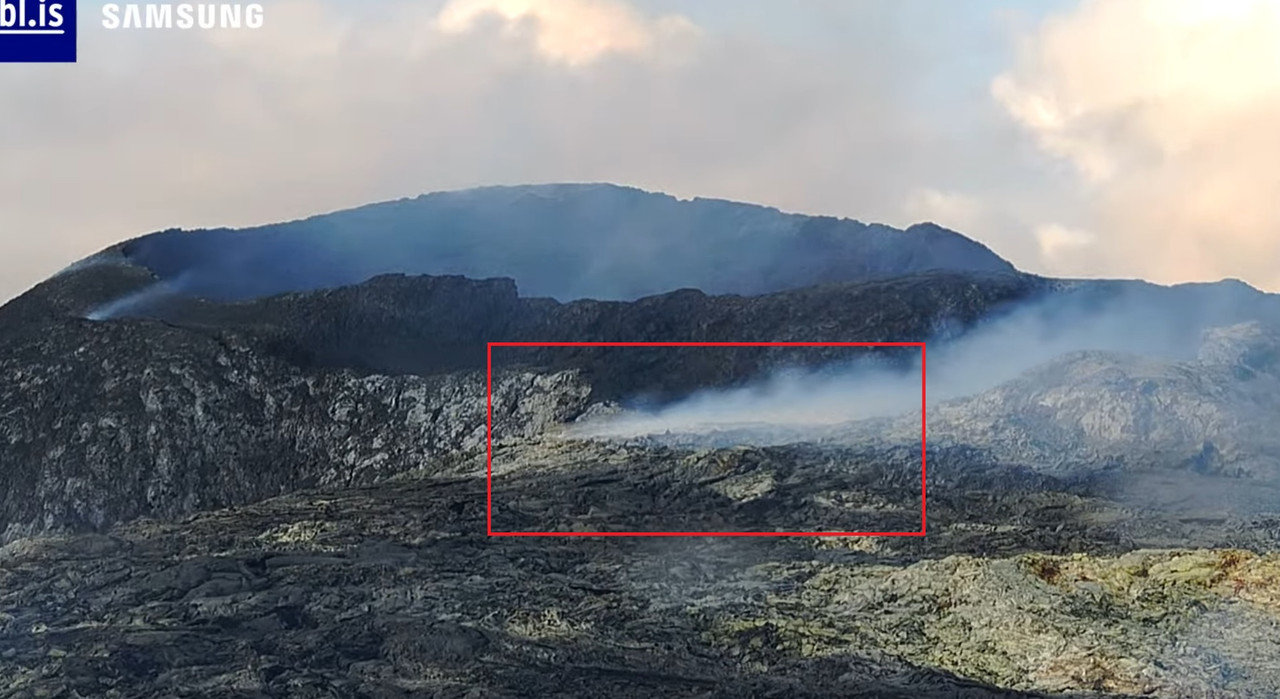
Anyone know why this should be?
More people have been wondering about that. It behaves like a chimney.
I will hazard a guess. If you carefully watch the drone videos, on overflight, there are areas next to the cone which appear to be permeable to the volcano gases, particularly sulfur vapor. I am guessing as we see the ramp up to an eruption that the volatile and hot vapors permeate these zones and thus we see the smoke clouds coming up. There are zones of weakness on the cone itself, particularly the opposite side to the exit, where you can see big cracks or crevices, these appear to be permeable too. I would add that perhaps small cracks in the lava material allows easy penetration of these porous zones.
AVO rang the bell and Pavlof started wagging his tail:
Volcanic Activity Summary: Clear web camera views of Pavlof Volcano this morning indicate episodic low-level ash emissions are occurring. Intermittent bursts of ash from the summit are producing diffuse ash clouds that are rising just above the summit (summit elevation 8261 ft above sea level) and drifting southeast roughly 6 mi before dissipating. Seismic and infrasound data indicate that activity consists of occasional small explosions and tremor. The ash emissions indicate an active eruption in progress thus the Alaska Volcano Observatory is raising the Aviation Color Code and Alert Level to ORANGE/WATCH.
Hm, my last reply got lost. On Chad’s comment:
“Basically the back pressure doesnt really exist. Magma is too buoyant.”
But even if it has a density like water, we are talking dozens of atmospherest, hundreds for a really high volcano. Does that really have no influence on the system below? Particularly if the system is pressurised to some fixed value?
To make a related point: I have always been flummoxed by Lava lakes like in Hawaii, where the level of the lake is constant for months or years, with just a few meters variation, despite the column having been pushed up thousands of feet above sea level. In order to be that constant, the pressure in the column must be very constant and well-defined. Wich in turn would imply that it is very conceivable that any change in backpressure can influence what is below it.
Yes, puzzling (hic).
The system is in equilibrium. As Albert said a year ago (and I did not believe) the system us hydrostatically in balance. That is hot lava has significantly lower density that (mushy) rock. This difference is significant, and when ‘amplified’ by a 20km (or whatever, even a few) column the buoyancy is significant. That’s how lava gets to the surface, lava lakes form etc etc.
When you get gas involved things become more interesting, as we have seen.
I suspect (and will quickly be corrected by Albert) that long-time vents like Hawaii are ‘relatively’ gas poor due to millennia of degassing. Geldingdalir hasn’t erupted for a millennia, time to become filled with gas and have an unstable column.
My 10c worth, anyway.
PS
Looks awfully like ‘beats’ where two frequencies are mixed (think AM radio).
If so then there should be a repeat.
It would be nice to have displayed a long term graphic of the same data over the course of the eruption.
I expect that the main reason that the old lava lake (pre 2018) in Kilauea was quite stable is that it wasn’t a stationary lake. It was an underground lava tunnel feeding the eruption at Pu’u’O’o which had sprung a hole at the top. The pressure in the tube was set by the input pressure, the velocity and the viscosity. As Pu’u’O’o became blocked, pressure in the tube increased and the lava lake rose.
Aah, I see, thanks, that makes sense (for Kilauea at least). Absolutely, if there was some other opening slightly lower somewhere, that would regulate the pressure to vary in a much smaller range.
Of course at that point the amazing aspect about it is the fact that that conduit was not eroded or otherwise changing shape continuously, but stable for so long (Which also led to the amazingly long lava tube system there).
But how about lakes without continuous flow? Even Nyiragongo, while quite variable on long timescales from eruptions, was stable within a few meters for months at a time, and was coming back close to some “default level” after excursions, as if there was some pressure-regulating process. If it is not the column pressure itself regulating the influx somehow, what does it?
That effect actually is much faster than millennia, the old lava lake at Kilauea back in 2011 had a density of about the same as water, but by 2018 was more like 1.5x the density, and lava at Pu’u O’o in that time got to 1.8 x. Probably the base rate of SO2 emission is around what Pu’u O’o was doing before 2008, 1000-2000 t/day. The degassing depth of 1.5 km only really applies under the solid lava it would be potentially a lot deeper under the lake itself.
2018 probably would have had much bigger fountains if the lava lake was not there I expect, that is the one big difference between it and the mid 20th century eruptions.
By referencing density I mean it had degassed over time more than supply could compensate.
I have no idea what you are trying to say. At what point is lava (bulk density 2000-3000kg/m^3) the same as water (1000kg/m^3) unless its in unstable equilibrium and a foam?
Yes the lava is a foam
Wow, would that degassing depth beyond 1.5km be driven by direct degassing (gas rising up)? (That should be extremely viscosity-dependent) or is that due to some exchange (convective or otherwise) over long height ranges within the column? Exchange seems difficult through a long narrow chute.
I suppose if you were ever to manage a circular flow going (two adjacent volcanos coupled laterally?), then you could have very fast gas transport out of very deep magma chambers without magma loss (That cycle would be driven by the expanding gas on the rising channel, and the higher density in the sinking channel) but that I am sure is an *extremely* esoteric volcano architecture 🙂
I would assume simply because the density is lower there is less weight over the magma if there is a lava lake, so deeper degassing, I dont think a complicated mechanism is required.
Different volatiles come out of solution at different depths. CO2 does so very deep. Once a gas, it can rise through the network of small cracks in the rock, too small for the magma, or it can jump ship to dissolve in water and come up with that. There are impermeable layers down there (that is what causes natural gas reservoirs) but volcanic material does not make those. SO2 degasses much higher up but then does the same. Volcanoes produce CO2 all the time, even when inactive, but SO2 is produced only when lava gets close to the surface.
I had forgotten about the density increase at Pu’u’O’o. It was of course related: as the through-flow there decreased, lava sat still for longer, and both degassed and cooled.
The lava lake of Halema’uma’u that existed in Kilauea during 2008-2018 and before 1924, the lava lakes of Ambrym, of Erta Ale, of Masaya, and of Nyiragongo, they are convecting lava lakes, lava is continuously upwelling and downwelling. They cannot build enough gas to burst into a fountain. The conduit is so wide and the lava so fluid that convection currents are created, they carry the magma downward, but the bubbles which are buoyant resist, they try to rise, they coalesce with each other, and are released up amongst bursts or spatter. In videos of lava lakes this can be usually appreciated, that the spattering always happens in the part of the lake where the lava dives down into the conduit. Because of this the lava lake cannot fill with enough bubbles, and thus cannot explode into a lava fountain. In terms of volume lava fountains contain more gas that lava, pumice from high fountains often has as much as 98% vesicularity from the gas, which is called a reticulite.
It is a matter of conduit width. Nyiragongo demonstrated in the years before it drained. Nyiragongo had two vents in the crater, a small one that erupted in cycles with lava fountains, and a big one that contained a permanent lava lake.
The eruptions of Pu’u’o’o and Mauna Ulu also demonstrated this, they both stared with lava fountains but reached a point where they settled into overflowing lava lakes/ponds. The conduits widened over time, Mauna Ulu grew from a 1-4 meters wide, to an enormous shaft 100 meters across in just about a year, this was observed when the magma column dropped during an eruption somewhere else in the volcano, can’t remember if it was at the summit or in the upper rift. The enlarged conduits developed convection.
Yes, we have seen that in several places. Over time the opening widens, the flow becomes a pond overflow, and the fountains get smaller. Halamaumau did this widening too. It formed a crack in 2010 or so, and this slowly became wider and formed the lava lake (pre-Leilani). The deeper conduit was not widening: if it did, the flow rate would have increased. My guess is that it is those same bubbles. They rub and explode against the walls and grind them down. Flowing lava erodes little because of the laminar flow, but air likes turbulence. The alternative would be that the lava melts the rock face but that is much harder to do. Not impossible under the right conditions, but it is much more likely to do the opposite, with a layer of solidified lava plastering the walls. As you can see in the lava benches inside craters. Interesting discussion!
Lava sometimes shows impressive erosion effects. I’m not sure what process is responsible. However stocking clearly plays a role sometimes, the process by which the walls of a conduit become fragmented and detach into the magma/lava. The Halema’uma’u lava lake was observed to grow like this, it was born by collapsing the ground, not as a fissure like in most other eruptions of Kilauea, the walls frequently crumbled down in rock falls, they were perhaps affected by changes in temperature, and pressure, as well as the weathering effects of the sulphur dioxide. The gas explosions may have also damaged the walls.
The 1823 eruption of Kilauea which created 20 meter wide subterranean passages running over a length of many kilometres, presumably through some sort of erosion, erupted fragments of rock coated in lava, lava balls they were called.
It is also interesting to note that when the lava lake of Halema’uma’u was formed in 2008 it did so in the wall of Halema’uma’u Crater, in an area that contained rubble and other loose material from the collapse of 1924. The centre of the crater contained a thick fill of solid lava instead, so did it form at the wall by coincidence, or because that was the only part that was weak enough for the conduit to “devour”? As far as I can recall all circulating lava lakes have been born within pre-existing pit craters. For example the lava lake of Nyiragongo was formed a few months after its 2002 eruption and collapse, and it was born in the bottom of the crater created, made of fragmented material.
There are other ways that lava might erode though. Long-lived lava tubes sometimes carve small meanders and cascades into the rock. And as you say turbulent flow of gas through magma, during fountains or spattering, could also result in some erosive effect.
Probably the only reason the lava lake at Halemaumau formed was because lava could flow out at Pu’u O’o. If it was the only vent it would have overflowed immediately and probably by now constructed a new summit shield. That is what I thought would happen anyway, eventually the rift would freeze up and stop erupting and Halemaumau would become the new summit, of course saying that now seems silly as we know more about how Kilauea works and that was probably never going to happen.
It is interesting to watch today, to see Halemaumau not hindered by a magma drain.
RE: “If it was the only vent it would have overflowed immediately and probably by now constructed a new summit shield.”
Wow!!…and, from my memory at least, goodbye to everything presently up there. Visitor’s Center, Jaggar Observatory, Volcano House, Volcano Village and who knows what else.
I expect that the height of the cone will make a difference. There is enough buoyancy to let the magma rise. How far it rises depends on the density contrast between the rock and the magma. If that is sufficient to rise to 100 meter above the ground (say), then building a 150 meter cone at that point will cause a problem. That seems to be the current situation. Bubble formation will make the magma more buoyant and that is what we have been seeing in episodes: it gives overflow. Why did the eruption interrupt for so long, with several failed attempts to restart? I wonder whether the conduit was plugged by a collapse and the magma has difficulty getting through that. But there may other reasons. It does seem like another attempt at restarting is now underway, and lava seems just have returned in the cone, though still far from overflowing. The eruption is in danger of cutting itself off. I will be surprised if it is still on-going by autumn. But this eruption has surprised me a lot.
Lava just spattered above the cone. Eruption resuscitation in progress
I noticed the tremor on the drumplot was back, but I missed the spatter.
OK, so that was also a bit my picture – but if the underground pressures driven by the tectonic motion (either statically from stress pressure, or dynamically due to inertia of motion) are orders of magnitude higher than this, then it would be irrelevant.
I guess putting everything toegether a vent of very low-density lava could in fact extinguish itself by first increasing the pressure due to a growing cone structure, and then, once the flow is low enough for degassing to become significant, it could increase the backpressure further by degassing the upper part of the column, increasing the density. According to Chad’s numbers, this latter process could in fact be the dominant process, if the magma is gas-rich, and the degassing process reaches far enough down (which is again easier for lower flow rates).
Is there any way at all to estimate if the Fagradalsfjall volcano is *on average* emitting more gas than what is contained in the (average) 11 m^3/s lava flow volume? (It would appear to be hard to get anywhere close to the required precision of both relevant numbers)
By definition the magma has only just enough system pressure to erupt onto the surface. otherwise it would come in a constant and ever-increasing flood. I think that is the lesson, despite appearances volcanoes only just have enough pressure/energy to erupt. The fact that it seems to be considered that a 10% eruption of available magma is about as much as most can manage.
So I agree with Albert that even a poxy 150m cone, compared to 20,km of buoyant feeder tube sounds not much, but at the limit it has a big effect on flowrates.
Given the magma erupting has a higher temperature than the rock surrounding the feeder tube, it seems to me inevitable that it occasionally sags into the feeder disturbing and even blocking the flow. By the same argument its really a high viscosity liquid and seems to be relatively easy to clear out if pressure builds.
I for one am making no predictions because this volcano is playing with us.
…and we have a flow starting up.
(Since I am logged in anyway – I might as well take over the live commentary for once 🙂
It seems to be fairly consistently starting to spew whenever the faf 2-4Hz band level reaches pretty exactly 5000. A truly well-calibrated volcano 🙂
It would appear the recent Maresdalir outflow from the vent has been interrupted by a breakout sending lava back into the upper valley – running along to the right of “Theatre Hill”. The outflow from the vent looks a bit of an indecisive mess!
Substantially more tremor at Taal yesterday, there was a brief but substantial uptick in LF earthquakes. More interesting still is the lack of a substantial steam plume, despite the unrest continuing to escalate, I have brought this up before but how likely is it that Taal is plugged?
Maybe the lake in the crater has boiled off? If there is a ring dike as proposed that is a lot of magma at a shallow level, maybe the heat has driven the water off. I dont think Taal is the sort of volcano that typically can plug itself, not viscous enough. It really is impossible to say though, unless it does blow up, but it might do that anyway with so much water around.
We’ll see how it goes but I am interested in what’s keeping all that magma from erupting.
The drainage into the dike from last year, the activity now is not pressure driven actually the opposite. Pressurised basaltic volcanoes are not explosive, not on a large scale anyway. High pressure means magma will be trying to erupt everywhere and will be hot fluid lava, even at Taal this is the case, though historical examples are not common because it is so wet. It is notable most if not all major basaltic explosive eruptions are associated with a caldera formation. I would guess that a ring dike exposed to the surface is the primary factor, as well as repeated collapses to keep pressure on the magma, and we know these collapses are prolonged and episodic. The eruption of 1756 sounds exactly like this to me.
If there is a plug then only pressure will be able to make it erupt, that is a few decades out, that is good for those who live near it but maybe not so good for you 🙂
Kilauea had a sizable swarm of quakes today, 53 recorded on the database in the last day and all in the magma system.
https://imgur.com/a/rvqr9HM
This swarm shows pressure in the system, it is getting very close to breaking. Based on the pattern of quakes it is most likely an eruption in Halemaumau again although maybe not the same place as last year, perhaps this time more southwest, or along the south side near the ring fault.
It also looks like the side of the cone facing Geldingadalir is quite at risk now, I suspect we will see a future flank breakout there, which is going to really change up the flow field a lot.
It looks like there’s lava overflowing from the cone again, but it’s really rather hard to see. Would someone who’s planning on visiting the eruption site anyway mind bringing a towel with them and giving the mbl cam a good wipe as they pass by it?
https://m.youtube.com/watch?v=wWXWqbEmWXE&fbclid=IwAR3Js2D9fmekYfJ7qZPP3rxQ9rYeoZfIq7rFSbAMXfifBha5KcxXETtYqJo
Live Webcam ..
The Iceland eruption continues at great speeds
I think this eruption will last decades
Jesper,
That pretty well guarantees it will stop tomorrow …….
New post is up! Dishing the dirt on the north
https://www.volcanocafe.org/volcanoes-of-the-north-the-fire-in-the-ice/