After the recent developments of Iwo-Jima volcano, I’ve grown interested in whether submarine calderas are capable, or not, of producing substantial stratospheric sulfur injections, also in the effects and frequency of these injections, and eventually, as one thing led to another, in the identity of the eruptions behind them.
Large volcanic explosions emit vast amounts of sulfur dioxide gas into the higher levels of the atmosphere. The SO2 then reacts with water and oxygen to form sulfate, light colored particles that reflect sunlight back into space, which can cool the atmosphere and disrupt atmospheric circulation patterns. The most famous example was the eruption of Tambora in 1815, which triggered the so-called “year without a summer”. In the US, following the Tambora eruption, a persistent “dry fog” was observed, which reddened and dimmed sunlight. This was the volcanic sulfate veil of Tambora.
The 1815 eruption was one of the three largest volcanic sulfate spikes recorded in polar ice during the last 1,000 years. Volcanic sulfate precipitates down to the surface and can be recorded in ice cores, obtained by drilling into thick accumulations of ice, mainly in the polar regions. Some aspects of the sulfate spikes can be used to infer the eruptions that caused them, most importantly, the size, with the amount of volcanic sulfate being roughly proportional to the eruption size. There’s also the partitioning of the signal between the poles, which indicates roughly the latitude of the eruption. For example, eruptions in tropical latitudes are found in both poles, while eruptions from mid-latitudes are often only found or are far more intense in that hemisphere’s pole. I was, however, interested in finding whether there could be other clues gathered from the characteristics of the spike, mainly its chemical signature, with the objective of finding out if a submarine caldera may have been behind.
There are, in fact, many submarine calderas that collapse explosively, often in shallow waters. For example, in the submarine Tonga-Kermadec arc, almost every volcano can be considered a caldera system, and there are about 70 volcanoes in it, one of the longest ones in the world. Particularly, the northern Tonga calderas form colossal volcanic edifices constructed in the last few million years (starting after the Lau Basin formation) and seem almost entirely built of submarine pyroclastic turbidity currents during caldera collapses. A similar thing can probably be said for the Izu-Bonin arc, and to a lesser extent, the Marianas and South Sandwich Islands. Submarine calderas are also somewhat smaller than the ones found on thick continental crust, so while their eruptions are smaller, they are also more frequent, and if they are indeed capable of injecting sulfur into the stratosphere from depths of a few hundred meters underwater, then it’s likely a lot of volcanic sulfate spikes of the poles come from submarine volcanoes. So I was particularly interested in seeing if some characteristic in polar ice cores could reflect the nature of the eruption (a submarine eruption being very different in terms of plume chemistry…) and also to find additional criteria/s to sort the spikes into their origin eruptions. I wouldn’t have had any luck with this effort if it weren’t for the data from the SPC14.
SPC14 is an ice core extracted from the exact location of the South Pole. Located at high elevations of nearly 3000 m, far from the oceans that are an alternate source of aerosols, and also probably with little seasonal weather variation, its data has proven particularly useful due to the quality of the data compared to noisier ice cores. It also came with a second, unexpected volcanic chemical signature that was exactly what I was looking for.
The data I’m working with comes from Dominic A. Winski, 2021, available from: https://www.usap-dc.org/view/dataset/601851
I’ve noticed three things that might be useful, which are:
Duration: The volcanic sulfate spikes related to caldera-forming events seem to always have a very similar duration. Whether it’s Cosigüina or Tambora, almost all of these obvious sulfur injections last between 2.5 and 3.5 years, regardless of the massive differences in size. So, as far as I’ve seen, the duration of the signal doesn’t seem related to the size, but it’s probably just the time that the aerosol cloud takes to fall through the atmosphere. Eruptions with an intensity similar to Pinatubo or higher, likely reach a similar range in altitude, most likely about 30-40 km above sea level, and take a similar time for their veil to be removed downwards. This duration can help spot the more significant events and distinguish them from background noise or small near-pole eruptions, which is particularly easy for the SPC14, but also works for all ice cores that have enough time resolution. There are also four sulfate spikes (since 1000 AD) that lasted 4-4.5 years, and I have reason to suspect that these were from basaltic-andesite melt eruptions, which, due to their high temperatures, sustained unusually tall plumes. One of these long spikes is a historically documented basaltic andesite eruption, and two other events have basaltic andesite eruptions as their most likely candidates based on timing/size.
Time to peak: The time it takes from the onset of the signal to the peak seems to be related to the distance to the volcano, particularly I’ve seen that pre-1000 AD eruptions from the South Sandwich Islands, near Antarctica, (notably the Vostok tephra of Candlemas Island) have very impulsive onsets rising to an immediate peak, seemingly faster than the core resolution itself. So this can help know the latitude of the eruption, as long as atmospheric circulation patterns remain consistent for a certain period, which seems to change over time. However, I’m still not too sure how reliable this is, and if it is, it’s probably only reliable for most of the time in the SPC14 core, which captures very well the shape of the sulfate signals.
Nitrate drops: Every clear sulfate spike I’ve seen in the SPC14 for the 1000-1900 AD period has a clear, and rather surprising, drop in nitrate concentration (another atmospheric aerosol). Not only that, but this seems to be a clue that can distinguish submarine from subaerial eruptions. I noticed that, in the South Pole, the sulfate signal of the 1815 Tambora eruption (subaerial) is more than twice that of Krakatau in 1883 (submarine), yet the Krakatau eruption has a nitrate drop that is twice the size of Tambora. This is promising in that there might be a way to tell apart submarine eruptions by their large nitrate throughs, but why does this happen? Well, I’ve only noticed this chemical signature in the South Pole. I’m pretty sure these drops are not present in Greenland, and if they’re present in the WAIS core near the coast of Antarctica, they’re too weak to distinguish them from the abundant noise of background nitrate variations that this core has. Nitrate can be broken down by UV light through photolysis, and volcanic eruptions have been speculated to reduce stratospheric ozone due to the injections of volcanic chlorine (which initiates reactions that deplete ozone). So I think that volcanic eruptions (more specifically, their chlorine) can produce or enlarge an ozone hole over Antarctica, which in turn destroys nitrate, causing the evident drops in its concentration on the South Pole core. The chlorine gas itself never seems to make it into the ice, even though magma has about as much chlorine as it has sulfur, probably because it remains in gaseous form after being ejected. When lava vaporizes seawater, it produces plumes of hydrogen chloride gas, potentially injecting massive amounts of chlorine into the stratosphere, maybe explaining the large low nitrate anomaly of Krakatau, and maybe being a reliable sign of submarine caldera eruptions. The subaerial Samalas eruption also has a large nitrate drop, though, maybe due to its enormous size, and possibly high magma chlorine content. Water in volcanic plumes could also have something to do with this, though

The 13th century was a very volcanically active century, characterized by the large nitrate drops of some of the volcanic eruptions, with probably as many as three major submarine eruptions this century. Blue is the sulfate concentration and orange the nitrate concentration in the SPC14.
With this said, I will try to link volcanic sulfate spikes to their origin eruptions. Originally, I was going to do a list of eruptions from 1000 AD to 1900 AD, but, because it was growing too long, I had to split the article, and I will only do the eruptions since the year 1500 to 1900.
The eruptions I will list below all have sulfate spike durations of more than 2.5 years (except for two that are just below this duration, but I considered them significant enough to include). In Greenland, they can be correlated between multiple cores, and in Antarctica between the WAIS and SPC14 cores, or have very clear nitrate drops in SPC14. The date is from the WAIS core, which likely has a better annual counting chronology than SPC14. I consider any spike where nitrate reduction (ppb) multiplied by time (years) gives >30 to be a large nitrate drop. I also give the estimated stratospheric sulfur injection from the Holocene volcanic sulfate compilation by Michael Sigl et al., 2020, in Tg (millions of tonnes).
Shorter than 2.5-year volcanic signals are also found in ice cores, particularly in Greenland. Some of these come from explosive eruptions in Iceland, from Oreafajökull and maybe Hekla. Others likely originate from VEI 5 eruptions, for example, spikes in 1646 and 1762 likely match large, deadly explosive eruptions of Makian volcano (Indonesia), which, to have been recorded all the way in Greenland, must have been larger than previously thought, maybe VEI 5 events. So are also the VEI 5 eruptions of Taal (Philippines) in 1754 and Tarumae (Japan) in 1667 found in Greenland ice. Effusive Icelandic eruptions can also be seen in Greenland, for example, those of 1477 and 1783 correspond to the fissure eruptions of Veidivötn and Lakagigar, respectively. In fact, Lakagigar is the strongest amplitude sulfate spike in Greenland for the past 1000 years, but it only lasts for ~1.5 years. A different case is that of a well-defined 5-year Greenland sulfate deposition with a distinctive plateau shape, from 1115 to 1121 AD, which I think is probably the Hallmundarhraun shield eruption, a 9 km3 eruption that took place near Langjökull. If so, the eruption rates during this shield eruption were much higher than I expected, 60 m3/s on average, making monogenetic shield eruptions in general more impactful in terms of gas emissions than I thought, but still an order of magnitude below Lakagigar in terms of intensity. These short spikes are not included since it’s hard to identify them and are probably mostly weaker eruptions from mid-high latitudes in NH.
Largest explosive eruptions 1500-1900 AD
1883, Krakatau (Indonesia), 9.1 Tg of S.
At 19 km3 DRE (dense rock equivalent) and 48 km3 bulk volume of dacite, the 1883 Krakatau eruption is the largest volcanic event for which we have detailed historical records. Despite the size, the sulfate spike was quite modest, so, with the majority of the eruption likely taking place underwater, the sea may have absorbed a substantial portion of the volcanic SO2. The large nitrate drop in SPC14 is perhaps a result of HCl gas produced when seawater was vaporized by the eruption (or alternatively, the water plume).
The eruption started on May 20 with subplinian/plinian activity followed by the effusion of an obsidian lava dome from Perboewatan volcano. Activity calmed down until late June, when the eruption intensified and two vents had become active. By August 11, there were 3 major ash plumes rising from Perboewatan and Danan cones, and many other locations were issuing steam. Just after midday, Aug 26, a major plinian eruption started with ash quickly rising to 27 km in height. During the next morning, strong detonations cracked walls, blew away plaster, and shattered glass in places like Bogor or Jakarta, 160 km from the volcano. Artillery-like sounds were so frequent that almost no one in western Java could sleep that night. At 10 AM came the last and most destructive event, probably the ignimbrite phase of the eruption, when a powerful explosion generated a pressure wave recorded all across the globe, multiple times, as it circled the planet. Around 10 AM, pyroclastic density currents travelled 40 km across the Sunda Strait, killing 2000 people on the nearest coasts of Sumatra (even 400 m above sea level), and a tsunami, likely triggered by the PDCs displacing the sea, devastated the Sunda Strait with run-ups of 50 m. The 10 AM explosion quickly formed a massive umbrella that, within 15 min had darkened the sky in Bogor (160 km upwind), forcing people to light up lamps, which was later followed by the fall of accretionary lapilli, a sort of volcanic hail formed from concentric layers of ash.

Photo of Perboewatan cone (northern end of Krakatau island) erupting on 27 May 1883 (from Volcanological Survey of Indonesia, 1883).
1835, Cosigüina (Nicaragua), 5.6 Tg of S.
The Cosigüina eruption in 1835 is another powerful historically recorded eruption. It’s visible as a small-sized sulfate peak and small nitrate drop in the SPC14 core. It started on January 20 and climaxed on the 23rd. Explosions were heard 1650 km away in Jamaica, Venezuela, and Colombia. It’s estimated to have erupted 6 km3 of material, and the caldera size would suggest about 2-4 km3 DRE. The eruption started with dacite and andesite magma with less than 10 % phenocrystals, followed by andesite with medium-high crystal contents (15-30 %).
A description of the eruption from Isla del Tigre (30 km away):
“Having gone out to investigate the cause, we saw with admiration that from the coast of Chinandega a mass rose, whose
beautiful and enormous configuration amused and frightened us at the same time (…) We had a scant light that began at four in the afternoon and ended at six, but while the rain calmed, thunder, and tremors continued. Until two in the morning of the twenty-third, when suddenly we heard a rumble so enormous that it cannot be compared to anything, followed by a very loud noise similar to the rushing of a great river as it flows between crags and rocks.”

Cosigüina. Photo by Jamie Incer: https://volcano.si.edu/gallery/ShowImage.cfm?photo=GVP-04083
1831, Zavaritskii (Kuril Volcanic Arc, Russia), 18 Tg of S
This was a mystery eruption until recently; it was surprising that such a recent colossal eruption hadn’t been found among historical records. Turns out the answer is that the eruption came from a remote uninhabited island of the Kuriles. A recent article (William Hutchison et al. 2024) has matched the spike to the Zavaritskii volcano in the Kuril Volcanic Arc through radiocarbon dating and identification of tephra in the ice. Due to its northern location (46º north), this event is not visible in the SPC14 core, at least not clearly, though it might be visible in other Antarctic cores. The caldera size, the smallest of three calderas nested within each other, suggests around 3.5-7 km3 DRE (VEI 6 likely). The melt (glass) composition of the eruption is andesite-dacite.

Zavaritskii in Google Earth
1815, Tambora (Indonesia), 37 Tg of S.
The Tambora eruption of 1815 is the second-largest sulfate spike of the last 1000 years in the SPC14 core (which may have particularly good quality information, given the lack of noise), also being a medium-sized nitrate drop. In this core, the sulfate signal is nearly identical in size to the slightly larger 1257 spike, and also very similar to the 1457-58 one, the three of them being almost twice as large as the next largest sulfate peak of the past 1000 years. Tambora is estimated to have erupted 40 km3 DRE, and 110 km3 bulk. The magma erupted was between trachyandesite and tephriphonolite composition, with usually under 15% crystal content, which is a very unusual strongly alkaline chemistry for a volcanic arc. With only 55 to 57 wt% SiO2, the magma may have been relatively fluid too.
Some minor eruptive activity had already happened in 1812, then on 5 April 1815, a major plinian eruption occurred, explosions were heard to 1400 km, and weaker activity continued until the main eruption of April 10, when the detonations were in turn heard as far as 3300 km away, in Thailand.
Below is an account of the April 10 eruption from Sanggar (distant 35 km from Tambora). The whirlwind described was likely generated by the hot co-ignimbrite cloud rising into the air. Sanggar was 5 km away from the edge of the ignimbrites but was probably affected by the air currents generated when the hot PDCs mixed with the surrounding air, maybe even firenados:
“About seven, P.M. on the 10th of April, three distinct columns of flame burst forth, near the top of Tambora mountain, all of them apparently within the verge of the crater; and after ascending separately to a very great height, their tops united in the air in a troubled confused manner. In a short time the whole mountain next Sanngar appeared like a body of liquid fire extending itself in every direction.
The fire and columns of flame continued to rage with unabated fury, until the darkness caused by the quantity of falling matter obscured it at about eight, P.M. Stones at this time fell very thick at Sanngar ; some of them as large as two fists, but generally not larger than walnuts. Between nine and ten, P.M. ashes began to fall, and soon after a violent whirlwind ensued, which blew down nearly every house in the village of Sanngar, carrying the tops and light parts along with it. In the part of Sanggar adjoining Tambora, its effects were much more violent, tearing up by the roots the largest trees, and carrying them into the air, together with men, houses, cattle, and whatever else came within its influence (this will account for the immense number of floating trees seen at sea). The sea rose nearly twelve feet higher than it had ever been known to be before, and completely spoiled the only small spots of rice-lands in Sanngar, sweeping away houses and everything within its reach.
The whirlwind lasted about an hour. No explosions were heard till the whirlwind had ceased, at about eleven, A.M. From midnight till the evening of the 11th, they continued without intermission; after that, their violence moderated, and they were only heard at intervals; but the explosions did not cease entirely until the 15th of July”
The description seems to speak of an eruption coming from multiple sides of the caldera in a two-hour-long plinian, with pyroclastic density currents sweeping down the mountain and a rain of lapilli. Then maybe 1 hour of transition when coignimbrite ash from increasingly large PDCs started to rain and 1 hour of a climactic ignimbrite phase when PDCs poured into the sea around the peninsula, carrying with them the trees that covered the flanks of Tambora, generating tsunamis and firenadoes/hurricane winds, and during which the vast amount of pyroclastic material in the atmosphere around the volcano likely absorbed the sound of the explosions.

Mount Tambora
1808, Agrigan (Mariana Islands, US)? 17 Tg of S
Paradoxically, this eruption is quite recent but has proven the hardest to assign. The peak was just under 2.5 years in duration in the SPC14 core, but I’ve included it anyway, given the large size. There are several “clues” regarding this eruption. First, this spike, despite being the 8th largest of the 1000-1900 AD period in the SPC14 core, has only a medium-sized nitrate drop. Second is that we don’t know where it happened, which is quite difficult for an eruption as recent as 1808, and this means the location was extremely remote. Third, the aerosol cloud was first spotted on December 11 in Colombia, which suggested a date of 4 December plus/minus 7 days for the eruption, and a location in the tropics (also supported by the sulfate being present roughly equally in both poles). And last, there was a small tsunami in Japan at 2 AM in the morning of December 4 that struck the Kii Peninsula and southern coast of Shikoku (thanks to questionable in Discord for digging up this previously overlooked tsunami). It was small, 2-3 m run-ups, there’s no known earthquake that caused it, and, given the date, it was most likely a volcanic tsunami related to the 1808 event (either a meteotsunami from a pressure wave or one caused by PDCs displacing sea water).

1694, Long Island (Papua New Guinea), 18 Tg of S
The 1694 event is the 6th largest sulfate spike, and a medium-sized nitrate drop, in the SPC14 core, it also stands out because the sulfate peak is remarkably long-lived in both the WAIS and SPC14 cores, lasting 4.4 years. There have been previous suggestions that this spike corresponds to the Tibito Tephra of Long Island.
Oral histories in Papua New Guinea speak of a “taim tudak” (time of darkness) when sand fell from the sky, crops were ruined, a few houses collapsed and people died. The tephra layer responsible for this time of darkness has been called the Tibito Tephra, and is a >10 km3 tephra airfall deposit originating from Long Island. There is also an ignimbrite in the island (the Matapun Beds) formed during this eruption, of unknown volume, but that mostly must have ended underwater. The melt (glass) composition of the Tibito Tephra is basaltic andesite with 55-57 wt% SiO2, which is quite mafic.
There is a problem with the radiocarbon dates (of carbonized logs in the ignimbrite), the average of which give a most likely calibrated range of 1631-1684 AD, but the only spike here, 1641, is already taken by a known historical eruption, and with no clear SPC14 volcanic spikes in the 18th century and the ones around 1580-1600 taken by known historical eruptions, that leaves only two events, 1620-21 and 1694 close to the radiocarbon determination. I think that the 1620 spike (one of the smallest clear volcanic signals in SPC14) is too tiny for Long Island, however, and also that radiocarbon ages overestimating the age is more likely than them underestimating the age. The overestimation could be due to most of the dated logs having carbon that is a few decades older. I cannot fully rule out Long Island being the 1808 event, given that the radiocarbon ages also graze the calibration curve around 1800 AD, and when using the south hemisphere calibration curve, SHCal20, the 1808 spike is actually closer to the radiocarbon ages (they are slightly closer to 1694 if using the north hemisphere curve), and also because there are oral stories that given the number of generations counted since the eruption suggest that it happened in the 18th century. But there is paleomagnetic evidence in lake sediments that suggest the Tibito Tephra is pre-1700 AD and historical evidence that if it was as late as 1808 the eruption changes would have been noticed by passing ships, which seems to rule out 1808.
Overall, 1694 seems like a good fitting spike. The collapse was probably relatively shallow, around 400 m deep, taking the lowest part of the rim and assuming no filling since, but this is still 30 km3 DRE given the enormous area of the caldera, so 1694 being one of the larger signals would fit the Long Island eruption. And still the volcano might have needed to be relatively degassed (maybe due to being a mafic volcano that might release gas from the magma more easily). The basaltic andesite melt I think, also explains the length of the sulfur spike from strong buoyant plumes, fed by hot mafic magma during the ignimbrite phase, reaching particularly high into the atmosphere.
There is one last problem, and it’s that there is a description of flourishing trees in 1700 AD:
“The 31st in the Forenoon we shot in between 2 Islands, lying about 4 Leagues asunder; with intention to pass between them. The southernmost is a long Island, with a high hill at each End; this I named Long Island. The Northernmost is a round high Island towering up with several heads or tops, something resembling a crown; This I named Crown-Isle, from its form. Both these islands appeared very pleasant, having spots of green savannahs mixt among the Wood-land: The trees appeared very green and flourishing, and some of them looked white and full of Blossoms.”
I should say however, that this description refers to the NW (the direction of Crown Island), and, on this side, Long Island has a tall mountain ridge, Mt Reaumur, that towers nearly 1 km over the lowest parts of the caldera rim and probably protected some of the forests on this flank. Also, maybe the areas of savannah refer to parts of the islands devastated by pyroclastic flows that, at the time, six years after the eruption, were only covered with green grass; otherwise, the land in this part of the world seems to be always covered in lush rainforest.

View of the last ignimbrite of Long Island, the Matapun Beds, beginning about 4 m above the geologists. Long Island had a major collapse shortly before the start of the Holocene, and three smaller caldera-forming eruptions during the Holocene, it’s a mafic caldera system that often erupts from two submarine rift zones extending north and south of the island. Photo by Russell Blong: https://volcano.si.edu/gallery/ShowImage.cfm?photo=GVP-00454
1641, Mélébingóy (Philippines), 22 Tg of S
The 1641 event is a recorded eruption of the Mélébingóy (Parker) volcano in the Philippines. Both the sulfate spike and nitrate drop are small in the SPC14 core. The eruption formed vast aprons of pyroclastic flows and associated lahars reaching more than 20 km from the volcano. Judging from the caldera size, the event was likely around 3-5.5 km3 DRE. The erupted lava is crystal-rich dacite, with 30-40 wt% phenocrysts, which is the same magma as the Pinatubo volcano, and overall the volcano looks very similar to Pinatubo. Description from Zamboanga (300 km away from Parker):
“On January 3rd, at 7 PM we suddenly heard some noise about 1/2 league distant, which created some concern in Zamboanga. It sounded like musketry and artillery… On the following day, January 4th by 9 AM the (supposed) artillery fire increased to such an extent that it was feared that the squadron (sent to investigate) might have run into some Dutch galleons. It lasted for about half an hour. People soon became convinced, however, that the noise originated from a volcano which had opened up, because by noon, we saw a great darkness approaching from the south which gradually spread over the entire hemisphere… By 1 PM we found ourselves in total night and at 2 PM in such profound darkness that we could not see our hands before our eyes.”
During the climactic phase of the eruption, explosions were heard as far as 2000 km away, in Cambodia.

Caldera of Mélébingóy filled with a lake. By Noriah Jane Lambayan (https://commons.wikimedia.org/wiki/File:Lake_Holon.jpg)
1620-21, Billy Mitchell (Papua New Guinea)?, 1.8 Tg of S
The 1620-21 signal shows in the SPC14 core as a sulfate peak and nitrate low, both small, and is probably tropical, given the time it takes to peak. The radiocarbon uncalibrated age given by GVP for the youngest Billy Mitchell eruption calibrates to the period 1455-1629 AD. It was a large dacitic eruption with tephra fall and ignimbrite deposits, estimated at 13.5 km3. The caldera suggests 2.2-4.5 km3 DRE, which in its upper range fits the bulk volume. Because I haven’t seen any other “available” spikes in this period, Billy Mitchell is probably the 1621 signal. There is a supposedly larger sulfur yield from a 1585 signal, but because this signal is 20 times stronger in Greenland than Antarctica (I haven’t found it to be a clear event in the SPC14 core either), and it’s a bit short-lived (2.2 years), the 1585 eruption is more likely to come from some northern hemisphere mid-latitude VEI 5; perhaps the Half Cone eruption of Aniakchak volcano, which happened around this time.

The Billy Mitchell volcano, with Bagana (right) and Reini (left) in the background. https://volcano.si.edu/volcano.cfm?vn=255020
1600, Huaynaputina (Peru), 17 Tg of S
The recorded 1600 Huaynaputina eruption shows as medium-sized sulfate and nitrate signals in the south pole. The eruption lasted from February 19 to March 20 with multiple phases of plinian eruption, vulcanian explosions, and pyroclastic density currents. Estimates vary from 4.6 to 11 km3 DRE and 11 to 26 km3 bulk volume. The eruption involved dacite magmas first with medium crystal contents (17-20 %), followed by higher crystal contents (25-35 %).

Looking into the crater. Source: http://ovs.igp.gob.pe/volcan-huaynaputina
1593, Raung (Indonesia), 9.5 Tg of S
A volcanic signal in 1593 shows in the SPC14 core as medium-sized sulfate and nitrate signals. It’s also a remarkably long-lived sulfate peak lasting ~4 years. A massive 1583 eruption of Mount Raung is described by Portuguese chronicles, though it has not received proper attention until quite recently (Firman Sauqi Nur Sabila et al. 2024). The eruption started with a small amount of dacite and andesite, followed by the main phase of the eruption, which produced basaltic-trachyandesite with pyroclastic density currents that travelled 30 km from the volcano. Brick houses have been found buried in the scoria deposits from the eruption, and it is thought that this event may have wiped out several settlements to the west of Raung. The summit caldera likely formed at this time and suggests a volume of 1.5-3 km3 DRE, while the mafic composition of most of the eruption may have generated a very strong thermal updraft high up into the stratosphere or even mesosphere that explains the unusually long 4-year duration of the volcanic sulfate in the atmosphere.
A description from Panarukan, 50 km north of Raung:
“In 1593, a terrible event occurred, which is worth remembering. The incident occurred at the top of a mountain that contains sulfur. The mountain exploded with such a huge roar that it really scared everyone in Panarukan City. For eight days, nothing was seen except roars and fiery fountains erupting from the top of the mountain, which is called ‘Mount of Panarukan’, and it rained for those eight days so much ash—I mean, so much ash fell from the air, blanketing the fields, streets, squares, public places, and roofs of houses, so covered with ashes that we can’t even walk through them. People saw that the streets were very dark because the air was filled with wisps of gray clouds that really looked like night”

The majestic silhouette of Raung volcano towering more than 3 km above the surrounding plain, with a 2 km wide caldera perched on top. Photo by Lee Siebert: https://volcano.si.edu/gallery/ShowImage.cfm?photo=GVP-01146
To be continued…
References:
Ice Cores/volcanic sulfate:
Sigl, Michael, et al. “Volcanic Stratospheric Sulfur Injections and Aerosol Optical Depth during the Holocene (Past 11 500 Years) from a Bipolar Ice-Core Array.” Earth System Science Data, vol. 14, no. 7, 12 July 2022, pp. 3167–3196, https://doi.org/10.5194/essd-14-3167-2022
Winski, D. A. (2021) “South Pole Ice Core Sea Salt and Major Ions” U.S. Antarctic Program (USAP) Data Center. doi: https://doi.org/10.15784/601851
McConnell, J. (2017) “WAIS Divide Ice-Core Aerosol Records from 1.5 to 577 m” U.S. Antarctic Program (USAP) Data Center. doi: https://doi.org/10.15784/601009
Joseph R. McConnell. (2013). Elemental and chemical measurements of the North Greenland Eemian Ice Drilling core, NEEM-2011-S1, collected in summer 2011 near the NEEM deep drilling site in northwest Greenland. Arctic Data Center. doi:10.18739/A2ST7DX9N.
Joseph McConnell, & Nathan Chellman. (2024). Chemical, elemental, and isotopic measurements of the Tunu2022a and Tunu2022b ice core collected from northeastern Greenland; 2022-2024. Arctic Data Center. doi:10.18739/A22F7JT09.
Siggaard-Andersen, Marie-Louise; Hansson, Margareta E; Steffensen, Jørgen Peder; Jonsell, Ulf; Rasmussen, Sune Olander (2022): NorthGRIP ice-core record of major ions measured using ion chromatography covering the last two millennia and additional short Holocene sections [dataset]. PANGAEA, https://doi.org/10.1594/PANGAEA.944172
Individual eruptions:
Longpré, M., Stix, J., Costa, F., Espinoza, E., & Muñoz, A. (2014). Magmatic processes and associated timescales leading to the January 1835 eruption of Cosigüina volcano, Nicaragua. Journal of Petrology, 55(6), 1173–1201. https://doi.org/10.1093/petrology/egu022
Hutchison, W., Sugden, P., Burke, A., Abbott, P., Ponomareva, V. V., Dirksen, O., Portnyagin, M. V., MacInnes, B., Bourgeois, J., Fitzhugh, B., Verkerk, M., Aubry, T. J., Engwell, S. L., Svensson, A., Chellman, N. J., McConnell, J. R., Davies, S., Sigl, M., & Plunkett, G. (2024). The 1831 CE mystery eruption identified as Zavaritskii caldera, Simushir Island (Kurils). Proceedings of the National Academy of Sciences, 122(1). https://doi.org/10.1073/pnas.2416699122
Gertisser, R., Self, S., Thomas, L. E., Handley, H. K., Van Calsteren, P., & Wolff, J. A. (2011). Processes and timescales of magma genesis and differentiation leading to the Great Tambora eruption in 1815. Journal of Petrology, 53(2), 271–297. https://doi.org/10.1093/petrology/egr062
Guevara-Murua, A., Williams, C. A., Hendy, E. J., Rust, A. C., & Cashman, K. V. (2014). Observations of a stratospheric aerosol veil; from a tropical volcanic eruption in December 1808: is this the Unknown ∼ 1809 eruption? Climate of the Past, 10(5), 1707–1722. https://doi.org/10.5194/cp-10-1707-2014
Tsuji, Y. (2025). Records of a small tsunami observed on the south coasts of Kii Peninsula and Shikoku Island in the early morning of 4th December, 1808. Research Report of Tsunami Engineering Vol.42, 69-73.
Firth, C., Blong, R., Haberle, S., Davies, H., Torombe, M., Coulter, S., Wagner, T., Lee, S., Singura, L., & Denham, T. (2024). Holocene tephras in the New Guinea highlands: Explosive volcanism in the Bismarck arc produces chronostratigraphic markers for interdisciplinary study. The Holocene. https://doi.org/10.1177/09596836241297678
Delfin, francisco jr & Martinez, ML & Salonga, ND & Bayon, Francis Edward & Trimble, D & Solidum, R & Newhall, Chris. (1997). Geological, 14C, and historical evidence for a 17th century eruption of Mt. Parker, southern Philippines. Journal of the Geological Society of the Philippines. 52. 25-42.
Adams, N., De Silva, S., Self, S., Salas, G., Schubring, S., Permenter, J., & Arbesman, K. (2001). The physical volcanology of the 1600 eruption of Huaynaputina, southern Peru. Bulletin of Volcanology, 62(8), 493–518. https://doi.org/10.1007/s004450000105
Sabila, F. S. N., Abdurrachman, M., Saepuloh, A., Kurniawan, I. A., Baraas, A., Yudiantoro, D. F., & Kusdaryanto, H. (2024). Geology, Archaeology, and Historical Studies of the late 16th Century Plinian Eruption of Raung Volcano: a Potential case for Disaster Geotourism in Ijen UNESCO Global Geopark, East Java, Indonesia. Geosciences, 14(11), 284. https://doi.org/10.3390/geosciences14110284


Thank you Héctor! Fascinating article that you must have spent ages researching. Appreciate it very much!
Thanks, Clive!
Very nice read you are very intelligent I think you should go for a master of PHD in geology. Antartica woud be a very nice drill since the icesheets are kilometers deep that means many past caldera eruptions that are buried by newer volcanic deposists at current have their preserved inprints there
Thanks, Jesper!
“Antartica woud be a very nice drill since the icesheets are kilometers deep that means many past caldera eruptions that are buried by newer volcanic deposists at current have their preserved inprints there”
Way too many, though it becomes hard to link to their source volcanoes past a certain point because of incomplete eruption histories for many areas of the world. I think diffusion and layer thinning eventually become a problem too. A very interesting topic, nonetheless, and the larger ones should be identifiable.
Thanks Hector! Lots of food for thought – and discussion.
The nitrate drops are intriguing. It is not so easy to find a clear explanation, including the fact that they are seen only at the South Pole. I am not convinced by the difference between marine and aerial eruptions regarding the nitrate drop. Tambora had a much larger impact on climate than Krakatoa. These are not easily comparable eruptions. (Tambora erupted in April, at the start of austral winter, and Krakatoa late August, at the end of winter, another difference that may be important.)
Nitrate deposition at the South Pole occurs mainly during the summer, meaning in daylight. It comes from several sources, including some long-distance transport during winter, but the main source seems to be photolysis of the antarctic snowpack in sunlight. This produces nitrate in the atmosphere which is transported across the interior of Antarctica. Perhaps the reduction in the strength of sunlight caused by stratospheric sulphate is all that is needed to explain what you find. The fingerprint of the mechanism will be in the oxygen isotopic ratios.
Hunga Tonga did have some effect on the Antarctic ozone hole, but it seems to me that this was due mainly to the water vapour itself, not chlorine: water cooled the stratosphere and this amplified the effect of our zone destroying chemicals. Sulphate in the stratosphere should have the opposite effect, of warming the stratosphere (e.g., https://egusphere.copernicus.org/preprints/2025/egusphere-2024-3825).
Interesting.
Historically, N was supposed to be largely produced by lightening in atmospheric production but globally it is mostly nitrification by bacteria, either cyanobacteria (et al) or by humans from gas. Certainly production by bacterial fixing is hugely sunlight dependent but how to get it atmospheric is not easy to see, nitrates not really being that volatile. Ammonia, of course, is. Anaerobic decomposition of proteins tends to produce ammonia but unless the heap is disturbed, free ammonia is quite rare, probably because its a great energy source. Busting up organic containing anaerobic deep sea layers would be a really good way to liberate ammonia in large amounts. Indeed its still possible to smell ammonia in the siltstone on the Jurassic coast (along with H2S). So I would expect these to be rich (relatively) in “volatiles”.
Thanks Albert.
Regarding the nitrate, it may be useful to know that the typical concentration in the SPC14 core is about 80-100 ppb; it does peak in summer, but this is very variable, very rarely there can be 20 ppb annual variation (between local summer and winter) but normally it is less, and often imperceptible or practically imperceptible at a few ppb or less, so it’s likely that most nitrate is far-travelled. Volcanic nitrate drops can be very large, up to 30 ppb, which is far more than the usual annual variability in nitrate concentration.
I think SO FAR the nitrate is working well to distinguish submarine events. None of the historical subaerial eruptions have “large” nitrate drops, but Krakatau does, and the signal usually attributed to Kuwae (1457) has what is probably the largest nitrate volcanic drop since 1000 AD. It also explains why there are so many spikes between 1000 and 1300 AD but so few known eruption candidates, since some of the spikes around this time have large nitrate drops that could suggest submarine calderas.
The nitrate drop following volcanic eruptions was first reported in https://agupubs.onlinelibrary.wiley.com/doi/abs/10.1029/JD095iD04p03493, to the best of my knowledge. They suggest that the cause is related to the reduction in UV light because of the shadowing by sulphate. I think photolysis in snow would provide a plausible mechanism for the nitrate drop at the South Pole. The photolysis occurs down to around 1 meter depth in the snow: the nitrate that is produced circulates around Antarctica and reaches the South Pole (where the solar irradiation is always very low as the sun is so low in the sky, even in ‘summer’). If the photolysis would reduce, less nitrate would reach the South Pole. It would fit the decrease and the fact it is not seen near the coasts of Antarctica.
“The fact it is not seen near the coasts of Antarctica.”
I’m not entirely sure if it’s present in the rest of Antarctica or not. I have looked at the WAIS and didn’t see obvious signals, but there the background nitrate variability is large enough that it might obscure the volcanic signals. I haven’t checked other cores.
My guess as to why it was only seen in the South Pole is that this is where ozone holes are presumably easier to form, that the icecap here is very tall nearly 3 km so maybe also more exposed to UV light, that in this area the atmospheric circulation should generally be downwelling so have more stratospheric input, and that nitrate can be destroyed through photolysis mainly by UV light, turning, among other things, into nitrogen dioxide gas (that would presumably escape). But I’m no expert so this was highly speculative.
I am equally speculating! We just don’t have the data. The oxygen isotopic ratio is quite sensitive to the original of the nitrate, so that would be something to go for.
The ozone hole that developed from the 1980’s has not affected the nitrate concentration at the South Pole, but it did change its isotopic ratios. https://acp.copernicus.org/articles/22/13407/2022
I think I see some correlation between the mean ozone hole size for 07 September–13 October and the nitrate levels in the South Pole. Years with a larger ozone hole seem to have lower nitrate concentrations.
https://pmc.ncbi.nlm.nih.gov/articles/PMC9314437/
Working for BAS as a young man in the mid 80s’, part of my duties were to collect weekly ice samples from the surface at Halley (IV) 75, Antarctica. These were bottled, an isotope added and then shipped out annually to be sent to Harwell. I have no idea what exactly these were analysed for. But it would be a direct sample covering multi years, a record of the nitrate isotope ratio could then be directly matched to met records and accumulation rates which we also recording.
Remote sensing is indeed a phenomenal tool, but there are certain things that only a human with a bucket or thermometer can verify.
BTW, re UV and the ‘ozone hole’. The Dobson Spectrometer (used from the IGY 1956/7 until the late 80s at least) was a beautifully simple and well designed comparator, comparing the spectral lines of the attenuation of UV from the ozone creation/reduction reactions (around 160 and 250 odd nm) with UV from ‘just off’ this wavelength. Because there is such a sharp cut-off, a comparison of the sunlight intensity at those wavelengths could be used to infer the amounts of ozone in the strat.
There is ‘extra UV’ due to the attenuation of ozone, but it is only at certain fairly discrete wavelengths, and the overall levels might vary far more with variation in received direct sunlight, imho.
*75 deg south
Can you give the chemical reaction you are referring to , please Albert?
2NO3 -> N2 + 3O2?
Not one I have come across before. Mostly because in reality its more like
NaNO3 going to what, exactly? NaOH?? Not very energetically favourable.
Normally denitrification involves either ammonium or a carbon oxidation. I wouldn’t expect either to be easily adjacent in rainwater. CO2/CO3 is possible, I guess, but still a big energy differential as CO3 (ion) is very weak compared to NO3.
Reaction R4 requires far UV photons which aren’t really available.
From https://pubs.rsc.org/en/content/articlelanding/2022/ea/d1ea00087j
https://browser.dataspace.copernicus.eu/?zoom=13&lat=-1.46017&lng=29.16973&themeId=DEFAULT-THEME&visualizationUrl=U2FsdGVkX18HCKcbtIu6M7af%2BK%2FD8hwwQOlFjdl7ZaeWovirI6Qefsp3UkC3B1H3ibpT2fMmqTqvDL7WXO0Ef5DxTpy99D9kcWMMj4U%2FRfgFTcmBOgrufDvRRh5VmWmY&datasetId=S2_L2A_CDAS&fromTime=2025-09-28T00%3A00%3A00.000Z&toTime=2025-09-28T23%3A59%3A59.999Z&layerId=2_TONEMAPPED_NATURAL_COLOR&demSource3D=%22MAPZEN%22&cloudCoverage=32&dateMode=SINGLE
Nyiramuragira continues to be a monster infact as a induvidual volcano it maybe the worlds 3th most monsterious mafic shield one after Kilauea and Mauna Loa in terms of magma input, Bardarbunga maybe analougus in its deeper magma supply to Nyiramuragira 0,05 – 0,06 km3 per year but in Iceland most supply for volcanic systems never surfaces leaving Nyiramuragira as perhaps the worlds third most powerful induvidual mafic shield at current. Here is an impressive Nyiramuragira satelite shot taken of the massive pyrocumulonimbus that constantly hovers over the now 450 meters wide lava lake, it must be a rainy acid mess below this for certain. Virunga friends on facebook living in Goma showing a constantly hazy polluted sky
https://browser.dataspace.copernicus.eu/?zoom=18&lat=-1.40977&lng=29.20648&themeId=DEFAULT-THEME&visualizationUrl=U2FsdGVkX1%2BT5uKcbHQiA8fgJC8fS6NJBU0T137Kz0Ykv6OFTAbY8buZ7GBjEWtJqF8obTjytf1I69kc0Nqef68OUGY0q30WBmYorTeHrQLIeRY5dSP7if1l854NE4hE&datasetId=S2_L2A_CDAS&fromTime=2025-08-29T00%3A00%3A00.000Z&toTime=2025-08-29T23%3A59%3A59.999Z&layerId=2_TONEMAPPED_NATURAL_COLOR&demSource3D=%22MAPZEN%22&cloudCoverage=32&dateMode=SINGLE
Recent october shot of the lava lake little over 400 meters long
It is enormous! the current lava lake lenght is 430 meters today october 2025 and in may 2025 it was around 380 meters. I concludes that the whole NE pit crater past infill lava apparently have collpased into the shallow magma chamber conduit pipe under the volcano becomming one huge gassy boiling lava lake. It is a very intresting vent development. It will be incrediblely intresting if the lava lake happens to grow much larger than the diameter of the NE pit itself, if that happens it coud be an indication of the caldera roof itself falling into the shallow magma chamber, this was also a thing of the past halemaumau lava lake that coud also have easly grown that large if it was not destroyed first
: D I hopes we gets photos from its edges soon it is a bubbling enraged mess with 10 s if not many 100 s of giant bubbles popping at once and huge waves spreading over a thin dark skinn
South vent has had a few mini-strombolian spattering episodes starting around 9pm HST
First one at 6:25pm started very suddenly with a small bang. Looks like the gas pistoning phase will be quite interesting to follow this time.
Thank-you for the summary of the most important explosive eruptions during these centuries!
I only knew about the famous eruptions of Krakatau and Tambora. So it was an opportunity to learn about unkown volcanoes. Raung was known to me, but not as a source for a huge eruption. It shows that the next great explosive eruption may happen at a unexpected location. The eruptions confirm that the Pacific Ring of Fire dominates global volcanism and that anything else are side vents. Can we classify segments of the Pacific Ring of Fire which are more prone or less prone to big explosive eruptions?
Kamchatka and the Aleutians imo are pretty obvious segments.
Very large calderas produced by gargantuan eruptions littered across those areas.
These parts also feel a bit like white areas in the map, where we likely have a lack of knowledge.
https://m.youtube.com/watch?v=31C7w_qMqTA&pp=ygUSc3RhcnNoaXAgZmxpZ2h0IDEx0gcJCfwJAYcqIYzv
https://m.youtube.com/watch?v=b-H_0gow6Hg&pp=ygUSc3RhcnNoaXAgZmxpZ2h0IDEx
Elon Musk starting starship in a few hours .. here are the livestreams
They should name their ships .. I will call this one Grok … hahaha 😛
X live coverage is here, starting in less than an hour (if all goes as planned):
https://x.com/i/broadcasts/1mrGmBjyEZgJy
Apology to Héctor: I’ve not read his article yet, but will. Big kabooms are interesting. I hope Elon’s enormous rocket doesn’t have a big kaboom.
Hope it fails.
Succeeded.
Ridiculously good show. Like watching Star Wars the very first time. Which I went to the cinema for six times in 1977.
A sort of epitaph: the Starship successfully ‘landed’ on the Indian Ocean just to the west of we Aussie peoples, then fell over and went kaboom. That won’t happen when it gets caught by the chopsticks though.
A silly thought, but presumably no trade secrets left after that. Its quite hard to see why it went kaboom although residual gas and tank rupture (not designed to fall over) might contribute.
Scott Manley covers most (all?) space launches – he seems to do a very thorough walk through in general. This link is to his video on the starship launch and also mentions the mini hover (simulating the chopsticks catch) and then the deliberate drop to explode and sink
https://youtu.be/-0FcQzDG3C8?si=i_cOoGCJZLtT-dqg
spacex seem to be doing an impressive job progressing reusable launch tech even if I don’t particularly like the politics of their major share holder
M4 at Bardarbunga. Not quite Thomas-level, but decent
It’s getting there 🙂
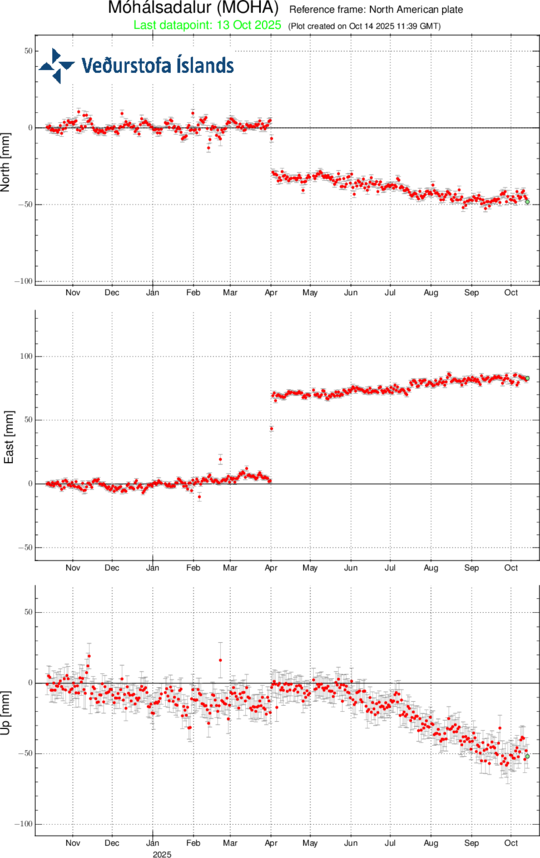
KISA GPS is still accelerating towards NW. Every M5 quake sets it back some 20mm, but the slope between events seems to be getting steeper every time. If I remember correctly, I think I projected the next one to happen in October or November. Now we’re halfway through October and tension is rising. This M4 might delay the bigger one by a couple of weeks, but no more than that. If it keeps accelerating, I think this could very well end up with an eruption within a few years from now. Maybe a subglacial eruption from a cone sheet intrusion reaching the surface.
One thing to note is that the Holuhraun eruption probably didn’t stop because it ran out of magma. I believe It stopped because the pressure differential between the magma chamber and the eruption site simply became to small to overcome the resistance in the dyke. The reason I think this is that it slowed down gradually at a rate that was proportional to the measured subsidence and followed that curve all the way until it stopped. Kilauea did the opposite in 2018. It stopped suddenly, without a gradual slowdown. This indicates that either Kilauea had emptied the sill that was draining into the rift, or that the conduit was blocked in the collapse.
If my reasoning is correct, it could mean that, potentially, there’s enough magma still down there to feed another large rifting eruption. All that would be needed is a new dyke with a geometry that would allow magma to flow. Personally I think that’s still decades away, but I’m starting to have second thoughts now that the inflation keeps accelerating the way it does.
I think Holuhraun stopped when the flow rate became low enough that it allowed magma to solidify during the time spend in the dike. As the pressure drops, the dike narrows (it is kept wide by the internal pressure) and cooling becomes faster. I think this is in effect the same as your proposal. Most of the magma is still in Barby, but it is less eruptible. It could feed an eruption on a short rift. North of the caldera would be a possibility.
A couple months back there was an RUV article that said Bardarbunga is about 1/3 recovered from Holuhraun. The collapse volume at the end was a bit under 2 km3, so roughly 0.6 km3 of magma refilled in 10 years although its not unlikely most of that could be in the last couple years. Linear projection gives a recovery for Holuhraun in about 20 years time, and then maybe another 10-20 more years to get the magma needed to go down to Veidivotn.
That is ignoring the possibility it has sped up in recent years though. Kilauea sped up pretty dramatically last year, 6 years after a similar collapse, really wouldnt be that surprising Bardarbunga behaves similar. I bet thats what a lot of the quakes at ‘greip’ were.
In any case Torfajokull has inflated in recent years and might still be, and Hekla is also primed, they might well force the rifting early. Plus now Holuhraun has relieved tension north of Vatnajokull, and Reykjanes is moving the boundary too. All that combines to leave Veidivotn looking like the next option for rifting. Its looking very likely within 50 years tbh.
The 30% recovered was referring to measurements from 2023, so 1/3 in 8 years…results from this year havent been published yet sadly.
Would be good to know what it is now, if it is inflating faster. If its 1/3 in 8 years thats 0.075 km3 a year, maybe closer to 0.1 km3 now if its sped up and taking Grimsvotns supply.
While Bárðarbunga is currently inflating like crazy, Grimsvötn has come to a complete stop. At least when looking at the GPS. It seems like it halted after the Grimsvötn M4.2 in January 2024.
Maybe the M4.2 caused changes in the plumbing, and all supply now goes to Bárðarbunga?
Holohraun was a rifting event. Did this rifting change the way Grimsvötn and Bardarbunga behave for a while? A rifting is a tectonic event, so it changes geography. But is/was it strong enough to have an impact on the deeper system?
Can we pick up any clues from this?
has there been any new info about the magma run in january this year?
Nothing that has got caught in my filter.
After the Glacier Laup (run) in January no eruption followed obviously. This was a possibility with a unkown probability.
I think the question was about the intense ring fault earthquake swarm in January. That was probably caused by magma intruding in a cone sheet. That’s exactly the type of event that might lead to an eruption.
Krysuvik has had subsidence. What can be a reason?
Svartsengi: The maximum amount of magma that needs to accumulate for an eruption is estimated at 23 million cubic meters. Models predict that this will be reached by the end of December, if the rate of magma accumulation doesn’t change. So we can be nearly certain that a third Icelandic eruption will happen 2025.
Could it be some sort of hydraulic coupling between reservoirs? I know plate spreading also leads to subsidence but it is too strong in this case I think. Its also stronger than previous deflation episodes caused by gas/fluid movements.
I think it might be plate thinning due to spreading. In the long run this becomes a weak spot that increases the probability of an eruption there.
Wow.
At least these ‘Historical’ eruptions are not complicated by glacial-period low-stand sea-levels bringing ‘Just Submerged’ vents / caldera to surface…
Very nice job, Héctor, an interesting read! A suggestion for the next installment; include the N-S v. Time graph(s) that illustrate your eruption correlation picks. I found myself wanting to see the plots that you describe, just as your 13th century example in the introduction. Cheers!
Vestmannaeyjar is just an exercise!
FVXX01 at 16:34 UTC, 14/10/25 from EGRR
VA ADVISORY
STATUS: EXER
DTG: 20251014/1627Z
VAAC: LONDON
VOLCANO: VESTMANNAEYJAR 372010
PSN: N6325 W02021
AREA: ICELAND
SUMMIT ELEV: 283M
ADVISORY NR: 2025/003
INFO SOURCE: ICELAND MET OFFICE
AVIATION COLOUR CODE: GREEN
ERUPTION DETAILS: ENDEX
OBS VA DTG: 14/1623Z
OBS VA CLD: NO VA EXP VA NOT IDENTIFIABLE FM SATELLITE DATA WIND
FL100/300 250/45KT
FCST VA CLD +6 HR: 14/2223Z NO VA EXP
FCST VA CLD +12 HR: 15/0423Z NO VA EXP
FCST VA CLD +18 HR: 15/1023Z NO VA EXP
RMK: ENDEX
NXT ADVISORY: NO LATER THAN 20251014/2225Z
I think the Vestmannaeyars are a good choice for a volcano expedition in Iceland. A relatively new and famous volcano (Eldfell) that can be visited. The crater is 100% safe without any volcanic risks. The volcano is close to civilization and only a hill compared to mountainous volcanoes.
I stumbled across this paper today: https://cp.copernicus.org/articles/18/485/2022/#section4, and scrolling down to sections 4.3 and 4.4 and looking at the chart of eruptions ranked by global climate forcing, I’m curious to see what candidates there could be for the spikes higher than the spike from Oruanui. My rudimentary digging so far hasn’t led me to any seemingly viable candidates. If anyone has any ideas, I’d love to hear about them!
It does say that Oruanui isn’t present in this Greenland core, so it could just be geological bias.
For instance Deception Island was closer to where the Antarctic core was taken from so may show up as a higher spike.
Shikotsu caldera erupted 45000 years ago and this is found in both cores so the ‘unknown’ could be that. The 55000ka is stated to be Icelandic – this has been found all across the north sea in the Faroes etc. and is a mix of basalt and rhyolite, it could well be from Torfajokull or similar.
I should’ve specified my questions a big more. I did see the info about which spikes were likely from Iceland, Campi Flegrei, Oruanui, etc.
I was more curious on the other top ones discussed in the paper that have, at least at the time of the article’s writing, an unknown source.
I have some doubts about Shikotsu being the culprit behind the 2nd largest spike given the uncertainty I have seen with regard to dating its caldera forming blast.
Tangentially related to this topic, but I would LOVE to have more info on the effect the Oruanui and Hatepe eruptions had on the climate of the Northern Hemisphere. I’ve searched far and wide for a good lone while now across all the publicly available papers and sites I can find, but I couldn’t find any definitive answers for that. If someone else knows, I’d love to hear about that too!
I will throw this idea out, cannot we begin to use AI to date these explosions? I look at google maps, such as the Kermadec area and the Kurile Islands area, even the Aleutians, and the condition of the craters is a strong hint as to when the event actually occurred. I believe AI would be superior to manual reasoning, in ascribing accurate dates for these events. Just my $0.02 worth.
I personally don’t trust AI with anything, eruption dating included. Besides, doesn’t AI pull from actual human sources anyways?
I think some of the problem is that lots of different processes are all being bundled together (probably as a means to secure investment).
Artificial general intelligence (AGI) is I think roughly defined as ‘actually able to reason as well as a human’ – and that is what everyone is ‘selling’ when they say they are working on AI.
Large language models (LLM) should not be trusted to produce anything better than ‘what a likely sounding answer would be if you asked the internet’ – they are really good at making plausible sounding text that is relatively consistent. And obviously a similar tech exists for image/video processing.
Big complex sorting and categorizing algorithms which try to pull out anomalies from a mass of data – seem to be pretty good at finding things like ‘suspected breast cancer’ from mammograms – and so that type of ‘AI’ might be able to grab some pattern in the types of data Hector was looking at for this article – but it would need someone like Hector in conjunction to point it at appropriate data sets to try and pick out any patterns.
I think you’re oversimplifying the LLM models. They are more sophisticated than this. Still, they can go wrong especially when making up facts. But then, we all know people who do the same.
And Lewotobi Laki-Laki has gone kaboom again.
Lewotobi volcano erupts, belching ash into night sky (15 Oct)
A busy little volcano!
It keeps sealing itself up and then blowing off the cap. Not very entropically efficient.
I can see it going the way of Soufriere St.Vincent and eventually blowing a large enough crater to release pressure, and then eventually the whole cycle will come to a halt. That or it will end up going Vesuvius pre-Somma.
il Vulcano (=”the volcano”) did an above average steam plume:
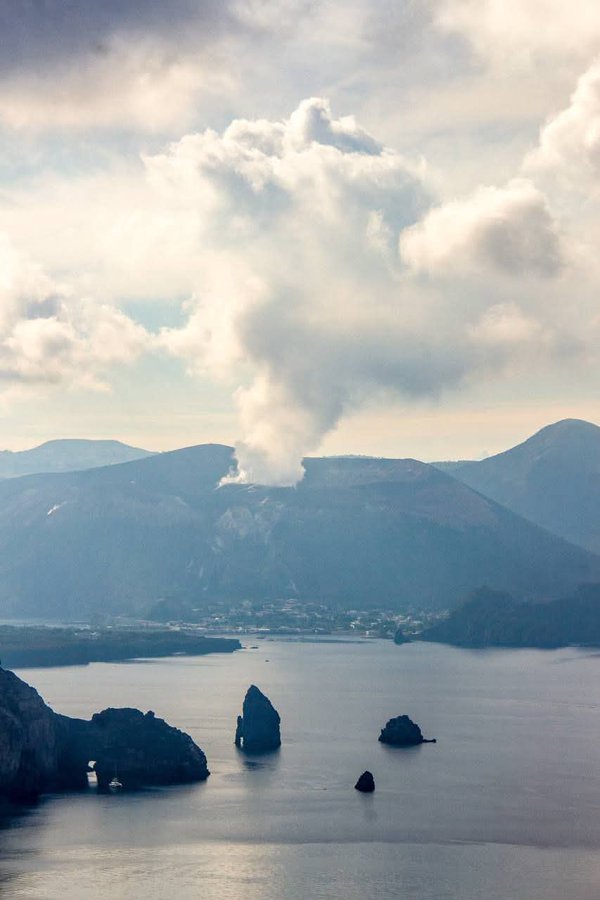
https://www.volcanodiscovery.com/vulcano/news.html
The current unrest appears more serious than the last one 2021. Maybe the volcano is slowly step for step preparing for next eruption.
You do wonder about the safety of the houses below the plume
Safety of the houses, or once again human foolishness? My dad, a civil engineer, advised against putting trailer parks in a known river bed (in Southern CA) His advice was overruled, along came the 100 year flood, floating trailers out into the Pacific, and all people did was get mad and want to sue anybody in sight. This is human nature, quite predictable.
Vulcano is a very volcano shaped volcano… lol
Although, ironically not the most volcano shaped volcano, not even the most volcano shaped volcano in Italy actually…
Shishaldin – villaricca ?
Shishaldin – villaricca ? had they been in a tropical rainforest in an island arc then they woud be ultra stereotypical
Vulcano hasn’t erupted for a long time, so we lack any recent observation of the original for the class of Vulcanian eruptions. What volcano in the world comes close to the historical eruption style of Vulcano?
Are Italy’s volcanoes good prototypes for eruption classes? Most volcanoes in the world are around the Pacific ocean and have very different geological situation to Italy (Stromboli, Vulcano, Vesuvius).
This week is going to be the first Kilauea episode during the US shutdown. It will be a test for the state of Hawaii how it’s going to cope with volcanism with less federal support. There is a risk that also volcano observatory employees will lose their jobs.
The overgrown mega carrot in charge also haves a funny face photo in Times.. hopes HVO can get working again
The Icelandic Met Office has put out an update today.
Uncertainty over eruption – but “something” likely before Christmas (RÚV, 15 Oct)
It’s not been quite as exciting as Kilauea but it’s still fun to watch the wind up and the final result when the fissure opens.
Im still hoping for a >0.1km³ eruption (ideally during clear daytime) with an initial fissure opening that beats august 2024 :/ I feel like we’d need to accumulate a bit more magma than what we had prior to april 1st in order for that to become a possibility tho
The question to ask Kristin in this “Kristin, has observations of the fiber optics in regard to strain changes given you any heads up on the impending eruption?” See https://timesofinnovation.com/3d-technology/lava-alert-icelands-62-mile-fiber-optic-cable-to-give-warning-for-volcano-eruptions/.
I went ahead and asked the IMO. I am hoping that they will respond.
The IMO promptly replied to my inquiry, and said that yes, they are using fiber optic strain measurements on a fiber optic cable in the Reykjanes Peninsula and they said it has proved to be quite effective. The raw data is posted at https://www.youtube.com/watch?v=b3bbQKjoXII
Now all we need is a fiber strain optics expert to explain what we are looking at 😉
I think they reported that the last eruption was detected with the fiber optic equipment within the same timeframe as the borehole changes. In other words they can see when a dyke intrusion has started, which gives some 30 minutes or so advance warning about an impending eruption.
Not an expert at all, but microseismicity shows up on that plot as horizontal lines.
The diagonal lines commonly seen during waking hours are road traffic. The difference between horizontal and diagonal lines is due to the vast difference between vehicle speeds and seismic wave propagation speed! 🙂
Svartsengi entertains us with kindergarten eruptions until Bardarabunga, Hekla or … will do adult eruptions again.
Around 7:36 AM Hawaii time, the south vent had a overflow. One step towards the upcoming episode (Ep. 35 or 36? Lost count).
Continuous swarm at CCN
anything different or unique from the previous swarms?
A lot of quakes are appearing on the E flank of the Cerro Negro cone. Probably dike related but there needs to be a more comprehensive report before I can say anything else
South vent is overflowing nicely with some splattering from the north vent.
Maybe the south will be first this time?
Mac
The current overflow looks very smooth and fast. Notably low viscosity
I should have said first to fountain.
Mac
Visible lava surface in north vent a few minutes ago (V1cam). Almost joining in on the overflow action.
Yes, it has had at least two lava flash floods. Deformation at UWD tiltmeter is slowly approaching +0. Are we already close to the tipping point towards negative deformation?
New post is up! The volcano Iceland lost
https://www.volcanocafe.org/the-beerenberg-volcano/
Wow, this must be a great read, very interesting and great pics. Will certainly study it later, no time whatsoever. Hope everybody is fine.